Report Code: A10375 | Mar 2021 | Pages: 266 | ||
Tables: 122 | Charts: 56 |
|
Pandemic disrupted the entire world and affected many industries.
Get detailed COVID-19 impact analysis on the Magnetic Beads Market
Request Now !
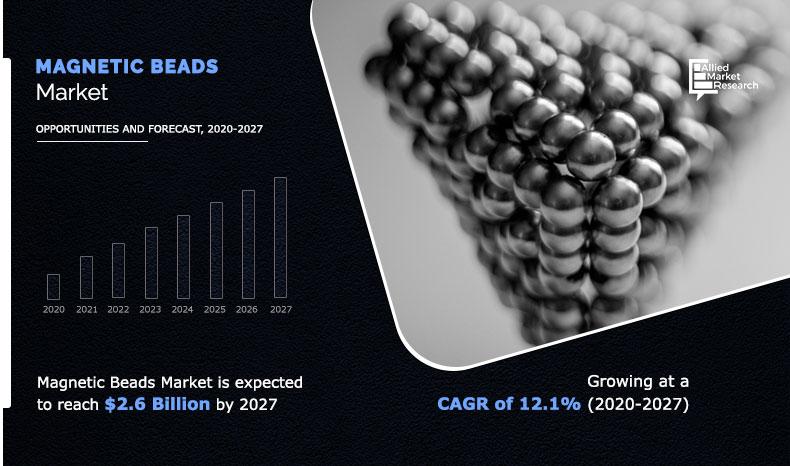
The global magnetic beads market forecast was valued at $1.1 billion in 2019, and is projected to reach $2.6 billion by 2027, growing at a CAGR of 12.1% from 2020 to 2027.
The COVID-19 outbreak has impacted positively on the global magnetic beads market owing large-scale testing of coronavirus infection by using RT-qPCR and RT-LAMP requires the use of magnetic beads.
Magnetic bead, is a tool that rotates and generates stirring action when immersed in appropriate liquid. It is incorporated for effective separation of micrometer-sized para-ferromagnetic and ferromagnetic particles from chemical or biological suspensions. In addition, magnetic beads are used for extraction of DNA and RNA as well as for co-extraction of DNA and RNA from sputum. Magnetic beads embedded with magnetic nanoparticles in a suitable matrix are used in diagnosis and therapeutic application in the medical sector. Moreover, they are used for purification of cells, protein, nucleic acid, and other molecules in proficient and precise manner. Magnetic beads are available in different sizes, chemical composition, and shapes depending upon type of application. They are widely adopted for bio-separation process by coating them with specific ligands for targeting molecule and cell.
The growth of the global magnetic beads market is majorly driven by surge in adoption of magnetic beads in life science applications, including molecular biology, immunoassays, and medical applications. In addition, alarming rise in acute respiratory infections (ARIs) is increasing the susceptibility of developing severe diseases, such as pneumonia. Pneumonia, in turn, leads to high morbidity and mortality rates among children. Thus, development of effective way for diagnosis and providing timely treatment has increased the burden on healthcare system. Nucleic acid amplification is widely adopted diagnosis method for detection of respiratory tract infections and ARIs. Recently, magnetic beads are used for nucleic acid amplification, which, in turn, has reduced the mortality rate due to ARI. Hence, the global magnetic beads market size is expected to witness steady growth during the forecast period. However, protein and cellular purification is a time-consuming process and requires additional accelerators such as addition of fine particles, which incur extra cost, thereby hampering the growth of global magnetic beads market. On the contrary, increase in need for improved medical care at reduced cost is anticipated to offer lucrative opportunity for the expansion of the global market during the forecast period. Coupled with aging population and reduction of in vitro diagnostic (IVD) cost, key players in the medical sector are adopting magnetic beads as an alternative choice for diagnosis. This factor is further expected to act as a potential opportunity for the global magnetic beads market growth.
The global magnetic beads market analysis is done based on magnetic core, size, application, and region. Depending on magnetic core, the market is segmented into ferrimagnetic and superparamagnetic. By size, it is fragmented into less than 5um, 5-20 um, 20-40 um, and 40 um &above. The applications covered in the study include sample preparation, biomolecules separation & purification, molecular & immunodiagnostics, and others.Region wise, the magnetic beads market is studied across North America, Europe, Asia-Pacific, and LAMEA. Presently, North America accounts for the largest share in the global market, followed by Europe and Asia-Pacific. The major companies profiled in this report include Thermo Fisher Scientific Inc., Advanced BioChemicals (ABC), Promega Corporation, Zeesan Biotech Co. Ltd., New England BioLabs Inc., Calbiotech, MagBio Genomics, Teja Scientific Glass Works, Vazyme Biotech Co. Ltd., and Alcon Scientific Industries.
The Asia-Pacific magnetic beads market is projected to grow at the highest CAGR of 13.6% during the forecast period, accounting for 37.8% of the magnetic beads market share by 2027.Conversely, North America accounted for largest share in 2019, and is predicted to reach $1.1 billion by 2027.This is attributed to rise inadoption of magnetic beads for integrated DNA and RNA extraction in parts of the U.S. In addition, the medical sector in Canada is witnessing increased adoption of magnetic beads for immunoassay, which is predicted to propel the growth of the market in this region.
In 2019, the ferrimagnetic beads segment was the largest revenue contributor, and is anticipated to grow at CAGR 10.4% in the forecast period, whereas the superparamagnetic beads segment is estimated to register a CAGR of 11.2%.
In 2019, the less than 5um sized magnetic beads segment garnered the highest revenue, and is anticipated to grow at a CAGR of 11.4% during the forecast period. On the other hand, the 5-20 um sized magnetic beads segment is anticipated to grow with 10.5% CAGR in the near future.
In 2019, the biomolecules segment led the global market, in terms of revenue generation, and is anticipated to grow at a CAGR of 11.3% during the forecast period, whereas the sample preparation segment is anticipated to grow with 10.7% CAGR.
Key benefits for stakeholders
Impact Of Covid-19 On The Global Magnetic Beads Market
Magnetic Beads Market Report Highlights
Aspects | Details |
---|---|
By MAGNETIC CORE |
|
By SIZE |
|
By APPLICATION |
|
By Region |
|
Key Market Players | Zeesan Biotech Co. Ltd, New England BioLabs Inc, Calbiotech, Vazyme Biotech Co. Ltd, Teja Scientific Glass Works, Advanced BioChemicals (ABC), Promega Corporation, Alcon Scientific Industries, MagBio Genomics, Thermo Fisher Scientific Inc |
CHAPTER 1:INTRODUCTION
1.1.Report description
1.2.Key benefits for stakeholders
1.3.Key market segments
1.4.Research methodology
1.4.1.Secondary research
1.4.2.Primary research
1.5.Analyst tools and models
CHAPTER 2:EXECUTIVE SUMMARY
2.1.Key findings of the study
2.2.CXO perspective
CHAPTER 3:MARKET OVERVIEW
3.1.Market definition and scope
3.2.Key findings
3.2.1.Top investment pockets
3.3.Porter’s five forces analysis
3.4.Market dynamics
3.4.1.Drivers
3.4.1.1.Rise in utilization of magnetic beads in medical applications
3.4.1.2.Application of magnetic beads in bioassays and magnetic separation techniques
3.4.1.3.Rise in adoption of magnetic beads in life science applications
3.4.2.Restraint
3.4.2.1.Requirement of additional accelerators and time consuming process involved during protein purification
3.4.3.Opportunity
3.4.3.1.Rise in need for reduced medical cost coupled with improved medical care
3.5.Value chain analysis
3.6.Impact of key regulations on the global magnetic beads market
3.7.Impact of COVID-19 on the global magnetic beads market
3.8.Patent analysis, 2012-2020
CHAPTER 4:GLOBAL MAGNETIC BEADS MARKET, BY MAGNETIC CORE
4.1.Overview
4.1.1.Market size and forecast, by magnetic core
4.2.Ferrimagnetic
4.2.1.Key market trends, growth factors, and opportunities
4.2.2.Market size and forecast, by region
4.2.3.Market share analysis, by country
4.3.Superparamagnetic
4.3.1.Key market trends, growth factors, and opportunities
4.3.2.Market size and forecast, by region
4.3.3.Market share analysis, by country
CHAPTER 5:GLOBAL MAGNETIC BEADS MARKET, BY SIZE
5.1.Overview
5.1.1.Market size and forecast
5.2.Less than 5 um
5.2.1.Key market trends, growth factors, and opportunities
5.2.2.Market size and forecast, by region
5.2.3.Market share analysis, by country
5.3.5-20 um
5.3.1.Key market trends, growth factors, and opportunities
5.3.2.Market size and forecast, by region
5.3.3.Market share analysis, by country
5.4.20-40 um
5.4.1.Key market trends, growth factors, and opportunities
5.4.2.Market size and forecast, by region
5.4.3.Market share analysis, by country
5.5.40 um & above
5.5.1.Key market trends, growth factors, and opportunities
5.5.2.Market size and forecast, by region
5.5.3.Market share analysis, by country
CHAPTER 6:GLOBAL PEST CONTROL MARKET, BY APPLICATION
6.1.Overview
6.1.1.Market size and forecast
6.2.Next Generation Sequencing (NGS)
6.2.1.Key market trends, growth factors, and opportunities
6.2.2.Market size and forecast, by region
6.2.3.Market share analysis, by country
6.3.Biomolucules Separation & Purification
6.3.1.Key market trends, growth factors, and opportunities
6.3.2.Market size and forecast, by region
6.3.3.Market share analysis, by country
6.4.Molecular & Immunodiagnostics
6.4.1.Key market trends, growth factors, and opportunities
6.4.2.Market size and forecast, by region
6.4.3.Market share analysis, by country
6.5.Others
6.5.1.Key market trends, growth factors, and opportunities
6.5.2.Market size and forecast, by region
6.5.3.Market share analysis, by country
CHAPTER 7:MAGNETIC BEADS MARKET, BY REGION
7.1.Overview
7.1.1.Market size and forecast
7.2.North America
7.2.1.Key market trends, growth factors, and opportunities
7.2.2.Market size and forecast, by magnetic core
7.2.3.Market size and forecast, by size
7.2.4.Market size and forecast, by application
7.2.5.Market share analysis, by country
7.2.6.U.S.
7.2.6.1.Market size and forecast, by magnetic core
7.2.6.2.Market size and forecast, by size
7.2.6.3.Market size and forecast, by application
7.2.7.Canada
7.2.7.1.Market size and forecast, by magnetic core
7.2.7.2.Market size and forecast, by size
7.2.7.3.Market size and forecast, by application
7.2.8.Mexico
7.2.8.1.Market size and forecast, by magnetic core
7.2.8.2.Market size and forecast, by size
7.2.8.3.Market size and forecast, by application
7.3.Europe
7.3.1.Key market trends, growth factors, and opportunities
7.3.2.Market size and forecast, by magnetic core
7.3.3.Market size and forecast, by size
7.3.4.Market size and forecast, by application
7.3.5.Market share analysis, by country
7.3.6.Germany
7.3.6.1.Market size and forecast, by magnetic core
7.3.6.2.Market size and forecast, by size
7.3.6.3.Market size and forecast, by application
7.3.7.France
7.3.7.1.Market size and forecast, by magnetic core
7.3.7.2.Market size and forecast, by size
7.3.7.3.Market size and forecast, by application
7.3.8.Italy
7.3.8.1.Market size and forecast, by magnetic core
7.3.8.2.Market size and forecast, by size
7.3.8.3.Market size and forecast, by application
7.3.9.Spain
7.3.9.1.Market size and forecast, by magnetic core
7.3.9.2.Market size and forecast, by size
7.3.9.3.Market size and forecast, by application
7.3.10.U.K.
7.3.10.1.Market size and forecast, by magnetic core
7.3.10.2.Market size and forecast, by size
7.3.10.3.Market size and forecast, by application
7.3.11.Rest of Europe
7.3.11.1.Market size and forecast, by magnetic core
7.3.11.2.Market size and forecast, by size
7.3.11.3.Market size and forecast, by application
7.4.Asia-Pacific
7.4.1.Key market trends, growth factors, and opportunities
7.4.2.Market size and forecast, by magnetic core
7.4.3.Market size and forecast, by size
7.4.4.Market size and forecast, by application
7.4.5.Market share analysis, by country
7.4.6.China
7.4.6.1.Market size and forecast, by magnetic core
7.4.6.2.Market size and forecast, by size
7.4.6.3.Market size and forecast, by application
7.4.7.Japan
7.4.7.1.Market size and forecast, by magnetic core
7.4.7.2.Market size and forecast, by size
7.4.7.3.Market size and forecast, by application
7.4.8.India
7.4.8.1.Market size and forecast, by magnetic core
7.4.8.2.Market size and forecast, by size
7.4.8.3.Market size and forecast, by application
7.4.9.South Korea
7.4.9.1.Market size and forecast, by magnetic core
7.4.9.2.Market size and forecast, by size
7.4.9.3.Market size and forecast, by application
7.4.10.Australia
7.4.10.1.Market size and forecast, by magnetic core
7.4.10.2.Market size and forecast, by size
7.4.10.3.Market size and forecast, by application
7.4.11.Rest of Asia-Pacific
7.4.11.1.Market size and forecast, by magnetic core
7.4.11.2.Market size and forecast, by size
7.4.11.3.Market size and forecast, by application
7.5.LAMEA
7.5.1.Key market trends, growth factors, and opportunities
7.5.2.Market size and forecast, by magnetic core
7.5.3.Market size and forecast, by size
7.5.4.Market size and forecast, by application
7.5.5.Market share analysis, by country
7.5.6.Brazil
7.5.6.1.Market size and forecast, by magnetic core
7.5.6.2.Market size and forecast, by size
7.5.6.3.Market size and forecast, by application
7.5.7.Saudi Arabia
7.5.7.1.Market size and forecast, by magnetic core
7.5.7.2.Market size and forecast, by size
7.5.7.3.Market size and forecast, by application
7.5.8.UAE
7.5.8.1.Market size and forecast, by magnetic core
7.5.8.2.Market size and forecast, by size
7.5.8.3.Market size and forecast, by application
7.5.9.South Africa
7.5.9.1.Market size and forecast, by magnetic core
7.5.9.2.Market size and forecast, by size
7.5.9.3.Market size and forecast, by application
7.5.10.Rest of LAMEA
7.5.10.1.Market size and forecast, by magnetic core
7.5.10.2.Market size and forecast, by size
7.5.10.3.Market size and forecast, by application
CHAPTER 8:COMPETITIVE LANDSCAPE
8.1.INTRODUCTION
8.1.1.MARKET PLAYER POSITIONING, 2020
8.2.TOP WINNING STRATEGIES
8.2.1.Top winning strategies, by year
8.2.2.Top winning strategies, by development
8.2.3.Top winning strategies, by company
8.3.PRODUCT MAPPING OF TOP 10 PLAYER
8.4.COMPETITIVE DASHBOARD
8.5.COMPETITIVE HEATMAP
8.6.KEY DEVELOPMENTS
8.6.1.New product launches
8.6.2.Expansions
8.6.3.Other developments
CHAPTER 9:COMPANY PROFILES:
9.1.Thermo Fisher Scientific Inc.
9.1.1.Company overview
9.1.2.Company snapshot
9.1.3.Operating business segments
9.1.4.Product portfolio
9.1.5.Business performance
9.2.Advanced BioChemicals (ABC)
9.2.1.Company overview
9.2.2.Company snapshot
9.2.3.Product portfolio
9.3.Promega Corporation
9.3.1.Company overview
9.3.2.Company snapshot
9.3.3.Operating business segments
9.3.4.Product portfolio
9.4.Zeesan Biotech Co. Ltd.
9.4.1.Company overview
9.4.2.Company snapshot
9.4.3.Operating business segments
9.4.4.Product portfolio
9.5.New England BioLabs Inc.
9.5.1.Company overview
9.5.2.Company snapshot
9.5.3.Operating business segments
9.5.4.Product portfolio
9.6.Calbiotech
9.6.1.Company overview
9.6.2.Company snapshot
9.6.3.Operating business segments
9.6.4.Product portfolio
9.7.MagBio Genomics
9.7.1.Company overview
9.7.2.Company snapshot
9.7.3.Operating business segments
9.7.4.Product portfolio
9.8.Teja Scientific Glass Works
9.8.1.Company overview
9.8.2.Company snapshot
9.8.3.Product portfolio
9.9.Vazyme Biotech Co. Ltd.
9.9.1.Company overview
9.9.2.Company snapshot
9.9.3.Product portfolio
9.10.Alcon Scientific Industries
9.10.1.Company overview
9.10.2.Company snapshot
9.10.3.Operating business segments
9.10.4.Product portfolio
LIST OF TABLES
TABLE 01.GLOBAL MAGNETIC BEADS MARKET, BY MAGNETIC CORE, 2019-2027 ($MILLION)
TABLE 02.MAGNETIC BEADS MARKET FOR FERRIMAGNETIC, BY REGION, 2019–2027 ($MILLION)
TABLE 03.MAGNETIC BEADS MARKET FOR SUPERPARAMAGNETIC, BY REGION, 2019–2027 ($MILLION)
TABLE 04.GLOBAL PEST CONTROL MARKET, BY PEST TYPE, 2019-2027 ($MILLION)
TABLE 05.MAGNETIC BEADS FOR LESS THAN 5 UM, BY REGION, 2019–2027 ($MILLION)
TABLE 06.MAGNETIC BEADS FOR 5-20 UM, BY REGION, 2019–2027 ($MILLION)
TABLE 07.MAGNETIC BEADS FOR 20-40 UM, BY REGION, 2019–2027 ($MILLION)
TABLE 08.MAGNETIC BEADS FOR 40 UM & ABOVE, BY REGION, 2019–2027 ($MILLION)
TABLE 09.GLOBAL MAGNETIC BEADS MARKET, BY APPLICATION, 2019-2027 ($MILLION)
TABLE 10.MAGNETIC BEADS MARKET FOR NEXT GENERATION SEQUENCING (NGS), BY REGION, 2019–2027 ($MILLION)
TABLE 11.MAGNETIC BEADS MARKET FOR BIOMOLUCULES SEPARATION & PURIFICATION, BY REGION, 2019–2027 ($MILLION)
TABLE 12.MAGNETIC BEADS MARKET FOR MOLECULAR & IMMUNODIAGNOSTICS, BY REGION, 2019–2027 ($MILLION)
TABLE 13.MAGNETIC BEADS MARKET FOR OTHER, BY REGION, 2019–2027 ($MILLION)
TABLE 14.MAGNETIC BEADS MARKET, BY REGION, 2019–2027 ($MILLION)
TABLE 15.NORTH AMERICA PEST CONTROL MARKET, BY MAGNETIC CORE, 2019–2027 ($MILLION)
TABLE 16.NORTH AMERICA MAGNETIC BEADS MARKET, BY SIZE, 2019–2027 ($MILLION)
TABLE 17.NORTH AMERICA MAGNETIC BEADS MARKET, BY APPLICATION, 2019–2027 ($MILLION)
TABLE 18.NORTH AMERICA MAGNETIC BEADS MARKET, BY COUNTRY, 2019–2027 ($MILLION)
TABLE 19.U.S. MAGNETIC BEADS MARKET, BY MAGNETIC CORE, 2019–2027 ($MILLION)
TABLE 20.U.S. MAGNETIC BEADS MARKET, BY SIZE, 2019–2027 ($MILLION)
TABLE 21.U.S. MAGNETIC BEADS MARKET, BY APPLICATION, 2019–2027 ($MILLION)
TABLE 22.CANADA MAGNETIC BEADS MARKET, BY MAGNETIC CORE, 2019–2027 ($MILLION)
TABLE 23.CANADA MAGNETIC BEADS MARKET, BY SIZE, 2019–2027 ($MILLION)
TABLE 24.CANADA MAGNETIC BEADS MARKET, BY APPLICATION, 2019–2027 ($MILLION)
TABLE 25.MEXICO MAGNETIC BEADS MARKET, BY MAGNETIC CORE, 2019–2027 ($MILLION)
TABLE 26.MEXICO MAGNETIC BEADS MARKET, BY SIZE, 2019–2027 ($MILLION)
TABLE 27.MEXICO MAGNETIC BEADS MARKET, BY APPLICATION, 2019–2027 ($MILLION)
TABLE 28.EUROPE PEST CONTROL MARKET, BY MAGNETIC CORE, 2019–2027 ($MILLION)
TABLE 29.EUROPE MAGNETIC BEADS MARKET, BY SIZE, 2019–2027 ($MILLION)
TABLE 30.EUROPE MAGNETIC BEADS MARKET, BY APPLICATION, 2019–2027 ($MILLION)
TABLE 31.EUROPE MAGNETIC BEADS MARKET, BY COUNTRY, 2019–2027 ($MILLION)
TABLE 32.GERMANY MAGNETIC BEADS MARKET, BY MAGNETIC CORE, 2019–2027 ($MILLION)
TABLE 33.GERMANY MAGNETIC BEADS MARKET, BY SIZE, 2019–2027 ($MILLION)
TABLE 34.GERMANY MAGNETIC BEADS MARKET, BY APPLICATION, 2019–2027 ($MILLION)
TABLE 35.FRANCE MAGNETIC BEADS MARKET, BY MAGNETIC CORE, 2019–2027 ($MILLION)
TABLE 36.FRANCE MAGNETIC BEADS MARKET, BY SIZE, 2019–2027 ($MILLION)
TABLE 37.FRANCE MAGNETIC BEADS MARKET, BY APPLICATION, 2019–2027 ($MILLION)
TABLE 39.ITALY MAGNETIC BEADS MARKET, BY MAGNETIC CORE, 2019–2027 ($MILLION)
TABLE 40.ITALY MAGNETIC BEADS MARKET, BY SIZE, 2019–2027 ($MILLION)
TABLE 41.ITALY MAGNETIC BEADS MARKET, BY APPLICATION, 2019–2027 ($MILLION)
TABLE 42.SPAIN MAGNETIC BEADS MARKET, BY MAGNETIC CORE, 2019–2027 ($MILLION)
TABLE 43.SPAIN MAGNETIC BEADS MARKET, BY SIZE, 2019–2027 ($MILLION)
TABLE 44.SPAIN MAGNETIC BEADS MARKET, BY APPLICATION, 2019–2027 ($MILLION)
TABLE 45.U.K. MAGNETIC BEADS MARKET, BY MAGNETIC CORE, 2019–2027 ($MILLION)
TABLE 46.U.K. MAGNETIC BEADS MARKET, BY SIZE, 2019–2027 ($MILLION)
TABLE 47.U.K. MAGNETIC BEADS MARKET, BY APPLICATION, 2019–2027 ($MILLION)
TABLE 48.REST OF EUROPE MAGNETIC BEADS MARKET, BY MAGNETIC CORE, 2019–2027 ($MILLION)
TABLE 49.REST OF EUROPE MAGNETIC BEADS MARKET, BY SIZE, 2019–2027 ($MILLION)
TABLE 50.REST OF EUROPE MAGNETIC BEADS MARKET, BY APPLICATION, 2019–2027 ($MILLION)
TABLE 51.ASIA-PACIFIC PEST CONTROL MARKET, BY MAGNETIC CORE, 2019–2027 ($MILLION)
TABLE 52.ASIA-PACIFIC MAGNETIC BEADS MARKET, BY SIZE, 2019–2027 ($MILLION)
TABLE 53.ASIA-PACIFIC MAGNETIC BEADS MARKET, BY APPLICATION, 2019–2027 ($MILLION)
TABLE 54.ASIA-PACIFIC MAGNETIC BEADS MARKET, BY COUNTRY, 2019–2027 ($MILLION)
TABLE 55.CHINA MAGNETIC BEADS MARKET, BY MAGNETIC CORE, 2019–2027 ($MILLION)
TABLE 56.CHINA MAGNETIC BEADS MARKET, BY SIZE, 2019–2027 ($MILLION)
TABLE 57.CHINA MAGNETIC BEADS MARKET, BY APPLICATION, 2019–2027 ($MILLION)
TABLE 58.JAPAN MAGNETIC BEADS MARKET, BY MAGNETIC CORE, 2019–2027 ($MILLION)
TABLE 59.JAPAN MAGNETIC BEADS MARKET, BY SIZE, 2019–2027 ($MILLION)
TABLE 60.JAPAN MAGNETIC BEADS MARKET, BY APPLICATION, 2019–2027 ($MILLION)
TABLE 61.INDIA MAGNETIC BEADS MARKET, BY MAGNETIC CORE, 2019–2027 ($MILLION)
TABLE 62.INDIA MAGNETIC BEADS MARKET, BY SIZE, 2019–2027 ($MILLION)
TABLE 63.INDIA MAGNETIC BEADS MARKET, BY APPLICATION, 2019–2027 ($MILLION)
TABLE 64.SOUTH KOREA MAGNETIC BEADS MARKET, BY MAGNETIC CORE, 2019–2027 ($MILLION)
TABLE 65.SOUTH KOREA MAGNETIC BEADS MARKET, BY SIZE, 2019–2027 ($MILLION)
TABLE 66.SOUTH KOREA MAGNETIC BEADS MARKET, BY APPLICATION, 2019–2027 ($MILLION)
TABLE 67.AUSTRALIA MAGNETIC BEADS MARKET, BY MAGNETIC CORE, 2019–2027 ($MILLION)
TABLE 68.AUSTRALIA MAGNETIC BEADS MARKET, BY SIZE, 2019–2027 ($MILLION)
TABLE 69.AUSTRALIA MAGNETIC BEADS MARKET, BY APPLICATION, 2019–2027 ($MILLION)
TABLE 70.REST OF ASIA-PACIFIC MAGNETIC BEADS MARKET, BY MAGNETIC CORE, 2019–2027 ($MILLION)
TABLE 71.REST OF ASIA-PACIFIC MAGNETIC BEADS MARKET, BY SIZE, 2019–2027 ($MILLION)
TABLE 72.REST OF ASIA-PACIFIC MAGNETIC BEADS MARKET, BY APPLICATION, 2019–2027 ($MILLION)
TABLE 73.LAMEA PEST CONTROL MARKET, BY MAGNETIC CORE, 2019–2027 ($MILLION)
TABLE 74.LAMEA MAGNETIC BEADS MARKET, BY SIZE, 2019–2027 ($MILLION)
TABLE 75.LAMEA MAGNETIC BEADS MARKET, BY APPLICATION, 2019–2027 ($MILLION)
TABLE 76.LAMEA MAGNETIC BEADS MARKET, BY COUNTRY, 2019–2027 ($MILLION)
TABLE 77.BRAZIL MAGNETIC BEADS MARKET, BY MAGNETIC CORE, 2019–2027 ($MILLION)
TABLE 78.BRAZIL MAGNETIC BEADS MARKET, BY SIZE, 2019–2027 ($MILLION)
TABLE 79.BRAZIL MAGNETIC BEADS MARKET, BY APPLICATION, 2019–2027 ($MILLION)
TABLE 80.SAUDI ARABIA MAGNETIC BEADS MARKET, BY MAGNETIC CORE, 2019–2027 ($MILLION)
TABLE 81.SAUDI ARABIA MAGNETIC BEADS MARKET, BY SIZE, 2019–2027 ($MILLION)
TABLE 82.SAUDI ARABIA MAGNETIC BEADS MARKET, BY APPLICATION, 2019–2027 ($MILLION)
TABLE 83.SAUDI ARABIA MAGNETIC BEADS MARKET, BY MAGNETIC CORE, 2019–2027 ($MILLION)
TABLE 84.SAUDI ARABIA MAGNETIC BEADS MARKET, BY SIZE, 2019–2027 ($MILLION)
TABLE 85.SAUDI ARABIA MAGNETIC BEADS MARKET, BY APPLICATION, 2019–2027 ($MILLION)
TABLE 86.SOUTH AFRICA MAGNETIC BEADS MARKET, BY MAGNETIC CORE, 2019–2027 ($MILLION)
TABLE 87.SOUTH AFRICA MAGNETIC BEADS MARKET, BY SIZE, 2019–2027 ($MILLION)
TABLE 88.SOUTH AFRICA MAGNETIC BEADS MARKET, BY APPLICATION, 2019–2027 ($MILLION)
TABLE 89.REST OF LAMEA MAGNETIC BEADS MARKET, BY MAGNETIC CORE, 2019–2027 ($MILLION)
TABLE 90.REST OF LAMEA MAGNETIC BEADS MARKET, BY SIZE, 2019–2027 ($MILLION)
TABLE 91.REST OF LAMEA MAGNETIC BEADS MARKET, BY APPLICATION, 2019–2027 ($MILLION)
TABLE 92.KEY NEW PRODUCT LAUNCHES (2018-2021)
TABLE 93.KEY EXPANSIONS (2017-2021)
TABLE 94.OTHER KEY DEVELOPMENTS (2017-2021)
TABLE 95.THERMO FISHER: COMPANY SNAPSHOT
TABLE 96.THERMO FISHER: OPERATING SEGMENTS
TABLE 97.THERMO FISHER: PRODUCT PORTFOLIO
TABLE 98.OVERALL FINANCIAL STATUS ($MILLION)
TABLE 99.ABC: COMPANY SNAPSHOT
TABLE 100.ABC: PRODUCT PORTFOLIO
TABLE 101.PROMEGA: COMPANY SNAPSHOT
TABLE 102.PROMEGA: OPERATING SEGMENTS
TABLE 103.PROMEGA: PRODUCT PORTFOLIO
TABLE 104.ZEESAN: COMPANY SNAPSHOT
TABLE 105.ZEESAN: OPERATING SEGMENTS
TABLE 106.ZEESAN: PRODUCT PORTFOLIO
TABLE 107.NEB: COMPANY SNAPSHOT
TABLE 108.NEB: OPERATING SEGMENTS
TABLE 109.NEB: PRODUCT PORTFOLIO
TABLE 110.CALBIOTECH: COMPANY SNAPSHOT
TABLE 111.CALBIOTECH: OPERATING SEGMENTS
TABLE 112.CALBIOTECH: PRODUCT PORTFOLIO
TABLE 113.MAGBIO: COMPANY SNAPSHOT
TABLE 114.MAGBIO: OPERATING SEGMENTS
TABLE 115.MAGBIO:PRODUCT PORTFOLIO
TABLE 116.TEJ SCIENTIFIC: COMPANY SNAPSHOT
TABLE 117.TEJ SCIENTIFIC: PRODUCT PORTFOLIO
TABLE 118.VAZYME: COMPANY SNAPSHOT
TABLE 119.VAZYME: PRODUCT PORTFOLIO
TABLE 120.ALCON: COMPANY SNAPSHOT
TABLE 121.ALCON: OPERATING SEGMENTS
TABLE 122.ALCON: PRODUCT PORTFOLIO
LIST OF FIGURES
FIGURE 01.GLOBAL MAGNETIC BEADS MARKET SNAPSHOT
FIGURE 02.GLOBAL MAGNETIC BEADS MARKET SEGMENTATION
FIGURE 03.TOP INVESTMENT POCKETS
FIGURE 04.HIGH BARGAINING POWER OF SUPPLIERS
FIGURE 05.MODERATE BARGAINING POWER OF BUYERS
FIGURE 06.MODERATE THREAT OF NEW ENTRANTS
FIGURE 07.MODERATE THREAT OF SUBSTITUTES
FIGURE 08.HIGH INTENSITY OF COMPETITIVE RIVALRY
FIGURE 09.GLOBAL MAGNETIC BEADS MARKET DYNAMICS
FIGURE 10.VALUE CHAIN ANALYSIS
FIGURE 11.PATENT ANALYSIS, BY COUNTRY, 2020
FIGURE 12.PATENT ANALYSIS, BY APPLICANT, 2012-2020
FIGURE 13.PATENT ANALYSIS, BY PUBLICATION DATE, 2012-2020
FIGURE 14.GLOBAL MAGNETIC BEADS MARKET, BY MAGNETIC CORE, 2019–2027 ($MILILION)
FIGURE 15.COMPARATIVE SHARE ANALYSIS OF MAGNETIC BEADS MARKET FOR FERRIMAGNETIC, BY COUNTRY, 2019 & 2029 (%)
FIGURE 16.COMPARATIVE SHARE ANALYSIS OF MAGNETIC BEADS MARKET FOR SUPERPARAMAGNETIC, BY COUNTRY, 2019 & 2027 (%)
FIGURE 17.GLOBAL MAGNETIC BEADS MARKET, BY SIZE, 2019–2027 ($ MILILION)
FIGURE 18.COMPARATIVE SHARE ANALYSIS OF MAGNETIC BEADS MARKET FOR LESS THAN 5 UM, BY COUNTRY, 2019 & 2027 (%)
FIGURE 19.COMPARATIVE SHARE ANALYSIS OF MAGNETIC BEADS MARKET FOR 5-20 UM, BY COUNTRY, 2019 & 2027 (%)
FIGURE 20.COMPARATIVE SHARE ANALYSIS OF MAGNETIC BEADS MARKET FOR 20-40 UM, BY COUNTRY, 2019 & 2027 (%)
FIGURE 21.COMPARATIVE SHARE ANALYSIS OF MAGNETIC BEADS MARKET FOR 40 UM & ABOVE, BY COUNTRY, 2019 & 2027 (%)
FIGURE 22.GLOBAL MAGNETIC BEADS MARKET, BY APPLICATION, 2019–2027 ($ MILILION)
FIGURE 23.COMPARATIVE SHARE ANALYSIS OF MAGNETIC BEADS MARKET FOR NEXT GENERATION SEQUENCING (NGS), BY COUNTRY, 2019 & 2027 (%)
FIGURE 24.COMPARATIVE SHARE ANALYSIS OF MAGNETIC BEADS MARKET FOR BIOMOLUCULES SEPARATION & PURIFICATION, BY COUNTRY, 2019 & 2027 (%)
FIGURE 25.COMPARATIVE SHARE ANALYSIS OF MAGNETIC BEADS MARKET FOR MOLECULAR & IMMUNODIAGNOSTICS, BY COUNTRY, 2019 & 2027 (%)
FIGURE 26.COMPARATIVE SHARE ANALYSIS OF MAGNETIC BEADS MARKET FOR OTHER, BY COUNTRY, 2019 & 2027 (%)
FIGURE 27.U.S. MAGNETIC BEADS MARKET REVENUE, 2019–2027($MILLION)
FIGURE 28.CANADA MAGNETIC BEADS MARKET REVENUE, 2019–2027($MILLION)
FIGURE 29.MEXICO MAGNETIC BEADS MARKET REVENUE, 2019–2027($MILLION)
FIGURE 30.GERMANY MAGNETIC BEADS MARKET REVENUE, 2019–2027($MILLION)
FIGURE 31.FRANCE MAGNETIC BEADS MARKET REVENUE, 2019–2027($MILLION)
FIGURE 32.ITALY MAGNETIC BEADS MARKET REVENUE, 2019–2027($MILLION)
FIGURE 33.SPAIN MAGNETIC BEADS MARKET REVENUE, 2019–2027($MILLION)
FIGURE 34.U.K. MAGNETIC BEADS MARKET REVENUE, 2019–2027($MILLION)
FIGURE 35.REST OF EUROPE MAGNETIC BEADS MARKET REVENUE, 2019–2027($MILLION)
FIGURE 36.CHINA MAGNETIC BEADS MARKET REVENUE, 2019–2027($MILLION)
FIGURE 37.JAPAN MAGNETIC BEADS MARKET REVENUE, 2019–2027($MILLION)
FIGURE 38.INDIA MAGNETIC BEADS MARKET REVENUE, 2019–2027($MILLION)
FIGURE 39.SOUTH KOREA MAGNETIC BEADS MARKET REVENUE, 2019–2027($MILLION)
FIGURE 40.AUSTRALIA MAGNETIC BEADS MARKET REVENUE, 2019–2027($MILLION)
FIGURE 41.REST OF ASIA-PACIFIC MAGNETIC BEADS MARKET REVENUE, 2019–2027($MILLION)
FIGURE 42.BRAZIL MAGNETIC BEADS MARKET REVENUE, 2019–2027($MILLION)
FIGURE 43.SAUDI ARABIA MAGNETIC BEADS MARKET REVENUE, 2019–2027($MILLION)
FIGURE 44.UAE MAGNETIC BEADS MARKET REVENUE, 2019–2027($MILLION)
FIGURE 45.SOUTH AFRICA MAGNETIC BEADS MARKET REVENUE, 2019–2027($MILLION)
FIGURE 46.REST OF LAMEA MAGNETIC BEADS MARKET REVENUE, 2019–2027($MILLION)
FIGURE 47.MARKET PLAYER POSITIONING, 2020
FIGURE 48.TOP WINNING STRATEGIES, BY YEAR, 2017–2021
FIGURE 49.TOP WINNING STRATEGIES, BY DEVELOPMENT, 2017–2021 (%)
FIGURE 50.TOP WINNING STRATEGIES, BY COMPANY, 2017–2021
FIGURE 51.PRODUCT MAPPING OF TOP 10 PLAYERS
FIGURE 52.COMPETITIVE DASHBOARD
FIGURE 53.COMPETITIVE HEATMAP OF KEY PLAYERS
FIGURE 54.THERMO FISHER: NET SALES, 2017–2019 ($MILLION)
FIGURE 55.THERMO FISHER: REVENUE SHARE BY SEGMENT, 2019 (%)
FIGURE 56.THERMO FISHER: REVENUE SHARE BY REGION, 2019 (%)
The global magnetic beads market is a gaining importance in regards to an extremely essential role played by magnetic beads in applications such as next-generation sequencing (NGS), biomolecules separation & purification, molecular & immunodiagnostics, and magnetic activated cell sorting. In addition, apart from mainstream applications of magnetic beads, other uses such as utilization of magnetic beads during COVID-19 testing method, T-cell activation, immunoprecipitation, and testing & research activities due to their capacity/yield, reproducibility, purity, and cost for small-scale isolation of specific proteins are predicted to offer lucrative growth opportunities for market expansion in the future.
In addition, streptavidin covalently attached magnetic beads offers isolation and helps efficient handling of biotinylated molecule. These types of magnetic beads are widely incorporated in applications such as mRNA isolation that can be completed within 15 minutes, nucleic acid capture assays, preparation of single strand templates, and pyro-sequencing. CardioGenics proprietary magnetic beads are advanced type of magnetic beads that are used to target cells and help to improve testing sensitivity. These magnetic beads are light colored beads and offer optimal collecting light signals in binding tests, which are predicted to augment the growth of the global market.
A. Rising utilization of magnetic beads in medical applications, bioassays, DNA & RNA extraction method, and life science application are the other major growth factors in the global market
A. The magnetic beads market size is projected to reach $2,618.7 million by 2027.
A. Thermo Fisher Scientific Inc., Advanced BioChemicals (ABC), Promega Corporation, Zeesan Biotech Co. Ltd., New England BioLabs Inc., Calbiotech, MagBio Genomics, Teja Scientific Glass Works, Vazyme Biotech Co. Ltd., and Alcon Scientific Industries.
A. Biomolucules separation & purification industry is projected to increase the demand of magnetic beads market
A. Ferrimagnetic segment is leading segment in magnetic beads market
A. Rising utilization of magnetic beads in medical applications is the major growth factor in the global market.
A. Next generation sequencing (NGS) application is expected to drive the demand of magnetic beads market
A. COVID-19 will impact positively on the global magnetic beads market. This is attributed due to • The COVID-19 pandemic has negatively affected the global economy and is subsequently shrinking the GDP, thereby changing consumer spending patterns globally. • Large-scale testing of coronavirus infection by using RT-qPCR and RT-LAMP requires the use of magnetic beads, and these magnetic beads that are made up of in-house reagents and are performed in 96-well plates supporting large-scale testing. • Current standard testing for SARS-CoV-2 detection is based on viral RNA extraction method. In addition, other test methods such as nucleocapsid (N), envelope protein (E), S glycoprotein (S), or RNA-dependent RNA polymerase (RdRp) are used for detection of large-scale samples. Thus, the need for commercial RNA extraction kits is increasing significantly, which, in turn, has augmented the demand for magnetic beads market during the pandemic. • Product development of magnetic beads for detection of COVID-19 infection has pushed the demand for global magnetic beads market during this global crisis. For instance, in October 2020, Now Norwegian University of Science and Technology developed a highly sensitive and efficient test method for COVID-19 infection detection that uses magnetic nanoparticles to extract viral RNA.
Start reading instantly.
This Report and over 67,404+ more Reports, Available with Avenue Library. T&C*.
Enterprise
License/PDF
Library
Membership
*Taxes/Fees, if applicable will be added during checkout. All prices in USD
To ensure high-level data integrity, accurate analysis, and impeccable forecasts
For complete satisfaction
On-demand customization of scope of the report to exactly meet your needs
Targeted market view to provide pertinent information and save time of readers
Get insights on topics that are crucial for your business. Stay abreast of your interest areas.
Get Industry Data AlertsTo ensure high-level data integrity, accurate analysis, and impeccable forecasts
For complete satisfaction
On-demand customization of scope of the report to exactly meet your needs
Targeted market view to provide pertinent information and save time of readers