Report Code: A00195 | Mar 2020 | Pages: 171 | ||
Tables: 70 | Charts: 44 |
|
Pandemic disrupted the entire world and affected many industries.
Get detailed COVID-19 impact analysis on the Malaria Diagnostics Market
Request Now !The global malaria diagnostics market accounted for $728,870 thousand in 2018 and is expected to reach $1,085,106 thousand by 2026, registering a CAGR of 5.1% from 2019 to 2026.
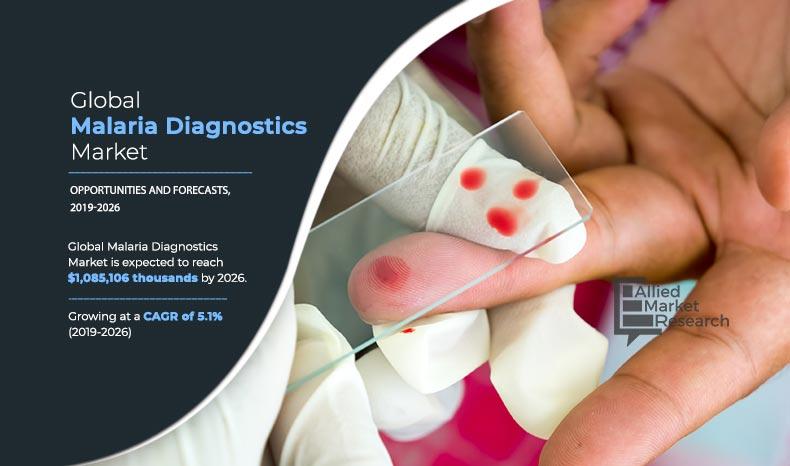
Malaria is an infection caused by parasites, which is highly fatal if left untreated. This infectious diseases spreads through the bite of infected female Anopheles mosquito. The bite leads to transfer of plasmodium parasites into the human body. In addition, there are different types of plasmodium parasites such as Plasmodium vivax, Plasmodium falciparum, Plasmodium malariae, Plasmodium ovale, and Plasmodium knowlesi. Furthermore, these parasites lodge into liver cells where they multiply and grow. These parasites then move to red blood cells to reach a stage called merozoites where they grow inside the red cells and kill them. The loss of red blood cells causes symptoms such as fever, tiredness, vomiting and headaches. In addition, the procedures and examinations that are conducted to identify malarial infection are called as malaria diagnostics. There are different types of malaria diagnostic available in the market for such as rapid diagnostic tests, microscopy, and molecular diagnostic tests.
The major factor that contributes to the growth of the malaria diagnostics market include rise in prevalence of malaria in developing countries. Furthermore, surge in awareness initiatives by governments and increase in research for new malaria diagnostics are the factors that boost the growth of the market. However, lack of awareness about healthcare in developing countries is a major factor that restricts the malaria diagnostics market growth. Conversely, growth opportunities exhibited by emerging economies is expected to offer lucrative opportunities during the forecast period.
Malaria Diagnostics Market Segmentation
The malaria diagnostics market is studied on the basis of product type, end user, and region to provide a detailed assessment of the market. On the basis of product type, it is segmented into rapid diagnostic tests, microscopy, and molecular diagnostic tests. By end user, it is bifurcated into hospital, clinics, and diagnostic centers. Region wise, it is analyzed across North America (the U.S., and Canada, and Mexico), Europe (Germany, the UK, and rest of Europe), Asia-Pacific (China, India, and rest of Asia-Pacific), and LAMEA (Africa and rest of LAMEA).
Segment Review
According to product type, rapid diagnostic tests acquired the major share of the malaria diagnostics market in 2018, owing to benefits associated with the use of RDTs in the diagnosis of malaria. For instance, RDTs are inexpensive, simple to operate and read, highly sensitive & specific, stable at high temperatures, and provide results in shorter period of time. Therefore, contribute to the growth of malaria diagnostic tests market. Furthermore, the molecular diagnostic tests segment is expected to grow at the fastest pace during the forecast period, owing to high specificity associated with the use of the test, which can lead to better treatment outcomes. In addition, rise in awareness among people regarding early diagnosis of malaria for better treatment supplements the growing demand for malaria diagnostic tests.
By end user, the clinics segment acquired the major share of the malaria diagnostics market, owing to surge in number of clinics worldwide. In addition, diagnostic centers are expected to exhibit the fastest growth rate during the forecast period due to surge in awareness related to early diagnosis of malaria infection for better treatment.
By region, LAMEA accounted for the major malaria diagnostics market share in 2018, and is expected to continue this trend, owing to rapid surge in prevalence of malaria in the region. Moreover, widespread of the malaria vector, Anopheles gambiae, which is difficult to control, in the region is another major factor that leads to surge in cases of malaria. Furthermore, majority of malarial infections in the region are caused by the most lethal type of malarial parasite called as Plasmodium falciparum. Therefore, there is a need for early diagnosis of malaria infection in this region, which boosts the growth of the market. In addition, malaria infection is endemic to some parts of Africa, which leads to the growth of the market in the region. On the other side, Asia-Pacific is estimated to register the fastest growth during the forecast period, attributed to the increase in awareness regarding the use of malaria diagnostics for early diagnosis of the infection for better treatment. The constantly evolving life science industry drives the growth of the market in developing economies such as India, China, and Malaysia, as the constant development leads to surge in awareness related to the use of malaria diagnostics. .
Malaria Diagnostics Market Report Highlights
Aspects | Details |
---|---|
By Product Type |
|
By END USER |
|
By Region |
|
Key Market Players | SIEMENS, Bio-Rad Laboratories, Inc., Meridian Bioscience Inc., NOVARTIS AG, Atlas Medical, Access Bio. Inc., Olympus Corporation, Premier Medical Corporation Pvt Ltd., Abbott Laboratories, BIOMÉRIEUX SA |
CHAPTER 1: INTRODUCTION
1.1. Report description
1.2. Key market segments
1.2.1. List of key players profiled in the report
1.3. Research methodology
1.3.1. Primary research
1.3.2. Secondary research
1.3.3. Analyst tools and models
CHAPTER 2: EXECUTIVE SUMMARY
2.1. Key findings of the study
2.2. CXO perspective
CHAPTER 3: MARKET OVERVIEW
3.1. Market definition and scope
3.2. Top player positioning
3.2.1. Top investment pockets
3.3. Key forces shaping malaria diagnostics industry/market
3.4. Market dynamics
3.4.1. Drivers
3.4.1.1. Increase in prevalence of malaria
3.4.1.2. Surge in healthcare expenditure worldwide
3.4.1.3. Rise in adoption of malaria diagnostics across the globe
3.4.2. Restraint
3.4.2.1. Poor demand in under developed countries
3.4.3. Opportunity
3.4.3.1. High growth potential in developing economies
3.4.4. Impact Analyses
CHAPTER 4: MALARIA DIAGNOSTICS MARKET, BY PRODUCT TYPE
4.1. Overview
4.1.1. Market size and forecast
4.2. Rapid Diagnostic Tests
4.2.1. Key market trends, growth factors, and opportunities
4.2.2. Market size and forecast, by region
4.2.3. Market analysis by country
4.3. Microscopy
4.3.1. Key market trends, growth factors, and opportunities
4.3.2. Market size and forecast, by region
4.3.3. Market analysis by country
4.4. Molecular Diagnostic Tests
4.4.1. Key market trends, growth factors, and opportunities
4.4.2. Market size and forecast, by region
4.4.3. Market analysis by country
CHAPTER 5: MALARIA DIAGNOSTICS MARKET, BY END USER
5.1. Overview
5.1.1. Market size and forecast
5.2. Hospitals
5.2.1. Market size and forecast, by region
5.2.2. Market analysis by country
5.3. Clinics
5.3.1. Market size and forecast, by region
5.3.2. Market analysis by country
5.4. Diagnostic Centers
5.4.1. Market size and forecast, by region
5.4.2. Market analysis by country
CHAPTER 6: MALARIA DIAGNOSTICS MARKET, BY REGION
6.1. Overview
6.1.1. Market size and forecast
6.2. North America
6.2.1. Key market trends and opportunities
6.2.2. Market analysis, by country
6.2.2.1. U.S.
6.2.2.1.1. U.S. market size and forecast, by product type
6.2.2.1.2. U.S. market size and forecast, by end user
6.2.2.2. Canada
6.2.2.2.1. Canada market size and forecast, by product type
6.2.2.2.2. Canada market size and forecast, by end user
6.2.3. North America market size and forecast, by product type
6.2.4. North America market size and forecast, by end user
6.3. Europe
6.3.1. Key market trends and opportunities
6.3.2. Market analysis, by country
6.3.2.1. Germany
6.3.2.1.1. Germany market size and forecast, by product type
6.3.2.1.2. Germany market size and forecast, by end user
6.3.2.2. UK
6.3.2.2.1. UK market size and forecast, by product type
6.3.2.2.2. UK market size and forecast, by end user
6.3.2.3. Rest of Europe
6.3.2.3.1. Rest of Europe market size and forecast, by product type
6.3.2.3.2. Rest of Europe market size and forecast, by end user
6.3.3. Europe market size and forecast, by product type
6.3.4. Europe market size and forecast, by end user
6.4. Asia-Pacific
6.4.1. Key market trends and opportunities
6.4.2. Market analysis, by country
6.4.2.1. India
6.4.2.1.1. India market size and forecast, by product type
6.4.2.1.2. India market size and forecast, by end user
6.4.2.2. China
6.4.2.2.1. China market size and forecast, by product type
6.4.2.2.2. China market size and forecast, by end user
6.4.2.3. Rest of Asia-Pacific
6.4.2.3.1. Rest of Asia-Pacific market size and forecast, by product type
6.4.2.3.2. Rest of Asia-Pacific market size and forecast, by end user
6.4.3. Asia-Pacific market size and forecast, by product type
6.4.4. Asia-Pacific market size and forecast, by end user
6.5. LAMEA
6.5.1. Key market trends and opportunities
6.5.2. Market analysis, by country
6.5.2.1. Arica
6.5.2.1.1. Arica market size and forecast, by product type
6.5.2.1.2. Arica market size and forecast, by end user
6.5.2.2. Rest of LAMEA
6.5.2.2.1. Rest of LAMEA market size and forecast, by product type
6.5.2.2.2. Rest of LAMEA market size and forecast, by end user
6.5.3. LAMEA market size and forecast, by product type
6.5.4. LAMEA market size and forecast, by end user
CHAPTER 7: COMPANY PROFILES
7.1. Abbott Laboratories
7.1.1. Company overview
7.1.2. Company snapshot
7.1.3. Operating business segments
7.1.4. Product portfolio
7.1.5. Business performance
7.2. Access Bio. Inc.
7.2.1. Company overview
7.2.2. Company snapshot
7.2.3. Operating business segments
7.2.4. Product portfolio
7.2.1. Key strategic moves and developments
7.3. Atlas Medical
7.3.1. Company overview
7.3.2. Company snapshot
7.3.3. Operating business segments
7.3.4. Product portfolio
7.3.5. Business performance
7.4. BIOMÉRIEUX SA
7.4.1. Company overview
7.4.2. Company snapshot
7.4.3. Operating business segments
7.4.4. Product portfolio
7.4.5. Business performance
7.5. Bio-Rad Laboratories, Inc.
7.5.1. Company overview
7.5.2. Company snapshot
7.5.3. Operating business segments
7.5.4. Product portfolio
7.5.5. Business performance
7.6. Meridian Bioscience Inc.
7.6.1. Company overview
7.6.2. Company snapshot
7.6.3. Operating business segments
7.6.4. Product portfolio
7.6.5. Business performance
7.6.6. Key strategic moves and developments
7.7. NOVARTIS AG
7.7.1. Company overview
7.7.2. Company snapshot
7.7.3. Operating business segments
7.7.4. Product portfolio
7.7.5. Business performance
7.8. Olympus Corporation
7.8.1. Company overview
7.8.2. Company snapshot
7.8.3. Operating business segments
7.8.4. Product portfolio
7.8.5. Business performance
7.9. Premier Medical Corporation Pvt Ltd.
7.9.1. Company overview
7.9.2. Company snapshot
7.9.3. Operating business segments
7.9.4. Product portfolio
7.10. SIEMENS
7.10.1. Company overview
7.10.2. Company snapshot
7.10.3. Operating business segments
7.10.4. Product portfolio
7.10.5. Business performance
7.10.6. Key strategic moves and developments
LIST OF TABLES
TABLE 01. GLOBAL MALARIA DIAGNOSTICS MARKET, BY PRODUCT TYPE, 2018-2026 ($THOUSAND)
TABLE 02. RAPID DIAGNOSTIC TESTS MALARIA DIAGNOSTICS MARKET, BY REGION, 2018–2026 ($THOUSAND)
TABLE 03. MICROSCOPY MALARIA DIAGNOSTICS MARKET, BY REGION, 2018–2026 ($THOUSAND)
TABLE 04. MOLECULAR DIAGNOSTIC TESTS MALARIA DIAGNOSTICS MARKET, BY REGION, 2018–2026 ($THOUSAND)
TABLE 05. GLOBAL MALARIA DIAGNOSTICS MARKET, BY END USER, 2018-2026 ($THOUSAND)
TABLE 06. MALARIA DIAGNOSTICS MARKET FOR HOSPITALS, BY REGION, 2018–2026 ($THOUSAND)
TABLE 07. MALARIA DIAGNOSTICS MARKET FOR CLINICS, BY REGION, 2018–2026 ($THOUSAND)
TABLE 08. MALARIA DIAGNOSTICS MARKET FOR DIAGNOSTIC CENTERS, BY REGION, 2018–2026 ($THOUSAND)
TABLE 09. MALARIA DIAGNOSTICS MARKET, BY REGION, 2018-2026 ($THOUSAND)
TABLE 10. NORTH AMERICA MALARIA DIAGNOSTICS MARKET REVENUE, BY COUNTRY, 2019–2026 ($THOUSAND)
TABLE 11. U.S. MALARIA DIAGNOSTICS MARKET REVENUE, BY PRODUCT TYPE, 2019–2026 ($THOUSAND)
TABLE 12. U.S. MALARIA DIAGNOSTICS MARKET REVENUE, BY END USER, 2019–2026 ($THOUSAND)
TABLE 13. CANADA MALARIA DIAGNOSTICS MARKET REVENUE, BY PRODUCT TYPE, 2019–2026 ($THOUSAND)
TABLE 14. CANADA MALARIA DIAGNOSTICS MARKET REVENUE, BY END USER, 2019–2026 ($THOUSAND)
TABLE 15. NORTH AMERICA MALARIA DIAGNOSTICS MARKET REVENUE, BY PRODUCT TYPE, 2019–2026($THOUSAND)
TABLE 16. NORTH AMERICA MALARIA DIAGNOSTICS MARKET REVENUE, BY END USER, 2019–2026($THOUSAND)
TABLE 17. EUROPE MALARIA DIAGNOSTICS MARKET REVENUE, BY COUNTRY, 2019–2026 ($THOUSAND)
TABLE 18. GERMANY MALARIA DIAGNOSTICS MARKET REVENUE, BY PRODUCT TYPE, 2019–2026 ($THOUSAND)
TABLE 19. GERMANY MALARIA DIAGNOSTICS MARKET REVENUE, BY END USER, 2019–2026 ($THOUSAND)
TABLE 20. UK MALARIA DIAGNOSTICS MARKET REVENUE, BY PRODUCT TYPE, 2019–2026 ($THOUSAND)
TABLE 21. UK MALARIA DIAGNOSTICS MARKET REVENUE, BY END USER, 2019–2026 ($THOUSAND)
TABLE 22. REST OF EUROPE MALARIA DIAGNOSTICS MARKET REVENUE, BY PRODUCT TYPE, 2019–2026 ($THOUSAND)
TABLE 23. REST OF EUROPE MALARIA DIAGNOSTICS MARKET REVENUE, BY END USER, 2019–2026 ($THOUSAND)
TABLE 24. EUROPE MALARIA DIAGNOSTICS MARKET REVENUE, BY PRODUCT TYPE, 2019–2026($THOUSAND)
TABLE 25. EUROPE MALARIA DIAGNOSTICS MARKET REVENUE, BY END USER, 2019–2026($THOUSAND)
TABLE 26. ASIA-PACIFIC MALARIA DIAGNOSTICS MARKET REVENUE, BY COUNTRY, 2019–2026 ($THOUSAND)
TABLE 27. INDIA MALARIA DIAGNOSTICS MARKET REVENUE, BY PRODUCT TYPE, 2019–2026 ($THOUSAND)
TABLE 28. INDIA MALARIA DIAGNOSTICS MARKET REVENUE, BY END USER, 2019–2026 ($THOUSAND)
TABLE 29. CHINA MALARIA DIAGNOSTICS MARKET REVENUE, BY PRODUCT TYPE, 2019–2026 ($THOUSAND)
TABLE 30. CHINA MALARIA DIAGNOSTICS MARKET REVENUE, BY END USER, 2019–2026 ($THOUSAND)
TABLE 31. REST OF ASIA-PACIFIC MALARIA DIAGNOSTICS MARKET REVENUE, BY PRODUCT TYPE, 2019–2026 ($THOUSAND)
TABLE 32. REST OF ASIA-PACIFIC MALARIA DIAGNOSTICS MARKET REVENUE, BY END USER, 2019–2026 ($THOUSAND)
TABLE 33. ASIA-PACIFIC MALARIA DIAGNOSTICS MARKET REVENUE, BY PRODUCT TYPE, 2019–2026($THOUSAND)
TABLE 34. ASIA-PACIFIC MALARIA DIAGNOSTICS MARKET REVENUE, BY END USER, 2019–2026($THOUSAND)
TABLE 35. LAMEA MALARIA DIAGNOSTICS MARKET REVENUE, BY COUNTRY, 2019–2026 ($THOUSAND)
TABLE 36. ARICA MALARIA DIAGNOSTICS MARKET REVENUE, BY PRODUCT TYPE, 2019–2026 ($THOUSAND)
TABLE 37. ARICA MALARIA DIAGNOSTICS MARKET REVENUE, BY END USER, 2019–2026 ($THOUSAND)
TABLE 38. REST OF LAMEA MALARIA DIAGNOSTICS MARKET REVENUE, BY PRODUCT TYPE, 2019–2026 ($THOUSAND)
TABLE 39. REST OF LAMEA MALARIA DIAGNOSTICS MARKET REVENUE, BY END USER, 2019–2026 ($THOUSAND)
TABLE 40. LAMEA MALARIA DIAGNOSTICS MARKET REVENUE, BY PRODUCT TYPE, 2019–2026($THOUSAND)
TABLE 41. LAMEA MALARIA DIAGNOSTICS MARKET REVENUE, BY END USER, 2019–2026($THOUSAND)
TABLE 42. ABBOTT: COMPANY SNAPSHOT
TABLE 43. ABBOTT: OPERATING SEGMENTS
TABLE 44. ABBOTT: PRODUCT PORTFOLIO
TABLE 45. ACCESSBIO: COMPANY SNAPSHOT
TABLE 46. ACCESSBIO: OPERATING SEGMENTS
TABLE 47. ACCESSBIO: PRODUCT PORTFOLIO
TABLE 48. ATLAS MEDICAL: COMPANY SNAPSHOT
TABLE 49. ATLAS MEDICAL: PRODUCT PORTFOLIO
TABLE 50. BIOMÉRIEUX.: COMPANY SNAPSHOT
TABLE 51. BIOMÉRIEUX.: OPERATING SEGMENTS
TABLE 52. BIOMÉRIEUX: PRODUCT PORTFOLIO
TABLE 53. BIO-RAD: COMPANY SNAPSHOT
TABLE 54. BIO-RAD: OPERATING SEGMENTS
TABLE 55. BIO-RAD: PRODUCT PORTFOLIO:
TABLE 56. MERIDIAN: COMPANY SNAPSHOT
TABLE 57. MERIDIAN: OPERATING SEGMENTS
TABLE 58. MERIDIAN: PRODUCT PORTFOLIO
TABLE 59. NOVARTIS: COMPANY SNAPSHOT
TABLE 60. NOVARTIS: OPERATING SEGMENTS
TABLE 61. NOVARTIS: PRODUCT PORTFOLIO
TABLE 62. OLYMPUS: COMPANY SNAPSHOT
TABLE 63. OLYMPUS: OPERATING SEGMENTS
TABLE 64. OLYMPUS: PRODUCT PORTFOLIO
TABLE 65. PREMIER MEDICAL CORPORATION: COMPANY SNAPSHOT
TABLE 66. PREMIER MEDICAL CORPORATION: OPERATING SEGMENTS
TABLE 67. PREMIER MEDICAL CORPORATION: PRODUCT PORTFOLIO
TABLE 68. SIEMENS: COMPANY SNAPSHOT
TABLE 69. SIEMENS: OPERATING SEGMENTS
TABLE 70. SIEMENS: PRODUCT PORTFOLIO
LIST OF FIGURES
FIGURE 01. GLOBAL MALARIA DIAGNOSTICS MARKET SEGMENTATION
FIGURE 02. TOP PLAYER POSITIONING, 2018
FIGURE 03. TOP INVESTMENT POCKETS
FIGURE 04. MODERATE BARGAINING POWER OF SUPPLIER
FIGURE 05. LOW BARGAINING POWER OF BUYERS
FIGURE 06. LOW THREAT OF SUBSTITUTES
FIGURE 07. HIGH INTENSITY OF RIVALRY
FIGURE 08. LOW THREAT OF NEW ENTRANT
FIGURE 09. IMPACT ANALYSES, MALARIA DIAGNOSTICS MARKET
FIGURE 10. COMPARATIVE SHARE ANALYSIS OF RAPID DIAGNOSTIC TESTS MALARIA DIAGNOSTICS MARKET, BY COUNTRY, 2018 & 2026 (%)
FIGURE 11. COMPARATIVE SHARE ANALYSIS OF MICROSCOPY MALARIA DIAGNOSTICS MARKET, BY COUNTRY, 2018 & 2026 (%)
FIGURE 12. COMPARATIVE SHARE ANALYSIS OF MOLECULAR DIAGNOSTIC TESTS MALARIA DIAGNOSTICS MARKET, BY COUNTRY, 2018 & 2026 (%)
FIGURE 13. COMPARATIVE SHARE ANALYSIS OF MALARIA DIAGNOSTICS MARKET FOR HSOPITALS, BY COUNTRY, 2018 & 2026 (%)
FIGURE 14. COMPARATIVE SHARE ANALYSIS OF MALARIA DIAGNOSTICS MARKET FOR CLINICS, BY COUNTRY, 2018 & 2026 (%)
FIGURE 15. COMPARATIVE SHARE ANALYSIS OF MALARIA DIAGNOSTICS MARKET FOR DIAGNOSTIC CENTERS, BY COUNTRY, 2018 & 2026 (%)
FIGURE 16. U.S. MALARIA DIAGNOSTICS MARKET, 2018-2026 ($THOUSAND)
FIGURE 17. CANADA MALARIA DIAGNOSTICS MARKET, 2018-2026 ($THOUSAND)
FIGURE 18. GERMANY MALARIA DIAGNOSTICS MARKET, 2018-2026 ($THOUSAND)
FIGURE 19. UK MALARIA DIAGNOSTICS MARKET, 2018-2026 ($THOUSAND)
FIGURE 20. REST OF EUROPE MALARIA DIAGNOSTICS MARKET, 2018-2026 ($THOUSAND)
FIGURE 21. INDIA MALARIA DIAGNOSTICS MARKET, 2018-2026 ($THOUSAND)
FIGURE 22. CHINA MALARIA DIAGNOSTICS MARKET, 2018-2026 ($THOUSAND)
FIGURE 23. REST OF ASIA-PACIFIC MALARIA DIAGNOSTICS MARKET, 2018-2026 ($THOUSAND)
FIGURE 24. ARICA MALARIA DIAGNOSTICS MARKET, 2018-2026 ($THOUSAND)
FIGURE 25. REST OF LAMEA MALARIA DIAGNOSTICS MARKET, 2018-2026 ($THOUSAND)
FIGURE 26. ABBOTT: NET SALES, 2016–2018 ($THOUSAND)
FIGURE 27. ABBOTT: REVENUE SHARE BY SEGMENT, 2018(%)
FIGURE 28. ABBOTT: REVENUE SHARE BY REGION, 2018(%)
FIGURE 29. BIOMÉRIEUX: NET SALES, 2018–2019 ($THOUSAND)
FIGURE 30. BIO-RAD: NET SALES, 2016–2018 ($THOUSAND)
FIGURE 31. BIO-RAD: REVENUE SHARE BY SEGMENTS, 2018(%)
FIGURE 32. BIO-RAD: REVENUE SHARE BY REGION, 2018 (%)
FIGURE 33. MERIDIAN: NET SALES, 2016–2018 ($THOUSAND)
FIGURE 34. MERIDIAN: REVENUE SHARE BY SEGMENT, 2018 (%)
FIGURE 35. MERIDIAN: REVENUE SHARE BY REGION, 2018(%)
FIGURE 36. NOVARTIS: NET SALES, 2016–2018 ($THOUSAND)
FIGURE 37. NOVARTIS: REVENUE SHARE BY SEGMENT, 2018 (%)
FIGURE 38. NOVARTIS: REVENUE SHARE BY REGION, 2018 (%)
FIGURE 39. OLYMPUS CORPORATION: NET SALES, 2016–2018 ($THOUSAND)
FIGURE 40. OLYMPUS: REVENUE SHARE BY SEGMENTS, 2018(%)
FIGURE 41. OLYMPUS: REVENUE SHARE BY REGION, 2018 (%)
FIGURE 42. NET SALES, 2016–2018 ($THOUSAND)
FIGURE 43. SIEMENS: REVENUE SHARE BY SEGMENT, 2018 (%)
FIGURE 44. SIEMENS: REVENUE SHARE BY REGION, 2018 (%)
Malaria diagnostics are defined as tests and procedures which are used in the identification and of malarial infection. These diagnostics are used extensively as the infection is highly prevalent and fatal. Furthermore, malaria is caused by the bite of female Anopheles mosquito, which leads to transfer of malarial parasites that destroy the blood cells of the host. This leads to critical symptoms such as impaired consciousness, multiple convulsions, abnormal bleeding, and signs of anemia, fever, and chills and others. Therefore, there are different types of malaria diagnostics which are used to identify the infection such as rapid diagnostic tests, microscopy, and molecular diagnostic tests.
The utilization of malaria diagnostics has witnessed a significant growth, owing to surge in prevalence of malaria across the globe. Furthermore, other factors that contribute to the growth of the market include the surge in healthcare expenditure, rise in research related to new malaria diagnostics, and rise in initiatives by governments towards eradication of malaria.
A. The total market value of malaria diagnostics market is $728,870.4 thousand in 2018.
A. The forcast period for malaria diagnostics market is 2019 to 2026
A. The market value of malaria diagnostics market in 2019 is $766,042.8 thousand
A. The base year is 2018 in malaria diagnostics market
A. Top companies such as, Premier Medical Corporation Pvt Ltd., Access Bio. Inc., Abbott Laboratories, Biomérieux SA, and Bio-Rad Laboratories, Inc held a high market position in 2018. These key players held a high market postion owing to the strong geographical foothold in different regions.
A. Rapid diagnostic tests (RDTs) segment is the most influencing segment oeing to benefits associated with the use of RDTs in diagnosis of malaria also boosts the market growth. For instance, RDTs are inexpensive, simple to operate and read, highly sensitive & specific, stable at high temperatures, and provide results in shorter period of time
A. The major factor that fuels the growth of the malaria diagnostics market include the surge in prevalence of malaria across the globe. This leads to surge in the demand for malaria diagnostics which boots the growth of the market.
A. Asia-Pacific has the highest growth rate in the market which is growing due to the contribution of the following emerging countries such as India with a CAGR of 6.1%. This is due to highly populated countries in the region such as China and India which have the potential to offer a huge patient base of malaria.
A. Malaria diagnostics are defined as tests and procedures which are employed in the confirmation of presence of malaria parasite in the blood. Furthermore, there are different types of malaria diagnostics which are offered in the market such as rapid diagnostic tests, molecular diagnostic tests and others.
A. Malaria diagnostics are employed for checking the presence of malaria causing parasite in the blood. Furthemore, these diagnostics also provide analysis about the stage of diseases which is important in treatment of the condition
Start reading instantly.
This Report and over 66,782+ more Reports, Available with Avenue Library. T&C*.
Enterprise
License/PDF
Library
Membership
*Taxes/Fees, if applicable will be added during checkout. All prices in USD
To ensure high-level data integrity, accurate analysis, and impeccable forecasts
For complete satisfaction
On-demand customization of scope of the report to exactly meet your needs
Targeted market view to provide pertinent information and save time of readers
Get insights on topics that are crucial for your business. Stay abreast of your interest areas.
Get Industry Data AlertsTo ensure high-level data integrity, accurate analysis, and impeccable forecasts
For complete satisfaction
On-demand customization of scope of the report to exactly meet your needs
Targeted market view to provide pertinent information and save time of readers