
Managed Security Services Market Overview
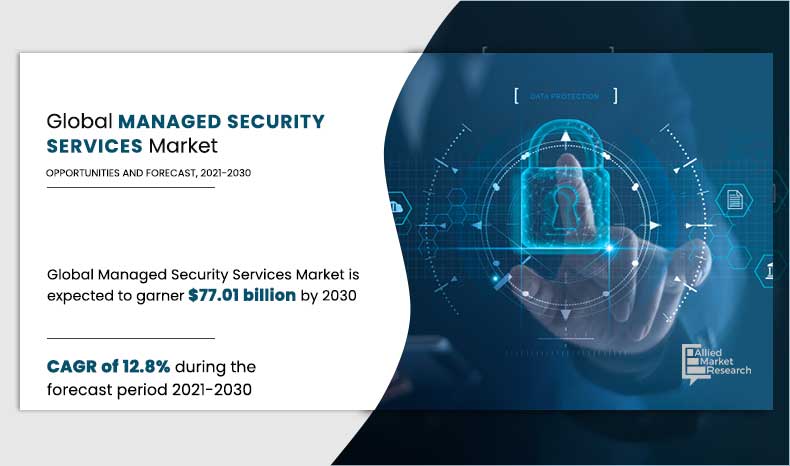
The global managed security services market size was valued at USD 22.45 billion in 2020, and is projected to reach USD 77.01 billion by 2030, growing at a CAGR of 12.8% from 2021 to 2030.
Increase in cybercrime activities, cost effectiveness, and stringent government regulations drive the global managed security services industry. In addition, growing trend of mobile devices at workplaces and rise in electronic data fuel the growth of the managed security services market. However, hesitation to share sensitive data restricts the market growth. Moreover, growing awareness about data security, growing importance of e-business, and rise in demand for customized services are expected to offer remunerative opportunities for expansion of the market during the forecast period.
Key Market Insights
- By deployment mode, the on-premise segment accounted for the largest market during forecast period
- By industry verticals, BFSI segment holds the largest managed security services market share.
- By region, North America is expected to dominated the in upcoming years.
Market Size & Forecast
- 2030 Projected Market Size: USD 77.01 Billion
- 2020 Market Size: USD 22.45 Billion
- Compound Annual Growth Rate (CAGR) (2021-2030): 12.8%
How to Describe Managed Security Services
Managed security service providers have proven to be successful solutions for organizations, as they aid in the protection of corporate internet assets, password files, critical e-mails, and networks. As a result, managed security services gain traction among organizations of all sizes, as companies increase their investment on network protection. Furthermore, service providers' dependable, effective, and economical managed security solutions assist consumers in securing their data. Managed security service providers provide customer/client businesses with cheap, dependable, and efficient security solutions that help them secure their sensitive information and, as a result, their business.
Managed Security Services Narket Segment Review
The managed security services market is segmented on the basis of deployment mode, enterprise size, application, industry verticals, and region. The deployment mode segment includes on-premise and cloud. Enterprise size are divided into large enterprises and small & medium-sized enterprises.
By Industry Verticals
BFSI segment accounted for the highest market share in 2020.
The application segment includes Managed IPS & IDS, Distributed Denial of Services (DDoS), Unified Threat Management (UTM), Secured Information and Event Management (SIEM), firewall management, endpoint security, and others. The vertical segment includes BFSI, healthcare, manufacturing, retail, telecom & IT, and others. Region-wise, the managed security services industry is analyzed across North America, Europe, Asia-Pacific, and LAMEA.
By Application
Managed IPS and IDS segment accounted for the highest market share in 2020.
In terms of enterprise size, the large enterprises segment holds the largest share of the managed security services market, due to increasing incidences of cyber-attacks and complexities of the threats in the recent past has accelerated the adoption of managed security services among large businesses. Also, the dramatic increase in pressure and awareness about IT security has been driving these businesses to outsource security services to third party players.
By Region
Asia-Pacific would exhibit the highest CAGR of 15.6% during 2021-2030
What are the Top Impacting Factors in Market
Increase in Cybercrime Activities
Cybercrime is on the rise globally. Despite the increase in sophistication of attacks and the complexity of the IT network, businesses continue to depend on antiquated data protection measures. Bring-Your-Own-Device (BYOD), cellphones, social media, and cloud service usage, among other technical innovations and practices, have significantly complicated the overall data security process. Nowadays, organized cybercriminal operations are on the rise, with well-funded organizations that are competent, coordinated, and motivated, which push cybercrime. Businesses suffer enormous financial losses as a result of cybercrime, as well as a negative impact on their brand image.
Moreover, there is an increase in cyber-attacks on the healthcare facility systems and their medical devices along with personal data of the patient that are critical for hospitals and patient privacy. Healthcare networks often support a number of endpoints running antiquated applications and operating systems. These endpoints are difficult to repair, making it costly to maintain adequate security posture. Healthcare endpoint security has become increasingly important for data protection and protection of systems from unauthorized manipulation and preventing use of malicious software.
Cost Effectiveness of Managed Security Services Providers
Data breaches and a number of sophisticated assaults have increased dramatically in the previous 8-10 years, to the point that enterprises in every industry must assure the security of their information and network infrastructure. With so many threat and vulnerability monitoring systems on the managed security services market, deciding whether to employ an in-house or cloud-based security solution is crucial in the security monitoring and management process. Due to budget restrictions, most businesses are attempting to build an in-house security infrastructure with just part-time employees. This may not be enough to ensure efficient and effective data security, as part-time employees may lack the necessary expertise.
As a result, companies are increasingly outsourcing data security activities to managed security services providers (MSSP). Along with being cost-effective, this security management option enables the firm to continue real-time network traffic monitoring by IT security specialists. MSSPs supply these services to several clients on a shared basis, lowering the cost per client. As a result, managed security services (MSS) are accessible to companies of all sizes, thus driving growth of the managed security services market analysis.
Which are the Leading Companies in Managed Security Services
The following are the leading companies in the market. These players have adopted various strategies to increase their market penetration and strengthen their position in the industry.
AT&T Intellectual Property
BT Group
Broadcom
Cisco System Inc.
Check Point Software Technologies Ltd.
DXC Technology Company
SecureWorks Inc.
Fortinet Inc.
Hewlett Packard Enterprise Development LP
IBM Corporation.
What are the Key Benefits for Stakeholders:
The study provides an in-depth analysis of the global managed security services market forecast along with current & future trends to explain the imminent investment pockets.
Information about key drivers, restraints, & opportunities and their impact analysis on global managed security services market trends is provided in the report.
The Porter’s five forces analysis illustrates the potency of the buyers and suppliers operating in the industry.
The quantitative analysis of the managed security services market size from 2021 to 2030 is provided to determine the market potential.
Managed Security Services Market Report Highlights
| Aspects | Details |
| By Deployment Mode |
|
| By Enterprises Size |
|
| By Application |
|
| By Vertical |
|
| By Region |
|
| By Key Market Players |
|
Analyst Review
The rise of powerful and sophisticated cybercriminal assaults has compelled businesses to take data security more seriously than ever before. These assaults have had a substantial financial impact on all firms, prompting them to explore for new ways to handle data protection. In this situation, managed security services gain traction since these models have shown to be a cost-effective and efficient way to monitor and maintain security infrastructure. The on-premises security deployment model is likely to lead the market among the many deployment models available in the industry, as it largely helps in securing sensitive data in the market.
Key providers of the market. such as AT&T Intellectual Property, SecureWorks, Inc. and IBM Corporation account for a significant share in the market. With the larger requirement from managed security services, various companies are partnering to increase the managed security services capabilities. For instance, in November 2021, AT&T launched an integrated, managed cybersecurity solution to help the U.S. federal agencies modernize and protect their IT infrastructure in compliance with Trusted Internet Connection (TIC) 3.0 cybersecurity guidance. AT&T Government Trusted Internet brings together software-defined wide area networking (SD-WAN) technology, security capabilities, and fiber connectivity in a 24/7 managed solution through a single provider. The comprehensive, scalable solution integrates with the AT&T Managed
Trusted Internet Protocol Service, extending highly secure remote access to federal agency workers and branch offices.
In addition, with increase in demand for managed security services, various companies are expanding their current services to continue with the rise in demand. For instance, in July 2021, BT’s SAFE (‘Security Assessment Framework for Enterprises’) platform allows organizations to take a health check of their existing defenses and understand their likelihood of suffering a major cyber-attack. The investment is expected to allow BT to combine the SAFE platform with its world-leading managed security services to provide customers with a real time view of how safe they are against an incredibly fast-moving cyber threat landscape. SAFE is unique in calculating a financial cost to customers’ risks and giving actionable insight on the steps that can be taken to address them. The platform ultimately enables organizations to surgically target gaps in their defenses, and already protects multiple Fortune 500 companies and governments globally.
Moreover, market players are expanding their business operations and customers by increasing their acquisitions. For instance, in February 2021, Cisco announced the acquisition of IMImobile PLC, a leading global provider of cloud communications software and services that manages business-critical interactions at scale. IMImobile orchestrates, automates, monitors, and delivers customer interactions that drive the best experiences. By combining IMImobile's solution with Webex Contact Center, Cisco is expected to provide a robust Customer Experience as a Service (CXaaS) offer. This new offering is believed to bring together cloud contact center, artificial intelligence, experience management, collaboration, and communications platform as a service to create a single solution that will give organizations the ability to provide the exceptional experiences that customers expect.
The global managed security services market size was valued at $22.45 billion in 2020, and is projected to reach $77.01 billion by 2030
The managed security services market is projected to grow at a compound annual growth rate of 12.8% from 2021 to 2030.
The key players profiled in the managed security services market analysis are AT&T Intellectual Property, BT Group, Broadcom, Cisco System Inc., Check Point Software Technologies Ltd., DXC Technology Company, SecureWorks Inc., Fortinet Inc., Hewlett Packard Enterprise Development LP, and IBM Corporation.
Asia-Pacific would exhibit the highest CAGR of 15.6% during 2021-2030
Increase in cybercrime activities, cost effectiveness, and stringent government regulations drive the global managed security services industry. In addition, growing trend of mobile devices at workplaces and rise in electronic data fuel the growth of the managed security services market.
Loading Table Of Content...

