
Marine Bunker Oil Market Research, 2033
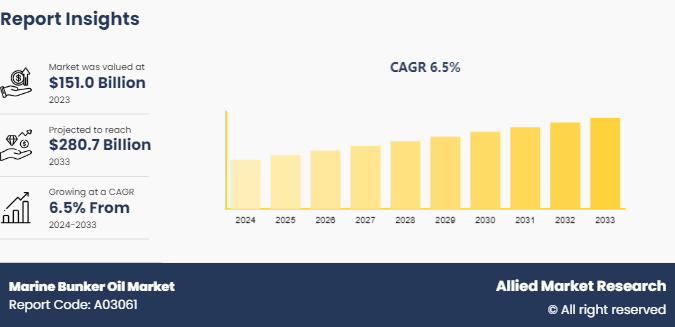
The global marine bunker oil market size was valued at $151.0 billion in 2023, and is projected to reach $280.7 billion by 2033, growing at a CAGR of 6.5% from 2024 to 2033.
Market Introduction and Definition
Marine bunker oil, commonly known as bunker fuel, refers to the heavy, viscous petroleum products used to power ships. Derived from the residue of crude oil distillation, it primarily includes heavy fuel oil (HFO) , marine gas oil (MGO) , and marine diesel oil (MDO) . Bunker oil is essential for the maritime industry, providing the necessary energy for the propulsion of large vessels and the operation of onboard machinery. However, it is characterized by high sulfur content and significant emissions of pollutants such as sulfur oxides (SOx) , nitrogen oxides (NOx) , and particulate matter, contributing to environmental pollution. To mitigate these effects, the International Maritime Organization (IMO) has implemented regulations to limit sulfur content in marine fuels.
Key Takeaways
- The marine bunker oil market report covers 20 countries. The research includes a segment analysis of each country in terms of value ($Million) for the projected period 2024-2033.
- More than 1,500 product literatures, industry releases, annual reports, and other such documents of major marine bunker oil industry participants along with authentic industry journals, trade associations' releases, and government websites have been reviewed for generating high-value industry insights.
- The study integrated high-quality data, professional opinions and analysis, and critical independent perspectives. The research approach is intended to provide a balanced view of global markets and assist stakeholders in making educated decisions to achieve their most ambitious growth objectives.
Key Market Dynamics
The surge in demand for maritime transportation is a key driver in the marine bunker oil market. As global trade expands, more goods are transported by sea, necessitating an increased number of ships and fuel consumption. With over 80% of the world's trade volume carried by maritime vessels, the need for efficient and reliable energy sources for these ships is paramount. Larger and more frequent shipping routes also contribute to the heightened marine bunker oil demand. This rise is further accelerated by e-commerce growth and emerging markets, which require robust logistical networks supported by extensive maritime transport, thereby fueling the marine bunker oil market's expansion.
The expansion in offshore oil and gas exploration significantly drives the growth of the marine bunker oil market. As energy companies intensify their search for new resources, they deploy more exploration and support vessels, rigs, and platforms. These activities demand substantial amounts of marine bunker oil for power operations, including transportation of personnel, equipment, and extracted resources. The remote and extended nature of offshore projects requires a continuous and reliable fuel supply, boosting marine bunker oil consumption. This growth in demand is further amplified by the rise in global energy needs and the exploration of untapped offshore reserves, solidifying the market’s expansion.
However, the high cost of compliance with low-sulfur requirements significantly restrains the growth of the marine bunker oil market. Regulations such as the IMO 2020 mandate, which limits sulfur content in marine fuels to 0.5%, compel ship operators to either switch to more expensive low-sulfur fuels or invest in costly exhaust cleaning technologies such as scrubbers. These expenses increase operational costs, reducing the affordability and attractiveness of traditional marine bunker oils. Smaller shipping companies face financial strain, potentially leading to market contraction. The added cost burden also discourages investment in new vessels and fuels, slowing overall market expansion and innovation. All these factors hamper the marine bunker oil market growth.
Government incentives for cleaner fuel use present a lucrative opportunity for the marine bunker oil market by encouraging the adoption of low-sulfur and alternative fuels such as LNG and biofuels. These incentives, including tax breaks, subsidies, and grants, reduce the financial burden on shipping companies transitioning to eco-friendly fuels. As a result, there is an increased demand for compliant fuels and technologies that meet stringent environmental standards. This support accelerates market adoption of cleaner fuels, stimulates investment in new infrastructure and supply chains, and fosters innovation in fuel technology, expanding the market and enhancing its sustainability profile. All these factors are anticipated to offer new growth opportunity in marine bunker oil market forecast.
Market Segmentation
The marine bunker oil market is segmented into type, commercial distributor, application, and region. By type, the market is categorized into high sulfur fuel oil, low sulfur fuel oil, marine gas oil, and others. By commercial distributor, the market is divided into oil majors, large independent, and small independent. By application, the market is segregated into oil tanker, chemical tanker, gas tanker, and others. Region-wise the market is analyzed across North America, Europe, Asia-Pacific, and LAMEA.
Competitive Landscape
The key market players operating in the marine bunker oil market outlook include bp p.l.c., Total Energies, Neste, Shell Plc, Exxon Mobil Corporation., LUKOIL, Petroliam Nasional Berhad (PETRONAS) , Chevron Corporation., Hindustan Petroleum Corporation Limited, Indian Oil Corporation Ltd. and others.
Regional Market Outlook
In the Asia-Pacific region, the marine bunker oil market's growth is propelled by several key factors. The region is a critical nexus for global maritime trade, with bustling ports such as Singapore, Shanghai, and Hong Kong serving as major refueling hubs for international shipping routes. The economic boom in countries such as China, Japan, and South Korea drives substantial maritime activity, increasing demand for marine bunker oils. In addition, the strategic investments in port infrastructure and logistics capabilities enhance fuel supply efficiency. Regulatory shifts towards low-sulfur fuels further stimulate market dynamics, as the region adapts to stringent environmental standards while maintaining its role as a global shipping powerhouse.
- According to the Ministry of Shipping, around 95% of India's trading by volume and 70% by value is done through maritime transport. In November 2020, the Prime Minister, Mr. Narendra Modi renamed the Ministry of Shipping as the Ministry of Ports, Shipping and Waterways.
- According to the India Band Equity Foundation, on March 15, 2024, The Ministry of Ports, Shipping and Waterways approved $ 77.79 million for 10 new waterways projects on the Brahmaputra in Assam, enhancing connectivity, boosting river tourism, and facilitating public commute, all under the Sagarmala programme. The approval of new waterways projects on the Brahmaputra in Assam is likely to increase regional demand for marine bunker oils as enhanced connectivity and river traffic boost maritime and tourism activities.
Key Regulations
- IMO 2020 Regulation:
Implemented by the International Maritime Organization (IMO) , this regulation mandates a significant reduction in sulfur emissions from ships by limiting the sulfur content in marine fuels to 0.5% (from the previous limit of 3.5%) , unless ships are equipped with exhaust gas cleaning systems (scrubbers) .
- MARPOL Annex VI:
Part of the International Convention for the Prevention of Pollution from Ships (MARPOL) , Annex VI sets limits on emissions of sulfur oxides (SOx) and nitrogen oxides (NOx) from ship exhausts, as well as prohibits deliberate emissions of ozone-depleting substances.
- North American ECA (Emission Control Area) :
The North American Emission Control Area (ECA) enforces sulfur limits of 0.1% for marine fuels since 2012. This regulation is established under the U.S. Clean Air Act and the Canadian Vessel Pollution and Dangerous Chemicals Regulations, aiming to reduce sulfur oxide emissions and improve air quality in coastal and inland waters.
- California Air Resources Board (CARB) :
The California Air Resources Board (CARB) enforces regulations under the California Code of Regulations, Title 13, Section 2299.1. These regulations mandate strict emission standards for vessels, including requirements for low-sulfur fuels (CARB Diesel Rule) and use of emission control technologies (e.g., exhaust gas cleaning systems) to reduce air pollutants in California waters.
- Ballast Water Management Convention:
The Ballast Water Management Convention (BWMC) , under IMO's Act BWM/CONF/36, mandates the ships to manage their ballast water to prevent invasive species from spreading. It sets standards (Act BWM.2/Circ.70) for ballast water treatment and exchange, aiming to protect marine ecosystems from biological pollution.
Pricing Analysis of Very Low Sulfur Fuel Oil (VLSFO)

In 2019, the price of VLSFO stood at 561.0 $/metric ton, indicating a relatively high cost for compliant marine fuel compared to traditional marine bunker oils. This was primarily driven by the transition period leading up to the implementation of the International Maritime Organization's (IMO) sulfur cap regulation, which required ships to use fuels with sulfur content not exceeding 0.5%. However, in 2020, the price of VLSFO dropped sharply to 357.5 $/metric ton. This significant decrease was attributed to the COVID-19 pandemic, which led to a steep decline in global oil demand and prices. The economic downturn and reduced maritime activities resulted in a surplus of VLSFO supply, causing prices to plummet.
As the world gradually recovered from the pandemic in 2021, the price of VLSFO surged to 622.0 $/metric ton. This increase reflected the rebound in oil demand and the continued implementation of IMO regulations, which drive demand for compliant fuels. By 2022, the price of VLSFO further increased to 714.0 $/metric ton. This escalation is attributed to various factors, including geopolitical tensions, supply chain disruptions, and recovering global economic activity. In addition, ongoing efforts by the shipping industry to comply with environmental regulations continued to support demand for VLSFO. Moreover in 2022, the price of VLSFO slightly decreased in 2023, settling at 667.0 $/metric ton. This fluctuation is influenced by market dynamics, changes in oil prices, and adjustments in supply and demand conditions.
Industry Trends
- A prominent trend in the industry is the adoption of IMO (International Maritime Organization) regulations mandating ships to transition from high-sulfur marine bunker oils (with 3.5% sulfur content) to lower-sulfur alternatives (0.5% sulfur content or less) . This shift, known as IMO 2020, has prompted the use of compliant fuels such as marine gasoil and marine diesel oil that meet these stringent sulfur content requirements.
- In response to IMO regulations requiring ships to reduce sulfur emissions, many vessels have turned to exhaust gas cleaning systems, commonly known as scrubbers. These systems are installed onboard to cleanse sulfur oxides from exhaust gases, enabling ships to use high-sulfur fuel oil (HSFO) while adhering to IMO standards. For instance, major shipping companies such as Maersk and Mediterranean Shipping Company have invested in scrubber technology to comply with environmental regulations without completely overhauling their fuel choices. This approach not only ensures compliance but also supports operational continuity and cost-efficiency for maritime transport.
- In December 2021, TOKYO-Mitsui O.S.K. Lines, Ltd. (MOL) announced that, along with its group company MOL Information Systems, Ltd. (MOLIS) , it had developed a new system called "BUNKER HUB." This system, part of its efforts to promote Digital Transformation (DX) , was designed to manage bunker oil and lubricant analysis results and commenced service in August of that year. The launch of the "BUNKER HUB" system by MOL and MOLIS enhanced the marine bunker oil market's operational efficiency and transparency by streamlining the management of bunker oil and lubricant analysis.
Key Sources Referred
- Invest India
- India Brand Equity Foundation
- International Maritime Organization (IMO)
- European Maritime Safety Agency (EMSA)
- International Bunker Industry Association (IBIA)
- World Bunkering Association
Key Benefits For Stakeholders
- This report provides a quantitative analysis of the market segments, current trends, estimations, and dynamics of the marine bunker oil market analysis from 2024 to 2033 to identify the prevailing marine bunker oil market opportunities.
- The market research is offered along with information related to key drivers, restraints, and opportunities.
- Porter's five forces analysis highlights the potency of buyers and suppliers to enable stakeholders make profit-oriented business decisions and strengthen their supplier-buyer network.
- In-depth analysis of the marine bunker oil market share and segmentation assists to determine the prevailing market opportunities.
- Major countries in each region are mapped according to their revenue contribution to the global market.
- Market player positioning facilitates benchmarking and provides a clear understanding of the present position of the market players.
- The report includes the analysis of the regional as well as global marine bunker oil market trends, key players, market segments, application areas, and market growth strategies.
Marine Bunker Oil Market Report Highlights
| Aspects | Details |
| Market Size By 2033 | USD 280.7 Billion |
| Growth Rate | CAGR of 6.5% |
| Forecast period | 2024 - 2033 |
| Report Pages | 290 |
| By Type |
|
| By Commercial Distributor |
|
| By Application |
|
| By Region |
|
| Key Market Players | Petroliam Nasional Berhad (PETRONAS), LUKOIL, Exxon Mobil Corporation, TotalEnergies, Hindustan Petroleum Corporation Limited, BP p.l.c., Chevron Corporation, Shell Plc., Indian Oil Corporation Ltd., Neste |
| | Yang Ming Marine Transport Corporation, HMM Co. Ltd, Pacific International Lines Pte Ltd |
The Marine bunker oil market was valued at $151 billion in 2023 and is estimated to reach $280.7 billion by 2033, growing at a CAGR of 6.5% from 2024 to 2033.
Oil Tankers is the leading application of Marine Bunker Oil Market
Government incentives for cleaner fuel use is the upcoming trends of Marine Bunker Oil Market in the globe
Asia-Pacific is the largest regional market for Marine Bunker Oil
The key market players operating in the marine bunker oil market include bp p.l.c., Total Energies, Neste, Shell Plc, Exxon Mobil Corporation., LUKOIL, Petroliam Nasional Berhad (PETRONAS), Chevron Corporation., Hindustan Petroleum Corporation Limited, Indian Oil Corporation Ltd. and others.
Loading Table Of Content...

