0
Upcoming Allied Market Research
2023
Marine Navigation And Communication System Market

Marine Navigation And Communication System Market

by Systems (Navigation, Communication), by Type (Electronic Navigations Chart, Chart Plotter), by Platform (Submarines, Surface ships, Unmanned systems), by Application (Ship, Remotely Operated Underwater Vehicle, Autonomous Underwater Boat and Vehicles), by End-use (Defense, Commercial) and by Industry Vertical (Military Defense, Metal Industry, Others): Global Opportunity Analysis and Industry Forecast, 2023-2032

Report Code: A10730
Nov 2023 | Pages: NA
Tables: NA
Charts: NA
  • Formats*:

  • pdf

    Single User License, Five User
    License & Enterprise User License

  • xls

    Data Pack Excel License

  • ppt

    It comes with the additional cost
    of $2500.00 contact sales.


COVID-19

Pandemic disrupted the entire world and affected many industries.

Get detailed COVID-19 impact analysis on the Marine Navigation And Communication System Market

Request Now !

Marine Navigation and Communication System Market Outlook – 2027

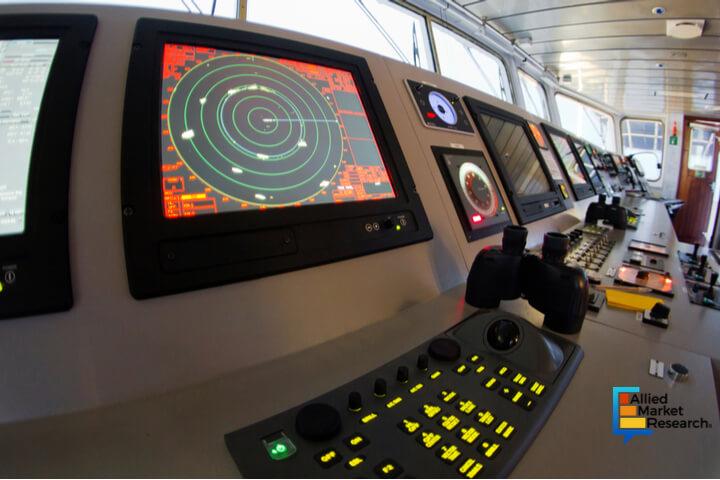
Marine navigation and communication system is defined as a navigation and communication tool equipped with GPS navigator and SATCOM. Marine navigation & communication system displays high quality satellite imaging and it provides navigation chart for better navigation. In addition, it provides naval equipment and instruments, which are essential for underwater navigation and inter-bodies communication. It helps to standardize maritime reporting and it increase safety & security.

Marine Navigation And Communication System Market

COVID-19 scenario analysis

Owing to the lockdown implemented across various countries, national and international transport have been hampered, which has significantly impacted the supply chain of marine navigation and communication systems across the globe, thereby increasing the supply–demand gap. Thus, insufficiency in raw material supply is expected to hamper the production rate of these systems, which negatively impacts the market growth. However, this situation is expected to improve as government has started relaxing norms around the world for resuming business activities. In addition, the manufacturing processes for marine navigation and communication systems has significantly dropped down due to COVID-19 implications. This is attributed to production shutdown and disrupted supply chains, thus hitting global operations and revenue of the market.

Top impacting factors: market scenario analysis, trends, drivers, and impact analysis

Increase in  demand for broadband connections and VSAT connectivity

With the increasing availability of satellite services offering Ku-band or Ka-band for VSAT, the demand for broadband connections and greater bandwidth is increasing. In addition, the demand growth is driven by crew welfare, seafarers, and passengers using their own devices on ships and the increasing appetite for operational data processing and analysis. Moreover, lower satellite capacity pricing is paving the way for the adoption of broadband VSAT. The demand for data is continuously growing as satellite operators are increasing their capacity for maritime markets. With more supply pushing bandwidth costs lower, end users are responding by ramping up their demand for VSAT connectivity across all segments, including merchant, passenger, offshore (oil and gas), and fishing. These factors collectively driving the market growth.

The global marine navigation and communication system market trends are as follows:

The ongoing R&D toward the development of advanced maritime technologies

The ongoing R&D toward the development of advanced maritime technologies, such as stealth submarines and unmanned marine systems, is envisioned to inspire the potential investments in the development and induction of sophisticated navigation systems.  In addition, owing to the increase in worldwide concerns toward naval security,  leading market players are escalating their expenditure toward the development of maritime navigation and communication systems. These factors collectively fuel the market growth.

Lack of reliability and flexibility of satellite communication

With the increasing usage of technologies in maritime satellite, customers are finding difficulties in operating satellite solutions. Occasionally , maritime satellite vendors fail to provide reliable communication solutions; as a result, communication equipment and services do not perform effectively under unfavorable weather conditions. Thus, satellite communication service providers face challenge to provide reliable communication to their customers irrespective of the weather conditions. This, in turn, is expected to hamper the market growth.

Key benefits of the report

  • This study presents the analytical depiction of the global marine navigation and communication system industry along with the current trends and future estimations to determine the imminent investment pockets.
  • The report presents information related to key drivers, restraints, and opportunities along with a detailed analysis of the global marine navigation and communication system market share.
  • The current market is quantitatively analyzed to highlight the global marine navigation and communication system market growth scenario.
  • Porter’s five forces analysis illustrates the potency of buyers & suppliers in the market.
  • The report provides detailed market analysis depending on competitive intensity and how the competition will take shape in the coming years.

Questions answered in the marine navigation and communication system market research report:

  • What are the leading players active in the marine navigation and communication system market?
  • What are the current trends that will influence the market in the next few years?
  • What are the driving factors, restraints, and opportunities of the market?
  • What future projections would help in taking further strategic steps?

Marine Navigation And Communication System Market Report Highlights

Aspects Details
By Systems
  • Navigation
  • Communication
By Type
  • Electronic Navigations Chart
  • Chart Plotter
By Platform
  • Submarines
  • Surface ships
  • Unmanned systems
By Application
  • Ship
  • Remotely Operated Underwater Vehicle
  • Autonomous Underwater Boat and Vehicles
By End-use
  • Defense
  • Commercial
By Industry Vertical
  • Military & Defense
  • Metal Industry
  • Others
By Region
  • North America  (U.S., Canada, Mexico)
  • Europe  (UK, Germany, France, Russia, Rest of Europe)
  • Asia-Pacific  (China, Japan, India, South Korea, Australia, Rest of Asia-Pacific)
  • LAMEA  (Latin America, Middle East, Africa, Rest of LAMEA)
Key Market Players Iridium Communications Inc., Inmarsat Group Limited, Safran SA, Thales Group, Northrop Grumman Corporation, Hughes Network Systems LLC, Network Innovation Inc., Thurava Telecommunications Company, Honeywell International Inc., FLIR Systems Inc.
 
  • CHAPTER 1: INTRODUCTION

    • 1.1. Report Description

    • 1.2. Key Market Segments

    • 1.3. Key Benefits

    • 1.4. Research Methodology

      • 1.4.1. Primary Research

      • 1.4.2. Secondary Research

      • 1.4.3. Analyst Tools and Models

  • CHAPTER 2: EXECUTIVE SUMMARY

    • 2.1. CXO Perspective

  • CHAPTER 3: MARKET LANDSCAPE

    • 3.1. Market Definition and Scope

    • 3.2. Key Findings

      • 3.2.1. Top Investment Pockets

      • 3.2.2. Top Winning Strategies

    • 3.3. Porter's Five Forces Analysis

      • 3.3.1. Bargaining Power of Suppliers

      • 3.3.2. Threat of New Entrants

      • 3.3.3. Threat of Substitutes

      • 3.3.4. Competitive Rivalry

      • 3.3.5. Bargaining Power among Buyers

    • 3.5. Market Dynamics

      • 3.5.1. Drivers

      • 3.5.2. Restraints

      • 3.5.3. Opportunities

    • 3.6. COVID-19 Impact Analysis

  • CHAPTER 4: MARINE NAVIGATION AND COMMUNICATION SYSTEM MARKET, BY SYSTEMS

    • 4.1. Market Overview

      • 4.1.1 Market Size and Forecast, By Systems

    • 4.2. Navigation

      • 4.2.1. Key Market Trends, Growth Factors and Opportunities

      • 4.2.2. Market Size and Forecast, By Region

      • 4.2.3. Market Share Analysis, By Country

    • 4.3. Communication

      • 4.3.1. Key Market Trends, Growth Factors and Opportunities

      • 4.3.2. Market Size and Forecast, By Region

      • 4.3.3. Market Share Analysis, By Country

  • CHAPTER 5: MARINE NAVIGATION AND COMMUNICATION SYSTEM MARKET, BY TYPE

    • 5.1. Market Overview

      • 5.1.1 Market Size and Forecast, By Type

    • 5.2. Electronic Navigations Chart

      • 5.2.1. Key Market Trends, Growth Factors and Opportunities

      • 5.2.2. Market Size and Forecast, By Region

      • 5.2.3. Market Share Analysis, By Country

    • 5.3. Chart Plotter

      • 5.3.1. Key Market Trends, Growth Factors and Opportunities

      • 5.3.2. Market Size and Forecast, By Region

      • 5.3.3. Market Share Analysis, By Country

  • CHAPTER 6: MARINE NAVIGATION AND COMMUNICATION SYSTEM MARKET, BY PLATFORM

    • 6.1. Market Overview

      • 6.1.1 Market Size and Forecast, By Platform

    • 6.2. Submarines

      • 6.2.1. Key Market Trends, Growth Factors and Opportunities

      • 6.2.2. Market Size and Forecast, By Region

      • 6.2.3. Market Share Analysis, By Country

    • 6.3. Surface Ships

      • 6.3.1. Key Market Trends, Growth Factors and Opportunities

      • 6.3.2. Market Size and Forecast, By Region

      • 6.3.3. Market Share Analysis, By Country

    • 6.4. Unmanned Systems

      • 6.4.1. Key Market Trends, Growth Factors and Opportunities

      • 6.4.2. Market Size and Forecast, By Region

      • 6.4.3. Market Share Analysis, By Country

  • CHAPTER 7: MARINE NAVIGATION AND COMMUNICATION SYSTEM MARKET, BY APPLICATION

    • 7.1. Market Overview

      • 7.1.1 Market Size and Forecast, By Application

    • 7.2. Ship

      • 7.2.1. Key Market Trends, Growth Factors and Opportunities

      • 7.2.2. Market Size and Forecast, By Region

      • 7.2.3. Market Share Analysis, By Country

    • 7.3. Remotely Operated Underwater Vehicle

      • 7.3.1. Key Market Trends, Growth Factors and Opportunities

      • 7.3.2. Market Size and Forecast, By Region

      • 7.3.3. Market Share Analysis, By Country

    • 7.4. Autonomous Underwater Boat And Vehicles

      • 7.4.1. Key Market Trends, Growth Factors and Opportunities

      • 7.4.2. Market Size and Forecast, By Region

      • 7.4.3. Market Share Analysis, By Country

  • CHAPTER 8: MARINE NAVIGATION AND COMMUNICATION SYSTEM MARKET, BY END-USE

    • 8.1. Market Overview

      • 8.1.1 Market Size and Forecast, By End-use

    • 8.2. Defense

      • 8.2.1. Key Market Trends, Growth Factors and Opportunities

      • 8.2.2. Market Size and Forecast, By Region

      • 8.2.3. Market Share Analysis, By Country

    • 8.3. Commercial

      • 8.3.1. Key Market Trends, Growth Factors and Opportunities

      • 8.3.2. Market Size and Forecast, By Region

      • 8.3.3. Market Share Analysis, By Country

  • CHAPTER 9: MARINE NAVIGATION AND COMMUNICATION SYSTEM MARKET, BY INDUSTRY VERTICAL

    • 9.1. Market Overview

      • 9.1.1 Market Size and Forecast, By Industry Vertical

    • 9.2. Military Defense

      • 9.2.1. Key Market Trends, Growth Factors and Opportunities

      • 9.2.2. Market Size and Forecast, By Region

      • 9.2.3. Market Share Analysis, By Country

    • 9.3. Metal Industry

      • 9.3.1. Key Market Trends, Growth Factors and Opportunities

      • 9.3.2. Market Size and Forecast, By Region

      • 9.3.3. Market Share Analysis, By Country

    • 9.4. Others

      • 9.4.1. Key Market Trends, Growth Factors and Opportunities

      • 9.4.2. Market Size and Forecast, By Region

      • 9.4.3. Market Share Analysis, By Country

  • CHAPTER 10: MARINE NAVIGATION AND COMMUNICATION SYSTEM MARKET, BY REGION

    • 10.1. Market Overview

      • 10.1.1 Market Size and Forecast, By Region

    • 10.2. North America

      • 10.2.1. Key Market Trends and Opportunities

      • 10.2.2. Market Size and Forecast, By Systems

      • 10.2.3. Market Size and Forecast, By Type

      • 10.2.4. Market Size and Forecast, By Platform

      • 10.2.5. Market Size and Forecast, By Application

      • 10.2.6. Market Size and Forecast, By End-use

      • 10.2.7. Market Size and Forecast, By Industry Vertical

      • 10.2.8. Market Size and Forecast, By Country

      • 10.2.9. U.S. Marine Navigation And Communication System Market

        • 10.2.9.1. Market Size and Forecast, By Systems
        • 10.2.9.2. Market Size and Forecast, By Type
        • 10.2.9.3. Market Size and Forecast, By Platform
        • 10.2.9.4. Market Size and Forecast, By Application
        • 10.2.9.5. Market Size and Forecast, By End-use
        • 10.2.9.6. Market Size and Forecast, By Industry Vertical
      • 10.2.10. Canada Marine Navigation And Communication System Market

        • 10.2.10.1. Market Size and Forecast, By Systems
        • 10.2.10.2. Market Size and Forecast, By Type
        • 10.2.10.3. Market Size and Forecast, By Platform
        • 10.2.10.4. Market Size and Forecast, By Application
        • 10.2.10.5. Market Size and Forecast, By End-use
        • 10.2.10.6. Market Size and Forecast, By Industry Vertical
      • 10.2.11. Mexico Marine Navigation And Communication System Market

        • 10.2.11.1. Market Size and Forecast, By Systems
        • 10.2.11.2. Market Size and Forecast, By Type
        • 10.2.11.3. Market Size and Forecast, By Platform
        • 10.2.11.4. Market Size and Forecast, By Application
        • 10.2.11.5. Market Size and Forecast, By End-use
        • 10.2.11.6. Market Size and Forecast, By Industry Vertical
    • 10.3. Europe

      • 10.3.1. Key Market Trends and Opportunities

      • 10.3.2. Market Size and Forecast, By Systems

      • 10.3.3. Market Size and Forecast, By Type

      • 10.3.4. Market Size and Forecast, By Platform

      • 10.3.5. Market Size and Forecast, By Application

      • 10.3.6. Market Size and Forecast, By End-use

      • 10.3.7. Market Size and Forecast, By Industry Vertical

      • 10.3.8. Market Size and Forecast, By Country

      • 10.3.9. France Marine Navigation And Communication System Market

        • 10.3.9.1. Market Size and Forecast, By Systems
        • 10.3.9.2. Market Size and Forecast, By Type
        • 10.3.9.3. Market Size and Forecast, By Platform
        • 10.3.9.4. Market Size and Forecast, By Application
        • 10.3.9.5. Market Size and Forecast, By End-use
        • 10.3.9.6. Market Size and Forecast, By Industry Vertical
      • 10.3.10. Germany Marine Navigation And Communication System Market

        • 10.3.10.1. Market Size and Forecast, By Systems
        • 10.3.10.2. Market Size and Forecast, By Type
        • 10.3.10.3. Market Size and Forecast, By Platform
        • 10.3.10.4. Market Size and Forecast, By Application
        • 10.3.10.5. Market Size and Forecast, By End-use
        • 10.3.10.6. Market Size and Forecast, By Industry Vertical
      • 10.3.11. Italy Marine Navigation And Communication System Market

        • 10.3.11.1. Market Size and Forecast, By Systems
        • 10.3.11.2. Market Size and Forecast, By Type
        • 10.3.11.3. Market Size and Forecast, By Platform
        • 10.3.11.4. Market Size and Forecast, By Application
        • 10.3.11.5. Market Size and Forecast, By End-use
        • 10.3.11.6. Market Size and Forecast, By Industry Vertical
      • 10.3.12. Spain Marine Navigation And Communication System Market

        • 10.3.12.1. Market Size and Forecast, By Systems
        • 10.3.12.2. Market Size and Forecast, By Type
        • 10.3.12.3. Market Size and Forecast, By Platform
        • 10.3.12.4. Market Size and Forecast, By Application
        • 10.3.12.5. Market Size and Forecast, By End-use
        • 10.3.12.6. Market Size and Forecast, By Industry Vertical
      • 10.3.13. UK Marine Navigation And Communication System Market

        • 10.3.13.1. Market Size and Forecast, By Systems
        • 10.3.13.2. Market Size and Forecast, By Type
        • 10.3.13.3. Market Size and Forecast, By Platform
        • 10.3.13.4. Market Size and Forecast, By Application
        • 10.3.13.5. Market Size and Forecast, By End-use
        • 10.3.13.6. Market Size and Forecast, By Industry Vertical
      • 10.3.14. Russia Marine Navigation And Communication System Market

        • 10.3.14.1. Market Size and Forecast, By Systems
        • 10.3.14.2. Market Size and Forecast, By Type
        • 10.3.14.3. Market Size and Forecast, By Platform
        • 10.3.14.4. Market Size and Forecast, By Application
        • 10.3.14.5. Market Size and Forecast, By End-use
        • 10.3.14.6. Market Size and Forecast, By Industry Vertical
      • 10.3.15. Rest Of Europe Marine Navigation And Communication System Market

        • 10.3.15.1. Market Size and Forecast, By Systems
        • 10.3.15.2. Market Size and Forecast, By Type
        • 10.3.15.3. Market Size and Forecast, By Platform
        • 10.3.15.4. Market Size and Forecast, By Application
        • 10.3.15.5. Market Size and Forecast, By End-use
        • 10.3.15.6. Market Size and Forecast, By Industry Vertical
    • 10.4. Asia-Pacific

      • 10.4.1. Key Market Trends and Opportunities

      • 10.4.2. Market Size and Forecast, By Systems

      • 10.4.3. Market Size and Forecast, By Type

      • 10.4.4. Market Size and Forecast, By Platform

      • 10.4.5. Market Size and Forecast, By Application

      • 10.4.6. Market Size and Forecast, By End-use

      • 10.4.7. Market Size and Forecast, By Industry Vertical

      • 10.4.8. Market Size and Forecast, By Country

      • 10.4.9. China Marine Navigation And Communication System Market

        • 10.4.9.1. Market Size and Forecast, By Systems
        • 10.4.9.2. Market Size and Forecast, By Type
        • 10.4.9.3. Market Size and Forecast, By Platform
        • 10.4.9.4. Market Size and Forecast, By Application
        • 10.4.9.5. Market Size and Forecast, By End-use
        • 10.4.9.6. Market Size and Forecast, By Industry Vertical
      • 10.4.10. Japan Marine Navigation And Communication System Market

        • 10.4.10.1. Market Size and Forecast, By Systems
        • 10.4.10.2. Market Size and Forecast, By Type
        • 10.4.10.3. Market Size and Forecast, By Platform
        • 10.4.10.4. Market Size and Forecast, By Application
        • 10.4.10.5. Market Size and Forecast, By End-use
        • 10.4.10.6. Market Size and Forecast, By Industry Vertical
      • 10.4.11. India Marine Navigation And Communication System Market

        • 10.4.11.1. Market Size and Forecast, By Systems
        • 10.4.11.2. Market Size and Forecast, By Type
        • 10.4.11.3. Market Size and Forecast, By Platform
        • 10.4.11.4. Market Size and Forecast, By Application
        • 10.4.11.5. Market Size and Forecast, By End-use
        • 10.4.11.6. Market Size and Forecast, By Industry Vertical
      • 10.4.12. South Korea Marine Navigation And Communication System Market

        • 10.4.12.1. Market Size and Forecast, By Systems
        • 10.4.12.2. Market Size and Forecast, By Type
        • 10.4.12.3. Market Size and Forecast, By Platform
        • 10.4.12.4. Market Size and Forecast, By Application
        • 10.4.12.5. Market Size and Forecast, By End-use
        • 10.4.12.6. Market Size and Forecast, By Industry Vertical
      • 10.4.13. Australia Marine Navigation And Communication System Market

        • 10.4.13.1. Market Size and Forecast, By Systems
        • 10.4.13.2. Market Size and Forecast, By Type
        • 10.4.13.3. Market Size and Forecast, By Platform
        • 10.4.13.4. Market Size and Forecast, By Application
        • 10.4.13.5. Market Size and Forecast, By End-use
        • 10.4.13.6. Market Size and Forecast, By Industry Vertical
      • 10.4.14. Thailand Marine Navigation And Communication System Market

        • 10.4.14.1. Market Size and Forecast, By Systems
        • 10.4.14.2. Market Size and Forecast, By Type
        • 10.4.14.3. Market Size and Forecast, By Platform
        • 10.4.14.4. Market Size and Forecast, By Application
        • 10.4.14.5. Market Size and Forecast, By End-use
        • 10.4.14.6. Market Size and Forecast, By Industry Vertical
      • 10.4.15. Malaysia Marine Navigation And Communication System Market

        • 10.4.15.1. Market Size and Forecast, By Systems
        • 10.4.15.2. Market Size and Forecast, By Type
        • 10.4.15.3. Market Size and Forecast, By Platform
        • 10.4.15.4. Market Size and Forecast, By Application
        • 10.4.15.5. Market Size and Forecast, By End-use
        • 10.4.15.6. Market Size and Forecast, By Industry Vertical
      • 10.4.16. Indonesia Marine Navigation And Communication System Market

        • 10.4.16.1. Market Size and Forecast, By Systems
        • 10.4.16.2. Market Size and Forecast, By Type
        • 10.4.16.3. Market Size and Forecast, By Platform
        • 10.4.16.4. Market Size and Forecast, By Application
        • 10.4.16.5. Market Size and Forecast, By End-use
        • 10.4.16.6. Market Size and Forecast, By Industry Vertical
      • 10.4.17. Rest of Asia Pacific Marine Navigation And Communication System Market

        • 10.4.17.1. Market Size and Forecast, By Systems
        • 10.4.17.2. Market Size and Forecast, By Type
        • 10.4.17.3. Market Size and Forecast, By Platform
        • 10.4.17.4. Market Size and Forecast, By Application
        • 10.4.17.5. Market Size and Forecast, By End-use
        • 10.4.17.6. Market Size and Forecast, By Industry Vertical
    • 10.5. LAMEA

      • 10.5.1. Key Market Trends and Opportunities

      • 10.5.2. Market Size and Forecast, By Systems

      • 10.5.3. Market Size and Forecast, By Type

      • 10.5.4. Market Size and Forecast, By Platform

      • 10.5.5. Market Size and Forecast, By Application

      • 10.5.6. Market Size and Forecast, By End-use

      • 10.5.7. Market Size and Forecast, By Industry Vertical

      • 10.5.8. Market Size and Forecast, By Country

      • 10.5.9. Brazil Marine Navigation And Communication System Market

        • 10.5.9.1. Market Size and Forecast, By Systems
        • 10.5.9.2. Market Size and Forecast, By Type
        • 10.5.9.3. Market Size and Forecast, By Platform
        • 10.5.9.4. Market Size and Forecast, By Application
        • 10.5.9.5. Market Size and Forecast, By End-use
        • 10.5.9.6. Market Size and Forecast, By Industry Vertical
      • 10.5.10. South Africa Marine Navigation And Communication System Market

        • 10.5.10.1. Market Size and Forecast, By Systems
        • 10.5.10.2. Market Size and Forecast, By Type
        • 10.5.10.3. Market Size and Forecast, By Platform
        • 10.5.10.4. Market Size and Forecast, By Application
        • 10.5.10.5. Market Size and Forecast, By End-use
        • 10.5.10.6. Market Size and Forecast, By Industry Vertical
      • 10.5.11. Saudi Arabia Marine Navigation And Communication System Market

        • 10.5.11.1. Market Size and Forecast, By Systems
        • 10.5.11.2. Market Size and Forecast, By Type
        • 10.5.11.3. Market Size and Forecast, By Platform
        • 10.5.11.4. Market Size and Forecast, By Application
        • 10.5.11.5. Market Size and Forecast, By End-use
        • 10.5.11.6. Market Size and Forecast, By Industry Vertical
      • 10.5.12. UAE Marine Navigation And Communication System Market

        • 10.5.12.1. Market Size and Forecast, By Systems
        • 10.5.12.2. Market Size and Forecast, By Type
        • 10.5.12.3. Market Size and Forecast, By Platform
        • 10.5.12.4. Market Size and Forecast, By Application
        • 10.5.12.5. Market Size and Forecast, By End-use
        • 10.5.12.6. Market Size and Forecast, By Industry Vertical
      • 10.5.13. Argentina Marine Navigation And Communication System Market

        • 10.5.13.1. Market Size and Forecast, By Systems
        • 10.5.13.2. Market Size and Forecast, By Type
        • 10.5.13.3. Market Size and Forecast, By Platform
        • 10.5.13.4. Market Size and Forecast, By Application
        • 10.5.13.5. Market Size and Forecast, By End-use
        • 10.5.13.6. Market Size and Forecast, By Industry Vertical
      • 10.5.14. Rest of LAMEA Marine Navigation And Communication System Market

        • 10.5.14.1. Market Size and Forecast, By Systems
        • 10.5.14.2. Market Size and Forecast, By Type
        • 10.5.14.3. Market Size and Forecast, By Platform
        • 10.5.14.4. Market Size and Forecast, By Application
        • 10.5.14.5. Market Size and Forecast, By End-use
        • 10.5.14.6. Market Size and Forecast, By Industry Vertical
  • CHAPTER 11: COMPETITIVE LANDSCAPE

    • 11.1. Introduction

    • 11.2. Top Winning Strategies

    • 11.3. Product Mapping Of Top 10 Player

    • 11.4. Competitive Dashboard

    • 11.5. Competitive Heatmap

    • 11.6. Top Player Positioning,2022

  • CHAPTER 12: COMPANY PROFILES

    • 12.1. Northrop Grumman Corporation

      • 12.1.1. Company Overview

      • 12.1.2. Key Executives

      • 12.1.3. Company Snapshot

      • 12.1.4. Operating Business Segments

      • 12.1.5. Product Portfolio

      • 12.1.6. Business Performance

      • 12.1.7. Key Strategic Moves and Developments

    • 12.2. Honeywell International Inc.

      • 12.2.1. Company Overview

      • 12.2.2. Key Executives

      • 12.2.3. Company Snapshot

      • 12.2.4. Operating Business Segments

      • 12.2.5. Product Portfolio

      • 12.2.6. Business Performance

      • 12.2.7. Key Strategic Moves and Developments

    • 12.3. Safran SA

      • 12.3.1. Company Overview

      • 12.3.2. Key Executives

      • 12.3.3. Company Snapshot

      • 12.3.4. Operating Business Segments

      • 12.3.5. Product Portfolio

      • 12.3.6. Business Performance

      • 12.3.7. Key Strategic Moves and Developments

    • 12.4. Thales Group

      • 12.4.1. Company Overview

      • 12.4.2. Key Executives

      • 12.4.3. Company Snapshot

      • 12.4.4. Operating Business Segments

      • 12.4.5. Product Portfolio

      • 12.4.6. Business Performance

      • 12.4.7. Key Strategic Moves and Developments

    • 12.5. FLIR Systems Inc.

      • 12.5.1. Company Overview

      • 12.5.2. Key Executives

      • 12.5.3. Company Snapshot

      • 12.5.4. Operating Business Segments

      • 12.5.5. Product Portfolio

      • 12.5.6. Business Performance

      • 12.5.7. Key Strategic Moves and Developments

    • 12.6. Hughes Network Systems LLC

      • 12.6.1. Company Overview

      • 12.6.2. Key Executives

      • 12.6.3. Company Snapshot

      • 12.6.4. Operating Business Segments

      • 12.6.5. Product Portfolio

      • 12.6.6. Business Performance

      • 12.6.7. Key Strategic Moves and Developments

    • 12.7. Inmarsat Group Limited

      • 12.7.1. Company Overview

      • 12.7.2. Key Executives

      • 12.7.3. Company Snapshot

      • 12.7.4. Operating Business Segments

      • 12.7.5. Product Portfolio

      • 12.7.6. Business Performance

      • 12.7.7. Key Strategic Moves and Developments

    • 12.8. Thurava Telecommunications Company

      • 12.8.1. Company Overview

      • 12.8.2. Key Executives

      • 12.8.3. Company Snapshot

      • 12.8.4. Operating Business Segments

      • 12.8.5. Product Portfolio

      • 12.8.6. Business Performance

      • 12.8.7. Key Strategic Moves and Developments

    • 12.9. Network Innovation Inc.

      • 12.9.1. Company Overview

      • 12.9.2. Key Executives

      • 12.9.3. Company Snapshot

      • 12.9.4. Operating Business Segments

      • 12.9.5. Product Portfolio

      • 12.9.6. Business Performance

      • 12.9.7. Key Strategic Moves and Developments

    • 12.10. Iridium Communications Inc.

      • 12.10.1. Company Overview

      • 12.10.2. Key Executives

      • 12.10.3. Company Snapshot

      • 12.10.4. Operating Business Segments

      • 12.10.5. Product Portfolio

      • 12.10.6. Business Performance

      • 12.10.7. Key Strategic Moves and Developments

  • LIST OF TABLES

  • TABLE 1. GLOBAL MARINE NAVIGATION AND COMMUNICATION SYSTEM MARKET, BY SYSTEMS, 2022-2032 ($MILLION)
  • TABLE 2. GLOBAL MARINE NAVIGATION AND COMMUNICATION SYSTEM MARKET FOR NAVIGATION, BY REGION, 2022-2032 ($MILLION)
  • TABLE 3. GLOBAL MARINE NAVIGATION AND COMMUNICATION SYSTEM MARKET FOR COMMUNICATION, BY REGION, 2022-2032 ($MILLION)
  • TABLE 4. GLOBAL MARINE NAVIGATION AND COMMUNICATION SYSTEM MARKET, BY TYPE, 2022-2032 ($MILLION)
  • TABLE 5. GLOBAL MARINE NAVIGATION AND COMMUNICATION SYSTEM MARKET FOR ELECTRONIC NAVIGATIONS CHART, BY REGION, 2022-2032 ($MILLION)
  • TABLE 6. GLOBAL MARINE NAVIGATION AND COMMUNICATION SYSTEM MARKET FOR CHART PLOTTER, BY REGION, 2022-2032 ($MILLION)
  • TABLE 7. GLOBAL MARINE NAVIGATION AND COMMUNICATION SYSTEM MARKET, BY PLATFORM, 2022-2032 ($MILLION)
  • TABLE 8. GLOBAL MARINE NAVIGATION AND COMMUNICATION SYSTEM MARKET FOR SUBMARINES, BY REGION, 2022-2032 ($MILLION)
  • TABLE 9. GLOBAL MARINE NAVIGATION AND COMMUNICATION SYSTEM MARKET FOR SURFACE SHIPS, BY REGION, 2022-2032 ($MILLION)
  • TABLE 10. GLOBAL MARINE NAVIGATION AND COMMUNICATION SYSTEM MARKET FOR UNMANNED SYSTEMS, BY REGION, 2022-2032 ($MILLION)
  • TABLE 11. GLOBAL MARINE NAVIGATION AND COMMUNICATION SYSTEM MARKET, BY APPLICATION, 2022-2032 ($MILLION)
  • TABLE 12. GLOBAL MARINE NAVIGATION AND COMMUNICATION SYSTEM MARKET FOR SHIP, BY REGION, 2022-2032 ($MILLION)
  • TABLE 13. GLOBAL MARINE NAVIGATION AND COMMUNICATION SYSTEM MARKET FOR REMOTELY OPERATED UNDERWATER VEHICLE, BY REGION, 2022-2032 ($MILLION)
  • TABLE 14. GLOBAL MARINE NAVIGATION AND COMMUNICATION SYSTEM MARKET FOR AUTONOMOUS UNDERWATER BOAT AND VEHICLES, BY REGION, 2022-2032 ($MILLION)
  • TABLE 15. GLOBAL MARINE NAVIGATION AND COMMUNICATION SYSTEM MARKET, BY END-USE, 2022-2032 ($MILLION)
  • TABLE 16. GLOBAL MARINE NAVIGATION AND COMMUNICATION SYSTEM MARKET FOR DEFENSE, BY REGION, 2022-2032 ($MILLION)
  • TABLE 17. GLOBAL MARINE NAVIGATION AND COMMUNICATION SYSTEM MARKET FOR COMMERCIAL, BY REGION, 2022-2032 ($MILLION)
  • TABLE 18. GLOBAL MARINE NAVIGATION AND COMMUNICATION SYSTEM MARKET, BY INDUSTRY VERTICAL, 2022-2032 ($MILLION)
  • TABLE 19. GLOBAL MARINE NAVIGATION AND COMMUNICATION SYSTEM MARKET FOR MILITARY DEFENSE, BY REGION, 2022-2032 ($MILLION)
  • TABLE 20. GLOBAL MARINE NAVIGATION AND COMMUNICATION SYSTEM MARKET FOR METAL INDUSTRY, BY REGION, 2022-2032 ($MILLION)
  • TABLE 21. GLOBAL MARINE NAVIGATION AND COMMUNICATION SYSTEM MARKET FOR OTHERS, BY REGION, 2022-2032 ($MILLION)
  • TABLE 22. GLOBAL MARINE NAVIGATION AND COMMUNICATION SYSTEM MARKET, BY REGION, 2022-2032 ($MILLION)
  • TABLE 23. NORTH AMERICA MARINE NAVIGATION AND COMMUNICATION SYSTEM, BY REGION, 2022-2032 ($MILLION)
  • TABLE 24. NORTH AMERICA MARINE NAVIGATION AND COMMUNICATION SYSTEM, BY SYSTEMS, 2022-2032 ($MILLION)
  • TABLE 25. NORTH AMERICA MARINE NAVIGATION AND COMMUNICATION SYSTEM, BY TYPE, 2022-2032 ($MILLION)
  • TABLE 26. NORTH AMERICA MARINE NAVIGATION AND COMMUNICATION SYSTEM, BY PLATFORM, 2022-2032 ($MILLION)
  • TABLE 27. NORTH AMERICA MARINE NAVIGATION AND COMMUNICATION SYSTEM, BY APPLICATION, 2022-2032 ($MILLION)
  • TABLE 28. NORTH AMERICA MARINE NAVIGATION AND COMMUNICATION SYSTEM, BY END-USE, 2022-2032 ($MILLION)
  • TABLE 29. NORTH AMERICA MARINE NAVIGATION AND COMMUNICATION SYSTEM, BY INDUSTRY VERTICAL, 2022-2032 ($MILLION)
  • TABLE 30. U.S. MARINE NAVIGATION AND COMMUNICATION SYSTEM, BY SYSTEMS, 2022-2032 ($MILLION)
  • TABLE 31. U.S. MARINE NAVIGATION AND COMMUNICATION SYSTEM, BY TYPE, 2022-2032 ($MILLION)
  • TABLE 32. U.S. MARINE NAVIGATION AND COMMUNICATION SYSTEM, BY PLATFORM, 2022-2032 ($MILLION)
  • TABLE 33. U.S. MARINE NAVIGATION AND COMMUNICATION SYSTEM, BY APPLICATION, 2022-2032 ($MILLION)
  • TABLE 34. U.S. MARINE NAVIGATION AND COMMUNICATION SYSTEM, BY END-USE, 2022-2032 ($MILLION)
  • TABLE 35. U.S. MARINE NAVIGATION AND COMMUNICATION SYSTEM, BY INDUSTRY VERTICAL, 2022-2032 ($MILLION)
  • TABLE 36. CANADA MARINE NAVIGATION AND COMMUNICATION SYSTEM, BY SYSTEMS, 2022-2032 ($MILLION)
  • TABLE 37. CANADA MARINE NAVIGATION AND COMMUNICATION SYSTEM, BY TYPE, 2022-2032 ($MILLION)
  • TABLE 38. CANADA MARINE NAVIGATION AND COMMUNICATION SYSTEM, BY PLATFORM, 2022-2032 ($MILLION)
  • TABLE 39. CANADA MARINE NAVIGATION AND COMMUNICATION SYSTEM, BY APPLICATION, 2022-2032 ($MILLION)
  • TABLE 40. CANADA MARINE NAVIGATION AND COMMUNICATION SYSTEM, BY END-USE, 2022-2032 ($MILLION)
  • TABLE 41. CANADA MARINE NAVIGATION AND COMMUNICATION SYSTEM, BY INDUSTRY VERTICAL, 2022-2032 ($MILLION)
  • TABLE 42. MEXICO MARINE NAVIGATION AND COMMUNICATION SYSTEM, BY SYSTEMS, 2022-2032 ($MILLION)
  • TABLE 43. MEXICO MARINE NAVIGATION AND COMMUNICATION SYSTEM, BY TYPE, 2022-2032 ($MILLION)
  • TABLE 44. MEXICO MARINE NAVIGATION AND COMMUNICATION SYSTEM, BY PLATFORM, 2022-2032 ($MILLION)
  • TABLE 45. MEXICO MARINE NAVIGATION AND COMMUNICATION SYSTEM, BY APPLICATION, 2022-2032 ($MILLION)
  • TABLE 46. MEXICO MARINE NAVIGATION AND COMMUNICATION SYSTEM, BY END-USE, 2022-2032 ($MILLION)
  • TABLE 47. MEXICO MARINE NAVIGATION AND COMMUNICATION SYSTEM, BY INDUSTRY VERTICAL, 2022-2032 ($MILLION)
  • TABLE 48. EUROPE MARINE NAVIGATION AND COMMUNICATION SYSTEM, BY REGION, 2022-2032 ($MILLION)
  • TABLE 49. EUROPE MARINE NAVIGATION AND COMMUNICATION SYSTEM, BY SYSTEMS, 2022-2032 ($MILLION)
  • TABLE 50. EUROPE MARINE NAVIGATION AND COMMUNICATION SYSTEM, BY TYPE, 2022-2032 ($MILLION)
  • TABLE 51. EUROPE MARINE NAVIGATION AND COMMUNICATION SYSTEM, BY PLATFORM, 2022-2032 ($MILLION)
  • TABLE 52. EUROPE MARINE NAVIGATION AND COMMUNICATION SYSTEM, BY APPLICATION, 2022-2032 ($MILLION)
  • TABLE 53. EUROPE MARINE NAVIGATION AND COMMUNICATION SYSTEM, BY END-USE, 2022-2032 ($MILLION)
  • TABLE 54. EUROPE MARINE NAVIGATION AND COMMUNICATION SYSTEM, BY INDUSTRY VERTICAL, 2022-2032 ($MILLION)
  • TABLE 55. FRANCE MARINE NAVIGATION AND COMMUNICATION SYSTEM, BY SYSTEMS, 2022-2032 ($MILLION)
  • TABLE 56. FRANCE MARINE NAVIGATION AND COMMUNICATION SYSTEM, BY TYPE, 2022-2032 ($MILLION)
  • TABLE 57. FRANCE MARINE NAVIGATION AND COMMUNICATION SYSTEM, BY PLATFORM, 2022-2032 ($MILLION)
  • TABLE 58. FRANCE MARINE NAVIGATION AND COMMUNICATION SYSTEM, BY APPLICATION, 2022-2032 ($MILLION)
  • TABLE 59. FRANCE MARINE NAVIGATION AND COMMUNICATION SYSTEM, BY END-USE, 2022-2032 ($MILLION)
  • TABLE 60. FRANCE MARINE NAVIGATION AND COMMUNICATION SYSTEM, BY INDUSTRY VERTICAL, 2022-2032 ($MILLION)
  • TABLE 61. GERMANY MARINE NAVIGATION AND COMMUNICATION SYSTEM, BY SYSTEMS, 2022-2032 ($MILLION)
  • TABLE 62. GERMANY MARINE NAVIGATION AND COMMUNICATION SYSTEM, BY TYPE, 2022-2032 ($MILLION)
  • TABLE 63. GERMANY MARINE NAVIGATION AND COMMUNICATION SYSTEM, BY PLATFORM, 2022-2032 ($MILLION)
  • TABLE 64. GERMANY MARINE NAVIGATION AND COMMUNICATION SYSTEM, BY APPLICATION, 2022-2032 ($MILLION)
  • TABLE 65. GERMANY MARINE NAVIGATION AND COMMUNICATION SYSTEM, BY END-USE, 2022-2032 ($MILLION)
  • TABLE 66. GERMANY MARINE NAVIGATION AND COMMUNICATION SYSTEM, BY INDUSTRY VERTICAL, 2022-2032 ($MILLION)
  • TABLE 67. ITALY MARINE NAVIGATION AND COMMUNICATION SYSTEM, BY SYSTEMS, 2022-2032 ($MILLION)
  • TABLE 68. ITALY MARINE NAVIGATION AND COMMUNICATION SYSTEM, BY TYPE, 2022-2032 ($MILLION)
  • TABLE 69. ITALY MARINE NAVIGATION AND COMMUNICATION SYSTEM, BY PLATFORM, 2022-2032 ($MILLION)
  • TABLE 70. ITALY MARINE NAVIGATION AND COMMUNICATION SYSTEM, BY APPLICATION, 2022-2032 ($MILLION)
  • TABLE 71. ITALY MARINE NAVIGATION AND COMMUNICATION SYSTEM, BY END-USE, 2022-2032 ($MILLION)
  • TABLE 72. ITALY MARINE NAVIGATION AND COMMUNICATION SYSTEM, BY INDUSTRY VERTICAL, 2022-2032 ($MILLION)
  • TABLE 73. SPAIN MARINE NAVIGATION AND COMMUNICATION SYSTEM, BY SYSTEMS, 2022-2032 ($MILLION)
  • TABLE 74. SPAIN MARINE NAVIGATION AND COMMUNICATION SYSTEM, BY TYPE, 2022-2032 ($MILLION)
  • TABLE 75. SPAIN MARINE NAVIGATION AND COMMUNICATION SYSTEM, BY PLATFORM, 2022-2032 ($MILLION)
  • TABLE 76. SPAIN MARINE NAVIGATION AND COMMUNICATION SYSTEM, BY APPLICATION, 2022-2032 ($MILLION)
  • TABLE 77. SPAIN MARINE NAVIGATION AND COMMUNICATION SYSTEM, BY END-USE, 2022-2032 ($MILLION)
  • TABLE 78. SPAIN MARINE NAVIGATION AND COMMUNICATION SYSTEM, BY INDUSTRY VERTICAL, 2022-2032 ($MILLION)
  • TABLE 79. UK MARINE NAVIGATION AND COMMUNICATION SYSTEM, BY SYSTEMS, 2022-2032 ($MILLION)
  • TABLE 80. UK MARINE NAVIGATION AND COMMUNICATION SYSTEM, BY TYPE, 2022-2032 ($MILLION)
  • TABLE 81. UK MARINE NAVIGATION AND COMMUNICATION SYSTEM, BY PLATFORM, 2022-2032 ($MILLION)
  • TABLE 82. UK MARINE NAVIGATION AND COMMUNICATION SYSTEM, BY APPLICATION, 2022-2032 ($MILLION)
  • TABLE 83. UK MARINE NAVIGATION AND COMMUNICATION SYSTEM, BY END-USE, 2022-2032 ($MILLION)
  • TABLE 84. UK MARINE NAVIGATION AND COMMUNICATION SYSTEM, BY INDUSTRY VERTICAL, 2022-2032 ($MILLION)
  • TABLE 85. RUSSIA MARINE NAVIGATION AND COMMUNICATION SYSTEM, BY SYSTEMS, 2022-2032 ($MILLION)
  • TABLE 86. RUSSIA MARINE NAVIGATION AND COMMUNICATION SYSTEM, BY TYPE, 2022-2032 ($MILLION)
  • TABLE 87. RUSSIA MARINE NAVIGATION AND COMMUNICATION SYSTEM, BY PLATFORM, 2022-2032 ($MILLION)
  • TABLE 88. RUSSIA MARINE NAVIGATION AND COMMUNICATION SYSTEM, BY APPLICATION, 2022-2032 ($MILLION)
  • TABLE 89. RUSSIA MARINE NAVIGATION AND COMMUNICATION SYSTEM, BY END-USE, 2022-2032 ($MILLION)
  • TABLE 90. RUSSIA MARINE NAVIGATION AND COMMUNICATION SYSTEM, BY INDUSTRY VERTICAL, 2022-2032 ($MILLION)
  • TABLE 91. REST OF EUROPE MARINE NAVIGATION AND COMMUNICATION SYSTEM, BY SYSTEMS, 2022-2032 ($MILLION)
  • TABLE 92. REST OF EUROPE MARINE NAVIGATION AND COMMUNICATION SYSTEM, BY TYPE, 2022-2032 ($MILLION)
  • TABLE 93. REST OF EUROPE MARINE NAVIGATION AND COMMUNICATION SYSTEM, BY PLATFORM, 2022-2032 ($MILLION)
  • TABLE 94. REST OF EUROPE MARINE NAVIGATION AND COMMUNICATION SYSTEM, BY APPLICATION, 2022-2032 ($MILLION)
  • TABLE 95. REST OF EUROPE MARINE NAVIGATION AND COMMUNICATION SYSTEM, BY END-USE, 2022-2032 ($MILLION)
  • TABLE 96. REST OF EUROPE MARINE NAVIGATION AND COMMUNICATION SYSTEM, BY INDUSTRY VERTICAL, 2022-2032 ($MILLION)
  • TABLE 97. ASIA-PACIFIC MARINE NAVIGATION AND COMMUNICATION SYSTEM, BY REGION, 2022-2032 ($MILLION)
  • TABLE 98. ASIA-PACIFIC MARINE NAVIGATION AND COMMUNICATION SYSTEM, BY SYSTEMS, 2022-2032 ($MILLION)
  • TABLE 99. ASIA-PACIFIC MARINE NAVIGATION AND COMMUNICATION SYSTEM, BY TYPE, 2022-2032 ($MILLION)
  • TABLE 100. ASIA-PACIFIC MARINE NAVIGATION AND COMMUNICATION SYSTEM, BY PLATFORM, 2022-2032 ($MILLION)
  • TABLE 101. ASIA-PACIFIC MARINE NAVIGATION AND COMMUNICATION SYSTEM, BY APPLICATION, 2022-2032 ($MILLION)
  • TABLE 102. ASIA-PACIFIC MARINE NAVIGATION AND COMMUNICATION SYSTEM, BY END-USE, 2022-2032 ($MILLION)
  • TABLE 103. ASIA-PACIFIC MARINE NAVIGATION AND COMMUNICATION SYSTEM, BY INDUSTRY VERTICAL, 2022-2032 ($MILLION)
  • TABLE 104. CHINA MARINE NAVIGATION AND COMMUNICATION SYSTEM, BY SYSTEMS, 2022-2032 ($MILLION)
  • TABLE 105. CHINA MARINE NAVIGATION AND COMMUNICATION SYSTEM, BY TYPE, 2022-2032 ($MILLION)
  • TABLE 106. CHINA MARINE NAVIGATION AND COMMUNICATION SYSTEM, BY PLATFORM, 2022-2032 ($MILLION)
  • TABLE 107. CHINA MARINE NAVIGATION AND COMMUNICATION SYSTEM, BY APPLICATION, 2022-2032 ($MILLION)
  • TABLE 108. CHINA MARINE NAVIGATION AND COMMUNICATION SYSTEM, BY END-USE, 2022-2032 ($MILLION)
  • TABLE 109. CHINA MARINE NAVIGATION AND COMMUNICATION SYSTEM, BY INDUSTRY VERTICAL, 2022-2032 ($MILLION)
  • TABLE 110. JAPAN MARINE NAVIGATION AND COMMUNICATION SYSTEM, BY SYSTEMS, 2022-2032 ($MILLION)
  • TABLE 111. JAPAN MARINE NAVIGATION AND COMMUNICATION SYSTEM, BY TYPE, 2022-2032 ($MILLION)
  • TABLE 112. JAPAN MARINE NAVIGATION AND COMMUNICATION SYSTEM, BY PLATFORM, 2022-2032 ($MILLION)
  • TABLE 113. JAPAN MARINE NAVIGATION AND COMMUNICATION SYSTEM, BY APPLICATION, 2022-2032 ($MILLION)
  • TABLE 114. JAPAN MARINE NAVIGATION AND COMMUNICATION SYSTEM, BY END-USE, 2022-2032 ($MILLION)
  • TABLE 115. JAPAN MARINE NAVIGATION AND COMMUNICATION SYSTEM, BY INDUSTRY VERTICAL, 2022-2032 ($MILLION)
  • TABLE 116. INDIA MARINE NAVIGATION AND COMMUNICATION SYSTEM, BY SYSTEMS, 2022-2032 ($MILLION)
  • TABLE 117. INDIA MARINE NAVIGATION AND COMMUNICATION SYSTEM, BY TYPE, 2022-2032 ($MILLION)
  • TABLE 118. INDIA MARINE NAVIGATION AND COMMUNICATION SYSTEM, BY PLATFORM, 2022-2032 ($MILLION)
  • TABLE 119. INDIA MARINE NAVIGATION AND COMMUNICATION SYSTEM, BY APPLICATION, 2022-2032 ($MILLION)
  • TABLE 120. INDIA MARINE NAVIGATION AND COMMUNICATION SYSTEM, BY END-USE, 2022-2032 ($MILLION)
  • TABLE 121. INDIA MARINE NAVIGATION AND COMMUNICATION SYSTEM, BY INDUSTRY VERTICAL, 2022-2032 ($MILLION)
  • TABLE 122. SOUTH KOREA MARINE NAVIGATION AND COMMUNICATION SYSTEM, BY SYSTEMS, 2022-2032 ($MILLION)
  • TABLE 123. SOUTH KOREA MARINE NAVIGATION AND COMMUNICATION SYSTEM, BY TYPE, 2022-2032 ($MILLION)
  • TABLE 124. SOUTH KOREA MARINE NAVIGATION AND COMMUNICATION SYSTEM, BY PLATFORM, 2022-2032 ($MILLION)
  • TABLE 125. SOUTH KOREA MARINE NAVIGATION AND COMMUNICATION SYSTEM, BY APPLICATION, 2022-2032 ($MILLION)
  • TABLE 126. SOUTH KOREA MARINE NAVIGATION AND COMMUNICATION SYSTEM, BY END-USE, 2022-2032 ($MILLION)
  • TABLE 127. SOUTH KOREA MARINE NAVIGATION AND COMMUNICATION SYSTEM, BY INDUSTRY VERTICAL, 2022-2032 ($MILLION)
  • TABLE 128. AUSTRALIA MARINE NAVIGATION AND COMMUNICATION SYSTEM, BY SYSTEMS, 2022-2032 ($MILLION)
  • TABLE 129. AUSTRALIA MARINE NAVIGATION AND COMMUNICATION SYSTEM, BY TYPE, 2022-2032 ($MILLION)
  • TABLE 130. AUSTRALIA MARINE NAVIGATION AND COMMUNICATION SYSTEM, BY PLATFORM, 2022-2032 ($MILLION)
  • TABLE 131. AUSTRALIA MARINE NAVIGATION AND COMMUNICATION SYSTEM, BY APPLICATION, 2022-2032 ($MILLION)
  • TABLE 132. AUSTRALIA MARINE NAVIGATION AND COMMUNICATION SYSTEM, BY END-USE, 2022-2032 ($MILLION)
  • TABLE 133. AUSTRALIA MARINE NAVIGATION AND COMMUNICATION SYSTEM, BY INDUSTRY VERTICAL, 2022-2032 ($MILLION)
  • TABLE 134. THAILAND MARINE NAVIGATION AND COMMUNICATION SYSTEM, BY SYSTEMS, 2022-2032 ($MILLION)
  • TABLE 135. THAILAND MARINE NAVIGATION AND COMMUNICATION SYSTEM, BY TYPE, 2022-2032 ($MILLION)
  • TABLE 136. THAILAND MARINE NAVIGATION AND COMMUNICATION SYSTEM, BY PLATFORM, 2022-2032 ($MILLION)
  • TABLE 137. THAILAND MARINE NAVIGATION AND COMMUNICATION SYSTEM, BY APPLICATION, 2022-2032 ($MILLION)
  • TABLE 138. THAILAND MARINE NAVIGATION AND COMMUNICATION SYSTEM, BY END-USE, 2022-2032 ($MILLION)
  • TABLE 139. THAILAND MARINE NAVIGATION AND COMMUNICATION SYSTEM, BY INDUSTRY VERTICAL, 2022-2032 ($MILLION)
  • TABLE 140. MALAYSIA MARINE NAVIGATION AND COMMUNICATION SYSTEM, BY SYSTEMS, 2022-2032 ($MILLION)
  • TABLE 141. MALAYSIA MARINE NAVIGATION AND COMMUNICATION SYSTEM, BY TYPE, 2022-2032 ($MILLION)
  • TABLE 142. MALAYSIA MARINE NAVIGATION AND COMMUNICATION SYSTEM, BY PLATFORM, 2022-2032 ($MILLION)
  • TABLE 143. MALAYSIA MARINE NAVIGATION AND COMMUNICATION SYSTEM, BY APPLICATION, 2022-2032 ($MILLION)
  • TABLE 144. MALAYSIA MARINE NAVIGATION AND COMMUNICATION SYSTEM, BY END-USE, 2022-2032 ($MILLION)
  • TABLE 145. MALAYSIA MARINE NAVIGATION AND COMMUNICATION SYSTEM, BY INDUSTRY VERTICAL, 2022-2032 ($MILLION)
  • TABLE 146. INDONESIA MARINE NAVIGATION AND COMMUNICATION SYSTEM, BY SYSTEMS, 2022-2032 ($MILLION)
  • TABLE 147. INDONESIA MARINE NAVIGATION AND COMMUNICATION SYSTEM, BY TYPE, 2022-2032 ($MILLION)
  • TABLE 148. INDONESIA MARINE NAVIGATION AND COMMUNICATION SYSTEM, BY PLATFORM, 2022-2032 ($MILLION)
  • TABLE 149. INDONESIA MARINE NAVIGATION AND COMMUNICATION SYSTEM, BY APPLICATION, 2022-2032 ($MILLION)
  • TABLE 150. INDONESIA MARINE NAVIGATION AND COMMUNICATION SYSTEM, BY END-USE, 2022-2032 ($MILLION)
  • TABLE 151. INDONESIA MARINE NAVIGATION AND COMMUNICATION SYSTEM, BY INDUSTRY VERTICAL, 2022-2032 ($MILLION)
  • TABLE 152. REST OF ASIA PACIFIC MARINE NAVIGATION AND COMMUNICATION SYSTEM, BY SYSTEMS, 2022-2032 ($MILLION)
  • TABLE 153. REST OF ASIA PACIFIC MARINE NAVIGATION AND COMMUNICATION SYSTEM, BY TYPE, 2022-2032 ($MILLION)
  • TABLE 154. REST OF ASIA PACIFIC MARINE NAVIGATION AND COMMUNICATION SYSTEM, BY PLATFORM, 2022-2032 ($MILLION)
  • TABLE 155. REST OF ASIA PACIFIC MARINE NAVIGATION AND COMMUNICATION SYSTEM, BY APPLICATION, 2022-2032 ($MILLION)
  • TABLE 156. REST OF ASIA PACIFIC MARINE NAVIGATION AND COMMUNICATION SYSTEM, BY END-USE, 2022-2032 ($MILLION)
  • TABLE 157. REST OF ASIA PACIFIC MARINE NAVIGATION AND COMMUNICATION SYSTEM, BY INDUSTRY VERTICAL, 2022-2032 ($MILLION)
  • TABLE 158. LAMEA MARINE NAVIGATION AND COMMUNICATION SYSTEM, BY REGION, 2022-2032 ($MILLION)
  • TABLE 159. LAMEA MARINE NAVIGATION AND COMMUNICATION SYSTEM, BY SYSTEMS, 2022-2032 ($MILLION)
  • TABLE 160. LAMEA MARINE NAVIGATION AND COMMUNICATION SYSTEM, BY TYPE, 2022-2032 ($MILLION)
  • TABLE 161. LAMEA MARINE NAVIGATION AND COMMUNICATION SYSTEM, BY PLATFORM, 2022-2032 ($MILLION)
  • TABLE 162. LAMEA MARINE NAVIGATION AND COMMUNICATION SYSTEM, BY APPLICATION, 2022-2032 ($MILLION)
  • TABLE 163. LAMEA MARINE NAVIGATION AND COMMUNICATION SYSTEM, BY END-USE, 2022-2032 ($MILLION)
  • TABLE 164. LAMEA MARINE NAVIGATION AND COMMUNICATION SYSTEM, BY INDUSTRY VERTICAL, 2022-2032 ($MILLION)
  • TABLE 165. BRAZIL MARINE NAVIGATION AND COMMUNICATION SYSTEM, BY SYSTEMS, 2022-2032 ($MILLION)
  • TABLE 166. BRAZIL MARINE NAVIGATION AND COMMUNICATION SYSTEM, BY TYPE, 2022-2032 ($MILLION)
  • TABLE 167. BRAZIL MARINE NAVIGATION AND COMMUNICATION SYSTEM, BY PLATFORM, 2022-2032 ($MILLION)
  • TABLE 168. BRAZIL MARINE NAVIGATION AND COMMUNICATION SYSTEM, BY APPLICATION, 2022-2032 ($MILLION)
  • TABLE 169. BRAZIL MARINE NAVIGATION AND COMMUNICATION SYSTEM, BY END-USE, 2022-2032 ($MILLION)
  • TABLE 170. BRAZIL MARINE NAVIGATION AND COMMUNICATION SYSTEM, BY INDUSTRY VERTICAL, 2022-2032 ($MILLION)
  • TABLE 171. SOUTH AFRICA MARINE NAVIGATION AND COMMUNICATION SYSTEM, BY SYSTEMS, 2022-2032 ($MILLION)
  • TABLE 172. SOUTH AFRICA MARINE NAVIGATION AND COMMUNICATION SYSTEM, BY TYPE, 2022-2032 ($MILLION)
  • TABLE 173. SOUTH AFRICA MARINE NAVIGATION AND COMMUNICATION SYSTEM, BY PLATFORM, 2022-2032 ($MILLION)
  • TABLE 174. SOUTH AFRICA MARINE NAVIGATION AND COMMUNICATION SYSTEM, BY APPLICATION, 2022-2032 ($MILLION)
  • TABLE 175. SOUTH AFRICA MARINE NAVIGATION AND COMMUNICATION SYSTEM, BY END-USE, 2022-2032 ($MILLION)
  • TABLE 176. SOUTH AFRICA MARINE NAVIGATION AND COMMUNICATION SYSTEM, BY INDUSTRY VERTICAL, 2022-2032 ($MILLION)
  • TABLE 177. SAUDI ARABIA MARINE NAVIGATION AND COMMUNICATION SYSTEM, BY SYSTEMS, 2022-2032 ($MILLION)
  • TABLE 178. SAUDI ARABIA MARINE NAVIGATION AND COMMUNICATION SYSTEM, BY TYPE, 2022-2032 ($MILLION)
  • TABLE 179. SAUDI ARABIA MARINE NAVIGATION AND COMMUNICATION SYSTEM, BY PLATFORM, 2022-2032 ($MILLION)
  • TABLE 180. SAUDI ARABIA MARINE NAVIGATION AND COMMUNICATION SYSTEM, BY APPLICATION, 2022-2032 ($MILLION)
  • TABLE 181. SAUDI ARABIA MARINE NAVIGATION AND COMMUNICATION SYSTEM, BY END-USE, 2022-2032 ($MILLION)
  • TABLE 182. SAUDI ARABIA MARINE NAVIGATION AND COMMUNICATION SYSTEM, BY INDUSTRY VERTICAL, 2022-2032 ($MILLION)
  • TABLE 183. UAE MARINE NAVIGATION AND COMMUNICATION SYSTEM, BY SYSTEMS, 2022-2032 ($MILLION)
  • TABLE 184. UAE MARINE NAVIGATION AND COMMUNICATION SYSTEM, BY TYPE, 2022-2032 ($MILLION)
  • TABLE 185. UAE MARINE NAVIGATION AND COMMUNICATION SYSTEM, BY PLATFORM, 2022-2032 ($MILLION)
  • TABLE 186. UAE MARINE NAVIGATION AND COMMUNICATION SYSTEM, BY APPLICATION, 2022-2032 ($MILLION)
  • TABLE 187. UAE MARINE NAVIGATION AND COMMUNICATION SYSTEM, BY END-USE, 2022-2032 ($MILLION)
  • TABLE 188. UAE MARINE NAVIGATION AND COMMUNICATION SYSTEM, BY INDUSTRY VERTICAL, 2022-2032 ($MILLION)
  • TABLE 189. ARGENTINA MARINE NAVIGATION AND COMMUNICATION SYSTEM, BY SYSTEMS, 2022-2032 ($MILLION)
  • TABLE 190. ARGENTINA MARINE NAVIGATION AND COMMUNICATION SYSTEM, BY TYPE, 2022-2032 ($MILLION)
  • TABLE 191. ARGENTINA MARINE NAVIGATION AND COMMUNICATION SYSTEM, BY PLATFORM, 2022-2032 ($MILLION)
  • TABLE 192. ARGENTINA MARINE NAVIGATION AND COMMUNICATION SYSTEM, BY APPLICATION, 2022-2032 ($MILLION)
  • TABLE 193. ARGENTINA MARINE NAVIGATION AND COMMUNICATION SYSTEM, BY END-USE, 2022-2032 ($MILLION)
  • TABLE 194. ARGENTINA MARINE NAVIGATION AND COMMUNICATION SYSTEM, BY INDUSTRY VERTICAL, 2022-2032 ($MILLION)
  • TABLE 195. REST OF LAMEA MARINE NAVIGATION AND COMMUNICATION SYSTEM, BY SYSTEMS, 2022-2032 ($MILLION)
  • TABLE 196. REST OF LAMEA MARINE NAVIGATION AND COMMUNICATION SYSTEM, BY TYPE, 2022-2032 ($MILLION)
  • TABLE 197. REST OF LAMEA MARINE NAVIGATION AND COMMUNICATION SYSTEM, BY PLATFORM, 2022-2032 ($MILLION)
  • TABLE 198. REST OF LAMEA MARINE NAVIGATION AND COMMUNICATION SYSTEM, BY APPLICATION, 2022-2032 ($MILLION)
  • TABLE 199. REST OF LAMEA MARINE NAVIGATION AND COMMUNICATION SYSTEM, BY END-USE, 2022-2032 ($MILLION)
  • TABLE 200. REST OF LAMEA MARINE NAVIGATION AND COMMUNICATION SYSTEM, BY INDUSTRY VERTICAL, 2022-2032 ($MILLION)
  • TABLE 201. NORTHROP GRUMMAN CORPORATION: KEY EXECUTIVES
  • TABLE 202. NORTHROP GRUMMAN CORPORATION: COMPANY SNAPSHOT
  • TABLE 203. NORTHROP GRUMMAN CORPORATION: OPERATING SEGMENTS
  • TABLE 204. NORTHROP GRUMMAN CORPORATION: PRODUCT PORTFOLIO
  • TABLE 205. NORTHROP GRUMMAN CORPORATION: KEY STRATEGIC MOVES AND DEVELOPMENTS
  • TABLE 206. HONEYWELL INTERNATIONAL INC.: KEY EXECUTIVES
  • TABLE 207. HONEYWELL INTERNATIONAL INC.: COMPANY SNAPSHOT
  • TABLE 208. HONEYWELL INTERNATIONAL INC.: OPERATING SEGMENTS
  • TABLE 209. HONEYWELL INTERNATIONAL INC.: PRODUCT PORTFOLIO
  • TABLE 210. HONEYWELL INTERNATIONAL INC.: KEY STRATEGIC MOVES AND DEVELOPMENTS
  • TABLE 211. SAFRAN SA: KEY EXECUTIVES
  • TABLE 212. SAFRAN SA: COMPANY SNAPSHOT
  • TABLE 213. SAFRAN SA: OPERATING SEGMENTS
  • TABLE 214. SAFRAN SA: PRODUCT PORTFOLIO
  • TABLE 215. SAFRAN SA: KEY STRATEGIC MOVES AND DEVELOPMENTS
  • TABLE 216. THALES GROUP: KEY EXECUTIVES
  • TABLE 217. THALES GROUP: COMPANY SNAPSHOT
  • TABLE 218. THALES GROUP: OPERATING SEGMENTS
  • TABLE 219. THALES GROUP: PRODUCT PORTFOLIO
  • TABLE 220. THALES GROUP: KEY STRATEGIC MOVES AND DEVELOPMENTS
  • TABLE 221. FLIR SYSTEMS INC.: KEY EXECUTIVES
  • TABLE 222. FLIR SYSTEMS INC.: COMPANY SNAPSHOT
  • TABLE 223. FLIR SYSTEMS INC.: OPERATING SEGMENTS
  • TABLE 224. FLIR SYSTEMS INC.: PRODUCT PORTFOLIO
  • TABLE 225. FLIR SYSTEMS INC.: KEY STRATEGIC MOVES AND DEVELOPMENTS
  • TABLE 226. HUGHES NETWORK SYSTEMS LLC: KEY EXECUTIVES
  • TABLE 227. HUGHES NETWORK SYSTEMS LLC: COMPANY SNAPSHOT
  • TABLE 228. HUGHES NETWORK SYSTEMS LLC: OPERATING SEGMENTS
  • TABLE 229. HUGHES NETWORK SYSTEMS LLC: PRODUCT PORTFOLIO
  • TABLE 230. HUGHES NETWORK SYSTEMS LLC: KEY STRATEGIC MOVES AND DEVELOPMENTS
  • TABLE 231. INMARSAT GROUP LIMITED: KEY EXECUTIVES
  • TABLE 232. INMARSAT GROUP LIMITED: COMPANY SNAPSHOT
  • TABLE 233. INMARSAT GROUP LIMITED: OPERATING SEGMENTS
  • TABLE 234. INMARSAT GROUP LIMITED: PRODUCT PORTFOLIO
  • TABLE 235. INMARSAT GROUP LIMITED: KEY STRATEGIC MOVES AND DEVELOPMENTS
  • TABLE 236. THURAVA TELECOMMUNICATIONS COMPANY: KEY EXECUTIVES
  • TABLE 237. THURAVA TELECOMMUNICATIONS COMPANY: COMPANY SNAPSHOT
  • TABLE 238. THURAVA TELECOMMUNICATIONS COMPANY: OPERATING SEGMENTS
  • TABLE 239. THURAVA TELECOMMUNICATIONS COMPANY: PRODUCT PORTFOLIO
  • TABLE 240. THURAVA TELECOMMUNICATIONS COMPANY: KEY STRATEGIC MOVES AND DEVELOPMENTS
  • TABLE 241. NETWORK INNOVATION INC.: KEY EXECUTIVES
  • TABLE 242. NETWORK INNOVATION INC.: COMPANY SNAPSHOT
  • TABLE 243. NETWORK INNOVATION INC.: OPERATING SEGMENTS
  • TABLE 244. NETWORK INNOVATION INC.: PRODUCT PORTFOLIO
  • TABLE 245. NETWORK INNOVATION INC.: KEY STRATEGIC MOVES AND DEVELOPMENTS
  • TABLE 246. IRIDIUM COMMUNICATIONS INC.: KEY EXECUTIVES
  • TABLE 247. IRIDIUM COMMUNICATIONS INC.: COMPANY SNAPSHOT
  • TABLE 248. IRIDIUM COMMUNICATIONS INC.: OPERATING SEGMENTS
  • TABLE 249. IRIDIUM COMMUNICATIONS INC.: PRODUCT PORTFOLIO
  • TABLE 250. IRIDIUM COMMUNICATIONS INC.: KEY STRATEGIC MOVES AND DEVELOPMENTS
  • LIST OF FIGURES

  • FIGURE 1. GLOBAL MARINE NAVIGATION AND COMMUNICATION SYSTEM MARKET SEGMENTATION
  • FIGURE 2. GLOBAL MARINE NAVIGATION AND COMMUNICATION SYSTEM MARKET
  • FIGURE 3. SEGMENTATION MARINE NAVIGATION AND COMMUNICATION SYSTEM MARKET
  • FIGURE 4. TOP INVESTMENT POCKET IN MARINE NAVIGATION AND COMMUNICATION SYSTEM MARKET
  • FIGURE 5. MODERATE BARGAINING POWER OF BUYERS
  • FIGURE 6. MODERATE BARGAINING POWER OF SUPPLIERS
  • FIGURE 7. MODERATE THREAT OF NEW ENTRANTS
  • FIGURE 8. LOW THREAT OF SUBSTITUTION
  • FIGURE 9. HIGH COMPETITIVE RIVALRY
  • FIGURE 10. OPPORTUNITIES, RESTRAINTS AND DRIVERS: GLOBALMARINE NAVIGATION AND COMMUNICATION SYSTEM MARKET
  • FIGURE 11. MARINE NAVIGATION AND COMMUNICATION SYSTEM MARKET SEGMENTATION, BY BY SYSTEMS
  • FIGURE 12. MARINE NAVIGATION AND COMMUNICATION SYSTEM MARKET FOR NAVIGATION, BY COUNTRY, 2022-2032 ($MILLION)
  • FIGURE 13. MARINE NAVIGATION AND COMMUNICATION SYSTEM MARKET FOR COMMUNICATION, BY COUNTRY, 2022-2032 ($MILLION)
  • FIGURE 14. MARINE NAVIGATION AND COMMUNICATION SYSTEM MARKET SEGMENTATION, BY BY TYPE
  • FIGURE 15. MARINE NAVIGATION AND COMMUNICATION SYSTEM MARKET FOR ELECTRONIC NAVIGATIONS CHART, BY COUNTRY, 2022-2032 ($MILLION)
  • FIGURE 16. MARINE NAVIGATION AND COMMUNICATION SYSTEM MARKET FOR CHART PLOTTER, BY COUNTRY, 2022-2032 ($MILLION)
  • FIGURE 17. MARINE NAVIGATION AND COMMUNICATION SYSTEM MARKET SEGMENTATION, BY BY PLATFORM
  • FIGURE 18. MARINE NAVIGATION AND COMMUNICATION SYSTEM MARKET FOR SUBMARINES, BY COUNTRY, 2022-2032 ($MILLION)
  • FIGURE 19. MARINE NAVIGATION AND COMMUNICATION SYSTEM MARKET FOR SURFACE SHIPS, BY COUNTRY, 2022-2032 ($MILLION)
  • FIGURE 20. MARINE NAVIGATION AND COMMUNICATION SYSTEM MARKET FOR UNMANNED SYSTEMS, BY COUNTRY, 2022-2032 ($MILLION)
  • FIGURE 21. MARINE NAVIGATION AND COMMUNICATION SYSTEM MARKET SEGMENTATION, BY BY APPLICATION
  • FIGURE 22. MARINE NAVIGATION AND COMMUNICATION SYSTEM MARKET FOR SHIP, BY COUNTRY, 2022-2032 ($MILLION)
  • FIGURE 23. MARINE NAVIGATION AND COMMUNICATION SYSTEM MARKET FOR REMOTELY OPERATED UNDERWATER VEHICLE, BY COUNTRY, 2022-2032 ($MILLION)
  • FIGURE 24. MARINE NAVIGATION AND COMMUNICATION SYSTEM MARKET FOR AUTONOMOUS UNDERWATER BOAT AND VEHICLES, BY COUNTRY, 2022-2032 ($MILLION)
  • FIGURE 25. MARINE NAVIGATION AND COMMUNICATION SYSTEM MARKET SEGMENTATION, BY BY END-USE
  • FIGURE 26. MARINE NAVIGATION AND COMMUNICATION SYSTEM MARKET FOR DEFENSE, BY COUNTRY, 2022-2032 ($MILLION)
  • FIGURE 27. MARINE NAVIGATION AND COMMUNICATION SYSTEM MARKET FOR COMMERCIAL, BY COUNTRY, 2022-2032 ($MILLION)
  • FIGURE 28. MARINE NAVIGATION AND COMMUNICATION SYSTEM MARKET SEGMENTATION, BY BY INDUSTRY VERTICAL
  • FIGURE 29. MARINE NAVIGATION AND COMMUNICATION SYSTEM MARKET FOR MILITARY DEFENSE, BY COUNTRY, 2022-2032 ($MILLION)
  • FIGURE 30. MARINE NAVIGATION AND COMMUNICATION SYSTEM MARKET FOR METAL INDUSTRY, BY COUNTRY, 2022-2032 ($MILLION)
  • FIGURE 31. MARINE NAVIGATION AND COMMUNICATION SYSTEM MARKET FOR OTHERS, BY COUNTRY, 2022-2032 ($MILLION)
  • FIGURE 32. TOP WINNING STRATEGIES, BY YEAR, 2020-2022*
  • FIGURE 33. TOP WINNING STRATEGIES, BY DEVELOPMENT, 2020-2022*
  • FIGURE 34. TOP WINNING STRATEGIES, BY COMPANY, 2020-2022*
  • FIGURE 35. PRODUCT MAPPING OF TOP 10 PLAYERS
  • FIGURE 36. COMPETITIVE DASHBOARD
  • FIGURE 37. COMPETITIVE HEATMAP: MARINE NAVIGATION AND COMMUNICATION SYSTEM MARKET
  • FIGURE 38. Top player positioning, 2022
  • FIGURE 39. NORTHROP GRUMMAN CORPORATION: NET SALES, 2020-2022 ($MILLION)
  • FIGURE 40. NORTHROP GRUMMAN CORPORATION: REVENUE SHARE, BY SEGMENT, 2032 (%)
  • FIGURE 41. NORTHROP GRUMMAN CORPORATION: REVENUE SHARE, BY REGION, 2032 (%)
  • FIGURE 42. HONEYWELL INTERNATIONAL INC.: NET SALES, 2020-2022 ($MILLION)
  • FIGURE 43. HONEYWELL INTERNATIONAL INC.: REVENUE SHARE, BY SEGMENT, 2032 (%)
  • FIGURE 44. HONEYWELL INTERNATIONAL INC.: REVENUE SHARE, BY REGION, 2032 (%)
  • FIGURE 45. SAFRAN SA: NET SALES, 2020-2022 ($MILLION)
  • FIGURE 46. SAFRAN SA: REVENUE SHARE, BY SEGMENT, 2032 (%)
  • FIGURE 47. SAFRAN SA: REVENUE SHARE, BY REGION, 2032 (%)
  • FIGURE 48. THALES GROUP: NET SALES, 2020-2022 ($MILLION)
  • FIGURE 49. THALES GROUP: REVENUE SHARE, BY SEGMENT, 2032 (%)
  • FIGURE 50. THALES GROUP: REVENUE SHARE, BY REGION, 2032 (%)
  • FIGURE 51. FLIR SYSTEMS INC.: NET SALES, 2020-2022 ($MILLION)
  • FIGURE 52. FLIR SYSTEMS INC.: REVENUE SHARE, BY SEGMENT, 2032 (%)
  • FIGURE 53. FLIR SYSTEMS INC.: REVENUE SHARE, BY REGION, 2032 (%)
  • FIGURE 54. HUGHES NETWORK SYSTEMS LLC: NET SALES, 2020-2022 ($MILLION)
  • FIGURE 55. HUGHES NETWORK SYSTEMS LLC: REVENUE SHARE, BY SEGMENT, 2032 (%)
  • FIGURE 56. HUGHES NETWORK SYSTEMS LLC: REVENUE SHARE, BY REGION, 2032 (%)
  • FIGURE 57. INMARSAT GROUP LIMITED: NET SALES, 2020-2022 ($MILLION)
  • FIGURE 58. INMARSAT GROUP LIMITED: REVENUE SHARE, BY SEGMENT, 2032 (%)
  • FIGURE 59. INMARSAT GROUP LIMITED: REVENUE SHARE, BY REGION, 2032 (%)
  • FIGURE 60. THURAVA TELECOMMUNICATIONS COMPANY: NET SALES, 2020-2022 ($MILLION)
  • FIGURE 61. THURAVA TELECOMMUNICATIONS COMPANY: REVENUE SHARE, BY SEGMENT, 2032 (%)
  • FIGURE 62. THURAVA TELECOMMUNICATIONS COMPANY: REVENUE SHARE, BY REGION, 2032 (%)
  • FIGURE 63. NETWORK INNOVATION INC.: NET SALES, 2020-2022 ($MILLION)
  • FIGURE 64. NETWORK INNOVATION INC.: REVENUE SHARE, BY SEGMENT, 2032 (%)
  • FIGURE 65. NETWORK INNOVATION INC.: REVENUE SHARE, BY REGION, 2032 (%)
  • FIGURE 66. IRIDIUM COMMUNICATIONS INC.: NET SALES, 2020-2022 ($MILLION)
  • FIGURE 67. IRIDIUM COMMUNICATIONS INC.: REVENUE SHARE, BY SEGMENT, 2032 (%)
  • FIGURE 68. IRIDIUM COMMUNICATIONS INC.: REVENUE SHARE, BY REGION, 2032 (%)


With collective industry experience of about 200 years of its analysts and experts, Allied Market Research (AMR) encompasses most infallible research methodology for its market intelligence and industry analysis. We do not only engrave the deepest levels of markets but also sneak through its slimmest details for the purpose of our market estimates and forecasts. Our approach helps in building greater market consensus view for size, shape and industry trends within each industry segment. We carefully factor in industry trends and real developments for identifying key growth factors and future course of the market. Our research proceeds are the resultant of high quality data, expert views and analysis and high value independent opinions. Our research process is designed to deliver balanced view of the global markets and allow stakeholders to make informed decisions.

We offer our clients exhaustive research and analysis based on wide variety of factual inputs, which largely include interviews with industry participants, reliable statistics and regional intelligence. Our in-house industry experts play instrumental role in designing analytic tools and models, tailored to the requirements of particular industry segment. These analytical tools and models sanitize the data & statistics and enhance the accuracy of our recommendations and advice. With AMR’s calibrated research process and 360` degree data-evaluation methodology, our clients are assured of receiving:

  • Consistent, valuable, robust and actionable data & analysis that can easily be referenced for strategic business planning
  • Technologically sophisticated and reliable insights through well audited and veracious research methodology
  • Sovereign research proceeds that present a tangible depiction of marketplace


With a strong methodology we are, therefore, confident that our research and analysis are most reliable and guarantees sound business planning.

Secondary research
We refer a broad array of industry sources for our secondary, which typically include; however, not limited to: Company SEC filings, annual reports, company websites, broker & financial reports and investor presentations for competitive scenario and shape of the industry

  • Patent and regulatory databases for understanding of technical & legal developments
  • Scientific and technical writings for product information and related preemptions
  • Regional government and statistical databases for macro analysis
  • Authentic new articles, web-casts and other related releases for market evaluation
  • Internal and external proprietary databases, key market indicators and relevant press releases for market estimates and forecast


Primary research
Our primary research efforts include reaching out participants through mail, tele-conversations, referrals, professional networks and face-to-face interactions. We are also in professional corporate relations with various companies that allow us greater flexibility for reaching out industry participants and commentators for interviews and discussions, fulfilling following functions:

  • Validates and improves the data quality and strengthens research proceeds
  • Further develops analyst team’s market understanding and expertise
  • Supplies authentic information about market size, share, growth and forecasts


Our primary research interview and discussion panels are typically composed of most experienced industry members. These participants include; however, not limited to:

  • Chief executives and VPs of leading corporations specific to industry
  • Product and sales managers or country heads; channel partners and top level distributors; banking, investments and valuation experts Key opinion leaders (KOLs)


Analyst tools and models
AMR has developed set of analyst tools and data models to supplement and expedite the analysis process. Corresponding to markets, where there is significant lack of information and estimates, AMR’s team of experts and analyst develop specific analyst tools and industry models to translate qualitative and quantitative industry indicators into exact industry estimates. These models also allow analysts to examine the prospects and opportunities prevailing in the market to accurately forecast the course of the market.

PURCHASE OPTIONS

Call or Email us

U.S.-Canada Toll-free: +1-800-792-5285
Int'l : +1-503-894-6022
Europe : +44-845-528-1300
Email : help@alliedmarketresearch.com

Looking for Customization?

 Customization Request

Have a Question?

 Speak with Analyst

Any Confusion?

 Inquire Before Buying

Have a glance of the Report

  Enquiry Now

Purchase Full Report of
Marine Navigation And Communication System Market

Start reading.
This Report and over 66,905+ more Reports, Available with Avenue Library. T&C*.

  • Online Only
  • $3,690
  • Online cloud access only
  • Restricted print, copy, paste & download
  • Read only
  • Free industry update
    (Within 180 days)
  • Free report update in next update cycle
  • Data Pack
  • $3,840
  • Restricted to one authorized user
  • One print only
  • Available in
    Excel
  • Free industry update
    (Within 180 days)
  •   Free report update in next update cycle
  • Single User
  • $5,820
  • Restricted to one authorized user
  • One print only
  • Available in
    PDF
  • Free industry update
    (Within 180 days)
  •   Free report update in next update cycle
  • Five Users
  • $6,540
  • Limited to five authorized users
  • Print upto five copies
  • Available in
    PDF
  • Free industry update
    (Within 180 days)
  •   Free report update in next update cycle
  • Enterprise
    License/PDF

  • $9,870
  • Unlimited
    within
    company/enterprise
  • Available in Excel & PDF
  • Free industry update
    (Within 180 days)
  •   Free report update in next update cycle
  • Library
    Membership

  • $999 $ 1,175
    Per User/ Per month/ Billed annually
  • Published Content
    E-access
  • Company Profiles
    E-access
  • Newly Added Content Access
  • 10 PDF
    Downloads
  • 5 Excel Data
    Pack Downloads
  • 250 Company Profiles PDF Downloads
  • Buy Now

*Taxes/Fees, if applicable will be added during checkout. All prices in USD

RELATED REPORTS
 

Why Allied Market Research?


Infallible Methodology

To ensure high-level data integrity, accurate analysis, and impeccable forecasts

Analyst Support

For complete satisfaction

Customization

On-demand customization of scope of the report to exactly meet your needs

TARGETED MARKET VIEW

Targeted market view to provide pertinent information and save time of readers

Get fresh content delivered

Get insights on topics that are crucial for your business. Stay abreast of your interest areas.

Get Industry Data Alerts

Why Allied Market Research?

Infallible Methodology

To ensure high-level data integrity, accurate analysis, and impeccable forecasts

Analyst Support

For complete satisfaction

Customization

On-demand customization of scope of the report to exactly meet your needs

TARGETED MARKET VIEW

Targeted market view to provide pertinent information and save time of readers