Report Code: A01542 | Jan 2017 | Pages: 180 | ||
Tables: 46 | Charts: 65 |
|
Pandemic disrupted the entire world and affected many industries.
Get detailed COVID-19 impact analysis on the Marine Propulsion Engine Market
Request Now !Global marine propulsion engine market is expected to reach $12 billion by 2022, growing at a CAGR of 4.1% from 2016 to 2022. Marine propulsion engines is a machine that burn fuel to create thrust, which helps ships to move across water. The marine propulsion engine market is expected to witness robust growth during the forecast period owing to various ongoing government investments in shipbuilding industry and inland waterways. Ships are integrated with one or more than one propulsion engines, depending on their size (gross tonnage). Moreover, in the early stage of marine propulsion, steam turbines were used; however, due to advancement in technology, diesel or alternative fuel engine and gas turbine have greater penetration.
Market Segmentation
Marine propulsion engines are specifically engineered to withstand the harsh conditions encountered at sea, including high levels of vibration, corrosive environments, and prolonged operation under load. They are designed to be durable, reliable, and capable of delivering high power outputs over extended periods. Moreover, the marine propulsion engine market is highly competitive and consists of several global & regional players. Prominent companies in the industry employ various strategies to improve engine efficiency, reduce emissions, and comply with stringent environmental regulations, thereby further boosting the demand for the marine propulsion engine. For instance, in January 2023, Garden Reach Shipbuilders and Engineers (GRSE) partnered with Rolls Royce Solutions of Germany for manufacture of high-quality marine diesel engines. These engines generate a power output of 746-4300 kilowatts (KW) and are known to be reliable, compact, and simple to maintain.
Rise in international seaborne trade is a primary driver that fuels the growth of the marine engine propulsion market. Further, need for larger vessels, opening of new trade routes, retrofitting requirements, and emphasis on sustainability collectively contribute to the growth of the market. Engine manufacturers and suppliers must continue to innovate & develop efficient & environmentally friendly propulsion solutions to meet the evolving demand from the global trade industry.
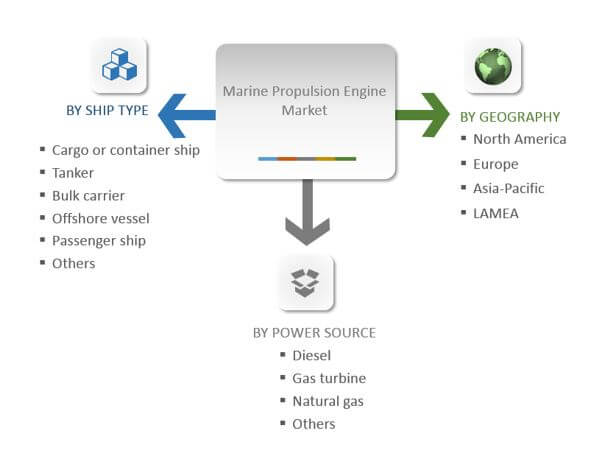
The market segmentation is based on power source, ship types, and geography. The power source segment is divided into diesel, gas turbine, natural gas, and others (steam turbine, renewable energy, hybrid, and fuel cell). By ship types, the market is categorized into cargo & container, tanker, bulk carrier, offshore vessel, passenger ship, and others (tugs & service ships). Geographically, the market is analyzed across North America, Europe, Asia-Pacific, and LAMEA.
Market Dynamics
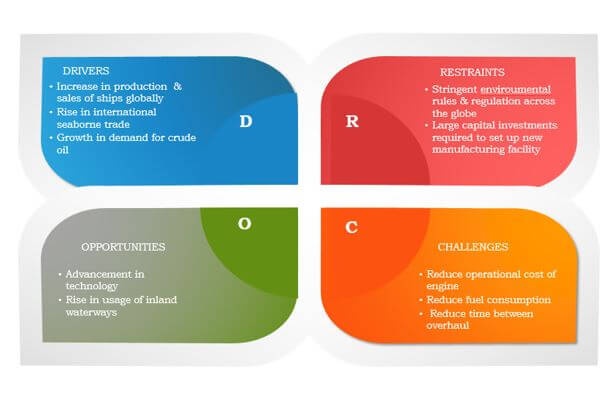
Increase in production & sales of ships globally and rise in international seaborne trade drive the market growth. In addition, increase in demand for resources such as crude oil, coal, steel, and iron from developing countries fuels the market growth. However, stringent environmental rules & regulations and large capital investment required to set up new manufacturing facilities hamper the market growth. Irrespective of these challenges, rise in usage of inland waterways and advancement in technology, such as new alternative fuel propulsion engine, are expected to provide various opportunities for new products and boost the market growth.
Diesel Propulsion Engine Leads the Marine Propulsion Engine Market
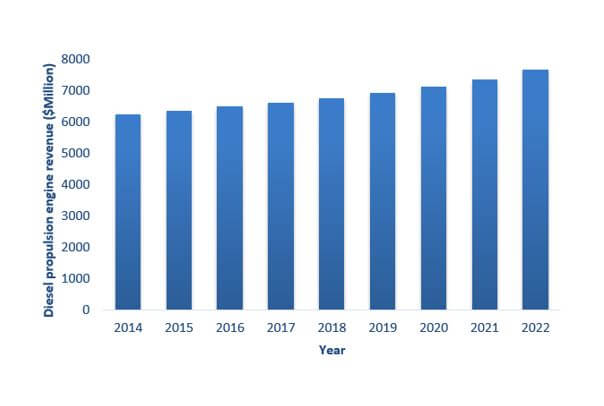
Diesel propulsion system is the most common marine propulsion system used in all types of vessel along with small and recreational boats. Moreover, diesel marine propulsion engine led the overall market, accounting for 70% in 2015. This is attributed to its benefits such as high reliability, economical nature, low maintenance cost, and easy availability of diesel globally.
Asia-Pacific: Most Lucrative Market
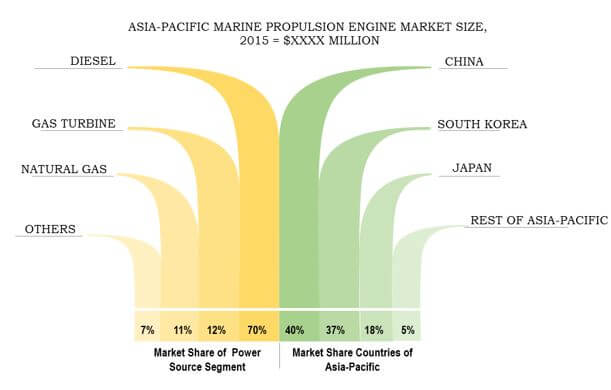
Asia-Pacific is the most lucrative marine propulsion engine market, owing to increase in shipbuilding industries in China & South Korea and growth in number of joint ventures with international brands. Moreover, rise in seaborne trade of crude oil mostly from Middle East countries to Asia-Pacific is another factor that drives the Asia-Pacific marine propulsion engine market.
MARINE PROPULSION ENGINE MARKET KEY BENEFITS
Marine Propulsion Engine Market Report Highlights
Aspects | Details |
---|---|
By Power Source |
|
By Ship Type |
|
By Geography |
|
Key Market Players | Daihatsu Diesel Mfg. Co., Ltd., Yanmar Co., Ltd., Man Se (Man Diesel & Turbo), Wrtsil, Hyundai Heavy Industries Co., Ltd, Caterpillar, Rolls-Royce Plc, Cummins Inc., Mitsubishi Heavy Industries, Ltd., Scania |
CHAPTER 1 INTRODUCTION
1.1. Report Description
1.2. Key Benefits
1.3. Key Market Segments
1.4. Research Methodology
1.4.1. Secondary Research
1.4.2. Primary Research
1.4.3. Analyst Tools and Models
CHAPTER 2 EXECUTIVE SUMMARY
2.1. CXO Perspective
CHAPTER 3 MARKET OVERVIEW
3.1. Market Definition and Scope
3.2. Key Findings
3.2.1. Top Winning Strategies
3.2.2. Top Investment Pockets
3.3. Porters Five Forces Analysis
3.3.1. Bargaining Power of Supplier
3.3.2. Bargaining Power of Buyers
3.3.3. Threat of Substitutes
3.3.4. Threat of New Entrants
3.3.5. Intensity of Competitive Rivalry
3.4. Market Share Analysis, 2015
3.5. Market Dynamics
3.5.1. Drivers
3.5.1.1. Increasing Production and Sales of Ships Globally
3.5.1.2. Rise in International Seaborne Trade
3.5.2. Restraints
3.5.2.1. Stringent Environmental Rules & Regulations
3.5.3. Opportunities
3.5.3.1. Advancement in Technology
3.5.3.2. Rise in Usage of Inland Waterways
CHAPTER 4 GLOBAL MARINE PROPULSION ENGINE MARKET, BY POWER SOURCE
4.1. Overview
4.1.1. Key Player Positioning
4.1.2. Market Size and Forecast
4.2. Diesel
4.2.1. Key Market Trends, Growth Factors and Opportunities
4.2.2. Market Size and Forecast
4.3. Gas Turbine
4.3.1. Key Market Trends, Growth Factors and Opportunities
4.3.2. Market Size and Forecast
4.4. Natural Gas
4.4.1. Key Market Trends, Growth Factors and Opportunities
4.4.2. Market Size and Forecast
4.5. Others (Steam Turbine, Renewable Energy, Hybrid, and Fuel Cell)
4.5.1. Key Market Trends, Growth Factors and Opportunities
4.5.2. Market Size and Forecast
CHAPTER 5 GLOBAL MARINE PROPULSION ENGINE MARKET, BY SHIP TYPE
5.1. Overview
5.1.1. Market Size and Forecast
5.2. Cargo or Contanier Ship
5.2.1. Key Market Trends, Growth Factors and Opportunities
5.2.2. Market Size and Forecast
5.3. Tanker
5.3.1. Key Market Trends, Growth Factors and Opportunities
5.3.2. Market Size and Forecast
5.4. Bulk Carrier
5.4.1. Key Market Trends, Growth Factors and Opportunities
5.4.2. Market Size and Forecast
5.5. Offshore Vessel
5.5.1. Key Market Trends, Growth Factors and Opportunities
5.5.2. Market Size and Forecast
5.6. Passenger Ship
5.6.1. Key Market Trends, Growth Factors and Opportunities
5.6.2. Market Size and Forecast
5.7. Others (Tugs & Service Ships)
5.7.1. Key Market Trends, Growth Factors and Opportunities
5.7.2. Market Size and Forecast
CHAPTER 6 GLOBAL MARINE PROPULSION ENGINE MARKET, BY GEOGRAPHY
6.1. Overview
6.1.1. Market Size and Forecast
6.2. North America
6.2.1. Key Market Trends, Growth Factors and Opportunities
6.2.2. Market Size and Forecast
6.2.3. U.S.
6.2.3.1. Market Size and Forecast
6.2.4. Canada
6.2.4.1. Market Size and Forecast
6.2.5. Mexico
6.2.5.1. Market Size and Forecast
6.3. Europe
6.3.1. Key Market Trends, Growth Factors and Opportunities
6.3.2. Market Size and Forecast
6.3.3. Germany
6.3.3.1. Market Size and Forecast
6.3.4. Romania
6.3.4.1. Market Size and Forecast
6.3.5. Italy
6.3.5.1. Market Size and Forecast
6.3.6. Norway
6.3.6.1. Market Size and Forecast
6.3.7. Rest of Europe
6.3.7.1. Market Size and Forecast
6.4. Asia-Pacific
6.4.1. Key Market Trends, Growth Factors and Opportunities
6.4.2. Market Size and Forecast
6.4.3. China
6.4.3.1. Market Size and Forecast
6.4.4. Japan
6.4.4.1. Market Size and Forecast
6.4.5. South Korea
6.4.5.1. Market Size and Forecast
6.4.6. Rest of Asia-Pacific
6.4.6.1. Market Size and Forecast
6.5. LAMEA
6.5.1. Key Market Trends, Growth Factors and Opportunities
6.5.2. Market Size and Forecast
6.5.3. Latin America
6.5.3.1. Market Size and Forecast
6.5.4. Middle East
6.5.4.1. Market Size and Forecast
6.5.5. Africa
6.5.5.1. Market Size and Forecast
CHAPTER 7 RELATED INDUSTRY INSIGHTS
CHAPTER 8 COMPANY PROFILES
8.1. Caterpillar
8.1.1. Company Overview
8.1.2. Operating Business Segments
8.1.3. Business Performance
8.1.4. Key Strategic Moves and Developments
8.2. Cummins Inc.
8.2.1. Company Overview
8.2.2. Operating Business Segments
8.2.3. Business Performance
8.2.4. Key Strategic Moves and Developments
8.3. Daihatsu Diesel Mfg. Co., Ltd.
8.3.1. Company Overview
8.3.2. Operating Business Segments
8.3.3. Business Performance
8.4. Hyundai Heavy Industries Co., Ltd
8.4.1. Company Overview
8.4.2. Operating Business Segments
8.4.3. Business Performance
8.4.4. Key Strategic Moves and Developments
8.5. Man Se (Man Diesel & Turbo)
8.5.1. Company Overview
8.5.2. Operating Business Segments
8.5.3. Business Performance
8.5.4. Key Strategic Moves and Developments
8.6. Mitsubishi Heavy Industries, Ltd.
8.6.1. Company Overview
8.6.2. Operating Business Segments
8.6.3. Business Performance
8.6.4. Key Strategic Moves and Developments
8.7. Rolls-Royce Plc
8.7.1. Company Overview
8.7.2. Operating Business Segments
8.7.3. Business Performance
8.7.4. Key Strategic Moves and Developments
8.8. Scania
8.8.1. Company Overview
8.8.2. Operating Business Segments
8.8.3. Business Performance
8.8.4. Key Strategic Moves and Developments
8.9. Wrtsil
8.9.1. Company Overview
8.9.2. Operating Business Segments
8.9.3. Business Performance
8.9.4. Key Strategic Moves and Developments
8.10. Yanmar Co., Ltd.
8.10.1. Company Overview
8.10.2. Operating Business Segments
8.10.3. Business Performance
8.10.4. Key Strategic Moves and Developments
LIST of TABLE
TABLE 1. GLOBAL MARINE PROPULSION ENGINE MARKET, BY POWER SOURCE, 2014-2022 ($MILLION)
TABLE 2. GLOBAL DIESEL PROPULSION ENGINE MARKET, REVENUE, BY REGION ($MILLION), 2014-2022
TABLE 3. GLOBAL GAS TURBINE PROPULSION ENGINE MARKET, REVENUE, BY REGION ($MILLION), 2014-2022
TABLE 4. GLOBAL NATURAL GAS PROPULSION ENGINE MARKET, REVENUE, BY REGION ($MILLION), 2014-2022
TABLE 5. GLOBAL OTHERS PROPULSION ENGINE MARKET, REVENUE, BY REGION ($MILLION), 2014-2022
TABLE 6. GLOBAL MARINE PROPULSION ENGINE MARKET, BY SHIP TYPES, 2014-2022 ($MILLION)
TABLE 8. GLOBAL CARGO OR CONTANIER PROPULSION ENGINE MARKET, REVENUE, BY REGION ($MILLION), 2014-2022
TABLE 9. GLOBAL TANKER PROPULSION ENGINE MARKET, REVENUE, BY REGION ($MILLION), 2014-2022
TABLE 10. GLOBAL BULK CARRIER PROPULSION ENGINE MARKET, REVENUE, BY REGION ($MILLION), 2014-2022
TABLE 11. GLOBAL OFFSHORE VESSEL PROPULSION ENGINE MARKET, REVENUE, BY REGION ($MILLION), 2014-2022
TABLE 12. GLOBAL PASSENGER SHIP PROPULSION ENGINE MARKET, REVENUE, BY REGION ($MILLION), 2014-2022
TABLE 13. GLOBAL OTHERS PROPULSION ENGINE MARKET, REVENUE, BY REGION ($MILLION), 2014-2022
TABLE 14. MARINE PROPULSION ENGINE MARKET, BY GEOGRAPHY, 2014-2022 ($MILLION)
TABLE 15. NORTH AMERICA: MARINE PROPULSION ENGINE MARKET, BY POWER SOURCE, 2014-2022 ($MILLION)
TABLE 16. NORTH AMERICA: MARINE PROPULSION ENGINE MARKET, BY SHIP TYPE, 2014-2022 ($MILLION)
TABLE 17. NORTH AMERICA: MARINE PROPULSION ENGINE MARKET, BY COUNTRY, 2014-2022 ($MILLION)
TABLE 18. EUROPE: MARINE PROPULSION ENGINE MARKET, BY POWER SOURCE, 2014-2022 ($MILLION)
TABLE 19. EUROPE: MARINE PROPULSION ENGINE MARKET, BY SHIP TYPE, 2014-2022 ($MILLION)
TABLE 20. EUROPE: MARINE PROPULSION ENGINE MARKET, BY COUNTRY, 2014-2022 ($MILLION)
TABLE 21. ASIA-PACIFIC: MARINE PROPULSION ENGINE MARKET, BY POWER SOURCE, 2014-2022 ($MILLION)
TABLE 22. ASIA-PACIFIC: MARINE PROPULSION ENGINE MARKET, BY SHIP TYPE, 2014-2022 ($MILLION)
TABLE 23. ASIA-PACIFIC: MARINE PROPULSION ENGINE MARKET, BY COUNTRY, 2014-2022 ($MILLION)
TABLE 24. LAMEA: MARINE PROPULSION ENGINE MARKET, BY POWER SOURCE, 2014-2022 ($MILLION)
TABLE 25. LAMEA: MARINE PROPULSION ENGINE MARKET, BY SHIP TYPE, 2014-2022 ($MILLION)
TABLE 26. LAMEA: MARINE PROPULSION ENGINE MARKET, BY COUNTRY, 2014-2022 ($MILLION)
TABLE 27. CATTERPILLAR. COMPANY SNAPSHOT
TABLE 28. CATTERPILLAR: OPERATING SEGMENTS
TABLE 29. CUMMINS INC.: COMPANY SNAPSHOT
TABLE 30. CUMMINS INC.: OPERATING SEGMENTS
TABLE 31. DAIHATSU DIESEL MFG. CO., LTD.: COMPANY SNAPSHOT
TABLE 32. DAIHATSU DIESEL MFG. CO., LTD.: OPERATING SEGMENTS
TABLE 33. HYUNDAI HEAVY INDUSTRIES CO., LTD.: COMPANY SNAPSHOT
TABLE 34. HYUNDAI HEAVY INDUSTRIES CO., LTD: OPERATING SEGMENTS
TABLE 35. MAN SE (MAN DIESEL & TURBO). COMPANY SNAPSHOT
TABLE 36. MAN SE (MAN DIESEL & TURBO): OPERATING SEGMENTS
TABLE 37. MITSUBISHI HEAVY INDUSTRIES, LTD.: COMPANY SNAPSHOT
TABLE 38. MITSUBISHI HEAVY INDUSTRIES, LTD.: OPERATING SEGMENTS
TABLE 39. ROLLS-ROYCE PLC: COMPANY SNAPSHOT
TABLE 40. ROLLS-ROYCE PLC: OPERATING SEGMENTS
TABLE 41. SCANIA: COMPANY SNAPSHOT
TABLE 42. SCANIA: OPERATING SEGMENTS
TABLE 43. WRTSIL: COMPANY SNAPSHOT
TABLE 44. WRTSIL: OPERATING SEGMENTS
TABLE 45. YANMAR CO., LTD.: COMPANY SNAPSHOT
TABLE 46. YANMAR CO., LTD.: OPERATING SEGMENTS
LIST of FIGURES
FIGURE 1. TOP WINNING STRATEGIES: PERCENTAGE DISTRIBUTION (2013-2016)
FIGURE 2. TOP WINNING STRATEGIES: NATURE and TYPE
FIGURE 3. TOP INVESTMENT POCKETS in GLOBAL MARINE PROPULSION ENGINE MARKET, BY POWER SOURCE
FIGURE 4. PORTERS FIVE FORCES ANALYSIS
FIGURE 5. MARKET SHARE ANALYSIS, 2015
FIGURE 6. GLOBAL MARINE PROPULSION ENGINE MARKET SHARE, BY POWER SOURCE, 2014 & 2022 (%SHARE)
FIGURE 7. GLOBAL DIESEL PROPULSION ENGINE MARKET, COMPARATIVE REGIONAL MARKET SHARE ANALYSIS (%), 2014 & 2022
FIGURE 8. GLOBAL DIESEL PROPULSION ENGINE MARKET, REVENUE, ($MILLION), 2014-2022
FIGURE 9. GLOBAL GAS TURBINE PROPULSION ENGINE MARKET, COMPARATIVE REGIONAL MARKET SHARE ANALYSIS (%), 2014 & 2022
FIGURE 10. GLOBAL GAS TURBINE PROPULSION ENGINE MARKET, REVENUE, ($MILLION), 2014-2022
FIGURE 11. GLOBAL NATURAL GAS PROPULSION ENGINE MARKET, COMPARATIVE REGIONAL MARKET SHARE ANALYSIS (%), 2014 & 2022
FIGURE 12. GLOBAL NATURAL GAS PROPULSION ENGINE MARKET, REVENUE, ($MILLION), 2014-2022
FIGURE 13. GLOBAL OTHERS PROPULSION ENGINE MARKET, COMPARATIVE REGIONAL MARKET SHARE ANALYSIS (%), 2014 & 2022
FIGURE 14. GLOBAL OTHERS PROPULSION ENGINE MARKET, REVENUE, ($MILLION), 2014-2022
FIGURE 15. GLOBAL MARINE PROPULSION ENGINE MARKET SHARE, BY SHIP TYPE, 2014 & 2022 (%SHARE)
FIGURE 16. GLOBAL CAROGO OR CONTANIER SHIP PROPULSION ENGINE MARKET, COMPARATIVE REGIONAL MARKET SHARE ANALYSIS (%), 2014 & 2022
FIGURE 17. GLOBAL CARGO OR CONTANIER PROPULSION ENGINE MARKET, REVENUE, ($MILLION), 2014-2022
FIGURE 18. GLOBAL TANKER PROPULSION ENGINE MARKET, COMPARATIVE REGIONAL MARKET SHARE ANALYSIS (%), 2014 & 2022
FIGURE 19. GLOBAL TANKER PROPULSION ENGINE MARKET, REVENUE, ($MILLION), 2014-2022
FIGURE 20. GLOBAL BULK CARRIER PROPULSION ENGINE MARKET, COMPARATIVE REGIONAL MARKET SHARE ANALYSIS (%), 2014 & 2022
FIGURE 21. GLOBAL BULK CARRIER PROPULSION ENGINE MARKET, REVENUE, ($MILLION), 2014-2022
FIGURE 22. GLOBAL OFFSHORE VESSEL PROPULSION ENGINE MARKET, COMPARATIVE REGIONAL MARKET SHARE ANALYSIS (%), 2014 & 2022
FIGURE 23. GLOBAL OFFSHORE VESSEL PROPULSION ENGINE MARKET, REVENUE, ($MILLION), 2014-2022
FIGURE 24. GLOBAL PASSENGER SHIP PROPULSION ENGINE MARKET, COMPARATIVE REGIONAL MARKET SHARE ANALYSIS (%), 2014 & 2022
FIGURE 25. GLOBAL PASSENGER SHIP PROPULSION ENGINE MARKET, REVENUE, ($MILLION), 2014-2022
FIGURE 26. GLOBAL OTHERS PROPULSION ENGINE MARKET, COMPARATIVE REGIONAL MARKET SHARE ANALYSIS (%), 2014 & 2022
FIGURE 27. GLOBAL OTHERS PROPULSION ENGINE MARKET, REVENUE, ($MILLION), 2014-2022
FIGURE 28. GLOBAL MARINE PROPULSION ENGINE MARKET SHARE, BY REGION, 2014 & 2022 (%SHARE)
FIGURE 29. NORTH AMERICA: MARINE PROPULSION ENGINE MARKET SHARE BY POWER SOURCE (% SHARE), 2014 & 2022
FIGURE 30. NORTH AMERICA: MARINE PROPULSION ENGINE MARKET SHARE, BY SHIP TYPE (% SHARE), 2014 & 2022
FIGURE 31. NORTH AMERICA: MARINE PROPULSION ENGINE MARKET, REVENUE ($MILLION), 2014-2022
FIGURE 32. U.S.: MARINE PROPULSION ENGINE MARKET SIZE, 2014-2022 ($MILLION)
FIGURE 33. CANADA: MARINE PROPULSION ENGINE MARKET SIZE, 2014-2022 ($MILLION)
FIGURE 34. MEXICO: MARINE PROPULSION ENGINE MARKET SIZE, 2014-2022 ($MILLION)
FIGURE 35. EUROPE: MARINE PROPULSION ENGINE MARKET SHARE BY POWER SOURCE (% SHARE), 2014 & 2022
FIGURE 36. EUROPE: MARINE PROPULSION ENGINE MARKET SHARE, BY SHIP TYPE (% SHARE), 2014 & 2022
FIGURE 37. EUROPE: MARINE PROPULSION ENGINE MARKET, REVENUE ($MILLION), 2014-2022
FIGURE 38. GERMANY: MARINE PROPULSION ENGINE MARKET SIZE, 2014-2022 ($MILLION)
FIGURE 39. ROMANIA: MARINE PROPULSION ENGINE MARKET SIZE, 2014-2022 ($MILLION)
FIGURE 40. ITALY: MARINE PROPULSION ENGINE MARKET SIZE, 2014-2022 ($MILLION)
FIGURE 41. NORWAY: MARINE PROPULSION ENGINE MARKET SIZE, 2014-2022 ($MILLION)
FIGURE 42. REST of EUROPE: MARINE PROPULSION ENGINE MARKET SIZE, 2014-2022 ($MILLION)
FIGURE 43. ASIA-PACIFIC: MARINE PROPULSION ENGINE MARKET SHARE BY POWER SOURCE (% SHARE), 2014 & 2022
FIGURE 44. ASIA-PACIFIC: GLOBAL MARINE PROPULSION ENGINE MARKET SHARE, BY SHIP TYPE (% SHARE), 2014 & 2022
FIGURE 45. ASIA-PACIFIC: MARINE PROPULSION ENGINE MARKET, REVENUE ($MILLION), 2014-2022
FIGURE 46. CHINA. MARINE PROPULSION ENGINE MARKET SIZE, 2014-2022 ($MILLION)
FIGURE 47. JAPAN: MARINE PROPULSION ENGINE MARKET SIZE, 2014-2022 ($MILLION)
FIGURE 48. SOUTH KOREA: MARINE PROPULSION ENGINE MARKET SIZE, 2014-2022 ($MILLION)
FIGURE 49. REST of ASIA-PACIFIC: MARINE PROPULSION ENGINE MARKET SIZE, 2014-2022 ($MILLION)
FIGURE 50. LAMEA: MARINE PROPULSION ENGINE MARKET SHARE BY POWER SOURCE (% SHARE), 2014 & 2022
FIGURE 51. LAMEA: MARINE PROPULSION ENGINE MARKET SHARE, BY SHIP TYPE (% SHARE), 2014 & 2022
FIGURE 52. LAMEA: MARINE PROPULSION ENGINE MARKET, REVENUE ($MILLION), 2014-2022
FIGURE 53. LATIN AMERICA: MARINE PROPULSION ENGINE MARKET SIZE, 2014-2022 ($MILLION)
FIGURE 54. MIDDLE EAST: MARINE PROPULSION ENGINE MARKET SIZE, 2014-2022 ($MILLION)
FIGURE 55. AFRICA: MARINE PROPULSION ENGINE MARKET SIZE, 2014-2022 ($MILLION)
FIGURE 56. CATTERPILLAR: COMPANY SNAPSHOT
FIGURE 57. CUMMINS INC.: COMPANY SNAPSHOT
FIGURE 58. DAIHATSU DIESEL MFG. CO., LTD.: COMPANY SNAPSHOT
FIGURE 59. HYUNDAI HEAVY INDUSTRIES CO., LTD: COMPANY SNAPSHOT
FIGURE 60. MAN SE (MAN DIESEL & TURBO): COMPANY SNAPSHOT
FIGURE 61. MITSUBISHI HEAVY INDUSTRIES, LTD.: COMPANY SNAPSHOT
FIGURE 62. ROLLS-ROYCE PLC: COMPANY SNAPSHOT
FIGURE 63. SCANIA: COMPANY SNAPSHOT
FIGURE 64. WRTSIL: COMPANY SNAPSHOT
FIGURE 65. YANMAR CO., LTD.: COMPANY SNAPSHOT
Marine propulsion engine is machine that burns fuel to create thrust, which helps ships to move across water. As of now, ship propulsion is not just about successful & smooth movement of the ship across the water. It also involves using the best mode of propulsion system to ensure a better safety standard for the marine ecosystem along with cost efficiency.
Rise in number of ships; increase in international seaborne trade; and increase in demand for resources such as crude oil, steel, iron, and coal drive the growth of the marine propulsion engine market. Furthermore, rise in usage of inland waterways and technological advancements such as fuel cell, hybrid & nuclear reactor engine boost the demand for marine propulsion engine.
As of now, there are latest RT-flex and ME engines which are camshaft less electronically controlled engines. These are used as intelligent engines by electronic control and feedback. Intelligent engine will monitor its own condition according to the feedback & pre- set setting and it will adjust the engine parameters itself.
The diesel propulsion engine segment constituted the largest market share owing to its benefits such as highly reliable engine, economical nature, low maintenance cost, and easy availability of diesel globally. The adoption rate of natural gas-powered marine propulsion engine is high as compared to others, owing to stringent marine engine emission rules and regulations. Moreover, the bulk carrier segment is expected to witness a robust growth due to increase in demand of resources such as ore, coal, grains and other similar products in loose form.
Asia-Pacific is projected to hold the largest market share, followed by Europe and North America. This is attributed to increase in shipbuilding industry of China and South Korea. Leading players such as Caterpillar, Cummins Inc., Rolls-Royce Plc, and Wärtsilä are expected to explore newer techniques and applications to cater to the growing demands of customers. Collaborations and acquisitions are projected to enable them to enhance their product portfolios and increase their geographical presence.
Start reading instantly.
This Report and over 67,068+ more Reports, Available with Avenue Library. T&C*.
Enterprise
License/PDF
Library
Membership
*Taxes/Fees, if applicable will be added during checkout. All prices in USD
To ensure high-level data integrity, accurate analysis, and impeccable forecasts
For complete satisfaction
On-demand customization of scope of the report to exactly meet your needs
Targeted market view to provide pertinent information and save time of readers
Get insights on topics that are crucial for your business. Stay abreast of your interest areas.
Get Industry Data AlertsTo ensure high-level data integrity, accurate analysis, and impeccable forecasts
For complete satisfaction
On-demand customization of scope of the report to exactly meet your needs
Targeted market view to provide pertinent information and save time of readers