
Maritime Surveillance Market Research, 2033
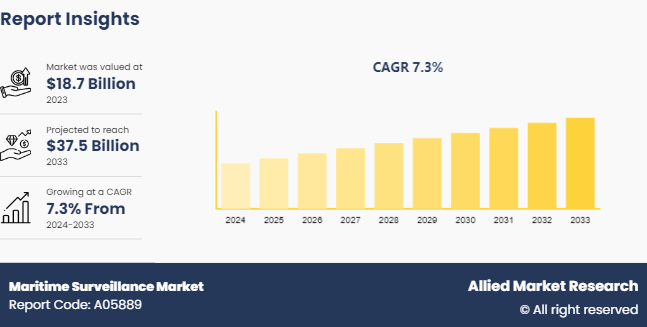
The global maritime surveillance market was valued at $18.7 billion in 2023, and is projected to reach $37.5 billion by 2033, growing at a CAGR of 7.3% from 2024 to 2033.
Market Introduction and Definition
Maritime surveillance involves monitoring and observing maritime activities to ensure the security, safety, and effective management of seas and oceans. This process includes detecting and tracking vessels, monitoring illegal activities such as smuggling and piracy, ensuring safe navigation, protecting maritime borders, and managing resources like fisheries.
The market for maritime surveillance encompasses a wide array of products, services, and solutions designed for various stakeholders, including governments and maritime authorities. Key components of maritime surveillance systems include satellites equipped with synthetic aperture radar (SAR) and optical sensors, which provide extensive surveillance capabilities by detecting and tracking vessels across large oceanic areas.
Key Takeaways
- The maritime surveillance market study covers 20 countries. The research includes a segment analysis of each country in terms of value for the projected period.
- More than 1,500 product literatures, industry releases, annual reports, and other such documents of major maritime surveillance industry participants along with authentic industry journals, trade associations' releases, and government websites have been reviewed for generating high-value industry insights.
- The study integrated high-quality data, professional opinions and analysis, and critical independent perspectives. The research approach is intended to provide a balanced view of global markets and to assist stakeholders in making educated decisions in order to achieve their most ambitious growth objectives.
Key Market Dynamics
The maritime surveillance market size is influenced by various factors such as technological advancement, geopolitical and security needs, commercial shipping, and others. Increasing piracy and illegal activities, rise in geopolitical tensions and territorial disputes, technological advancement are the significant drivers of the maritime surveillance market growth. Furthermore, surge in government investment, and integration of advance technologies such as AI and machine learning with maritime surveillance technologies boost the demand for the maritime surveillance market. However, high cost and regulatory challenges have hampered the growth of the maritime surveillance market. Maritime surveillance industry players are increasingly focusing on advanced technologies to enhance maritime safety and security.
The increasing incidents of piracy, smuggling, human trafficking, and illegal fishing, coupled with rising geopolitical tensions and territorial disputes, particularly in regions like the South China Sea, are significant drivers for the maritime surveillance market. These challenges necessitate advanced surveillance systems to ensure the protection of national waters, economic zones, and strategic interests. Enhanced surveillance capabilities enable nations to monitor and respond to threats effectively, thereby maintaining sovereignty and security in their maritime domains. The maritime surveillance market share is dominated by companies offering integrated radar and satellite systems.
The Maritime Security Sector: A Comprehensive Insight
The maritime surveillance market is a subset of the broader maritime security market. The maritime security market encompasses a wide range of technologies, solutions, and services aimed at safeguarding maritime interests against various threats. These include piracy, terrorism, smuggling, human trafficking, illegal fishing, and territorial disputes. The market is driven by the increasing need for national security, safe maritime trade, and protection of marine resources. The global maritime trade is expanding, leading to a higher volume of goods transported by sea.Significant growth is anticipated in the maritime surveillance market opportunity as governments invest more in border security and environmental monitoring.
This increases the need for robust maritime security to ensure safe and secure shipping lanes. The prevalence of piracy, smuggling, and other illegal activities necessitates enhanced security measures to protect vessels and national waters. Governments worldwide are investing in maritime security infrastructure and adopting stringent regulations to safeguard their maritime borders and economic zones. The maritime surveillance market forecast suggests robust expansion driven by advancements in sensor technologies and increasing global maritime traffic.
Moreover, innovations in radar, sonar, satellite imagery, and unmanned systems have significantly improved the efficiency and effectiveness of maritime security solutions. The maritime security market, including the maritime surveillance segment, is poised for robust growth driven by the increasing need for maritime safety and security, technological advancements, and strategic investments by governments and private entities.
Market Segmentation
The maritime surveillance market is segmented into application, component, type, and region. On the basis of application, the market is divided into naval, coast guard, and others. As per component, the market is segregated into radar, sensors, ais receiver/transponder, and others. By type, the market is classified into surveillance & tracking, detector, and others. Region wise, the market is analyzed across North America, Europe, Asia-Pacific, Latin America, Latin America, and Middle East Africa.
Regional/Country Market Outlook
- The U.S. leads in the development and deployment of advanced maritime surveillance technologies, including satellite-based monitoring, UAVs, and AI-driven analytics. Significant investments in modernizing naval forces and enhancing maritime domain awareness (MDA) capabilities. Moreover, U.S. government initiatives such as the National Oceanic and Atmospheric Administration (NOAA) programs and the Department of Homeland Security (DHS) investments in maritime security drive market growth.
- Moreover, major defense contractors, including Lockheed Martin and Northrop Grumman, are actively involved in providing advanced maritime surveillance solutions. European countries are also increasingly collaborating on joint maritime security initiatives, such as the European Maritime Safety Agency (EMSA) projects.
- In April 2024, NATO Headquarters hosted the Digital Ocean Industry Symposium, bringing together over 200 industry representatives and government officials to address critical challenges in the maritime domain. This symposium focused on how emerging and disruptive technologies can enhance NATO's maritime operational capabilities, particularly in terms of surveillance and security.
- In March 2024, Security agencies in India are planning to deploy drone surveillance systems along the coastal regions of Mumbai and Goa to enhance maritime security. The primary goal is to fortify coastal defenses against potential threats by using advanced technology. The drones to be deployed will be long-range and equipped with night vision and thermal imaging capabilities.
Competitive Landscape
The report analyzes the profiles of key players operating in the maritime surveillance market such as Kongsberg, SAAB, Raytheon, Furuno, Thales Group, Indra, Elbit Systems, Bharat Electronics, TERMA, SRT Marine Systems Plc. These players have adopted various strategies to increase their market penetration and strengthen their position in the maritime surveillance market. Therefore, the maritime surveillance market size will increase substantially over the next decade due to rising demands for coastal and oceanic security solutions.
Industry Trends
- In November 2023, Thales secured a contract to equip the French Navy's new offshore patrol vessels with advanced surveillance and identification technology. Specifically, Thales will provide its Bluewatcher hull sonar, NS50 radar, and TSA 3522 Identification Friend or Foe (IFF) system. The Bluewatcher hull sonar will provide active and passive detection of underwater threats, such as submarines and mines. The NS50 radar will offer comprehensive surveillance of aerial and surface threats, ensuring the patrol vessels can monitor their surroundings effectively.
- In May 2023, Leonardo signed a contract with the Ministry of Defence of Malaysia to supply two ATR 72 Maritime Patrol Aircraft (MPA) . The signing ceremony took place at the Langkawi International Maritime and Aerospace Exhibition (LIMA) 2023, a significant defense event in the Asia-Pacific region held in Langkawi, Malaysia. The ATR 72 MPA is a twin-turboprop aircraft specifically designed for maritime patrol missions. It is a specialized variant of the ATR regional transport aircraft.
- In November 2023, Saab Australia has formed a partnership with ThayerMahan, a leading U.S. company specializing in autonomous maritime and undersea surveillance, to enhance Australia's sovereign undersea warfare capabilities. This collaboration aims to leverage Saab's expertise in system integration and autonomous maritime technology with ThayerMahan's cutting-edge underwater surveillance technology.
Key Sources Referred
- International Association of Maritime Security Professionals (IAMSP)
- International Maritime Organization (IMO)
- International Maritime Security Forum (IMSF)
- Maritime Security Council (MSC) International Energy Agency
- International Association of Marine Aids to Navigation and Lighthouse Authorities (IALA)
Key Benefits For Stakeholders
- This report provides a quantitative analysis of the market segments, current trends, estimations, and dynamics of the maritime surveillance market analysis from 2024 to 2033 to identify the prevailing maritime surveillance market opportunities.
- The market research is offered along with information related to key drivers, restraints, and opportunities.
- Porter's five forces analysis highlights the potency of buyers and suppliers to enable stakeholders make profit-oriented business decisions and strengthen their supplier-buyer network.
- In-depth analysis of the maritime surveillance market segmentation assists to determine the prevailing market opportunities.
- Major countries in each region are mapped according to their revenue contribution to the global market.
- Market player positioning facilitates benchmarking and provides a clear understanding of the present position of the market players.
- The report includes the analysis of the regional as well as global maritime surveillance market trends, key players, market segments, application areas, and market growth strategies.
Maritime Surveillance Market Report Highlights
| Aspects | Details |
| Market Size By 2033 | USD 37.5 Billion |
| Growth Rate | CAGR of 7.3% |
| Forecast period | 2024 - 2033 |
| Report Pages | 283 |
| By Application |
|
| By Component |
|
| By Type |
|
| By Region |
|
| Key Market Players | Kongsberg, SRT Marine Systems Plc, Raytheon Technologies Corporation, Elbit Systems, Thales Group, Furuno, Indra Sistemas, Bharat Electronics, SAAB AB, TERMA |
The maritime surveillance market was valued at $18.7 billion in 2023 and is estimated to reach $37.5 billion by 2033, exhibiting a CAGR of 7.3% from 2024 to 2033.
The largest regional market for maritime surveillance is North America.
The leading application of maritime surveillance market is cost guard operations.
The top companies to hold the market share in maritime surveillance are Kongsberg, SAAB, Raytheon, Furuno, Thales Group, Indra, Elbit Systems, Bharat Electronics, TERMA, SRT Marine Systems Plc
The upcoming trends of maritime surveillance market in the globe are surge in government investment, and integration of advance technologies such as AI and machine learning with maritime surveillance technologies
Loading Table Of Content...

