Report Code: A01841 | Apr 2017 | Pages: 180 | ||
Tables: 51 | Charts: 65 |
|
Pandemic disrupted the entire world and affected many industries.
Get detailed COVID-19 impact analysis on the Medical Bionics Market
Request Now !Global Medical Bionics Market was valued at $15,348 million in 2016, and is expected to garner $29,160 million by 2023, registering a CAGR of 9.6% during the forecast period. Bionics also known as biomedical implants are artificial addition to the body. These artificial implants mimic the function of the lost or non-functional body part such as limb or eye. Rise in geriatric population, increase in government focus on funding R&D initiatives, and upsurge in number of patients suffering from chronic diseases are expected to drive the market growth. Moreover, technological advancements, such as the cochlear implants, with speech recognition features that help to differentiate speech in noisy and reverberant situation fuel the demand for medical bionics. However, high cost of the devices and treatment and stringent approval process for these devices are expected to impede the market growth.
Rise in Incidence of Chronic Disease
As per the estimates of the annual report (2014) published by the American Heart Association in Heart Ware International, Inc., approximately 5.5 million individuals are affected by heart failure in the U.S. Moreover, approximately 670,000 new cases of heart failure are diagnosed each year in the U.S. Similarly, in Canada there is a rise in the prevalence of chronic diseases due to unhealthy lifestyle and aging population. In 2007, 1.3 million Canadians were reported to be diagnosed with heart diseases, around 1.6 million were reported to be living with the effects of stroke (Source: Public Health Agency of Canada).
Growth in Asia-Pacific Region
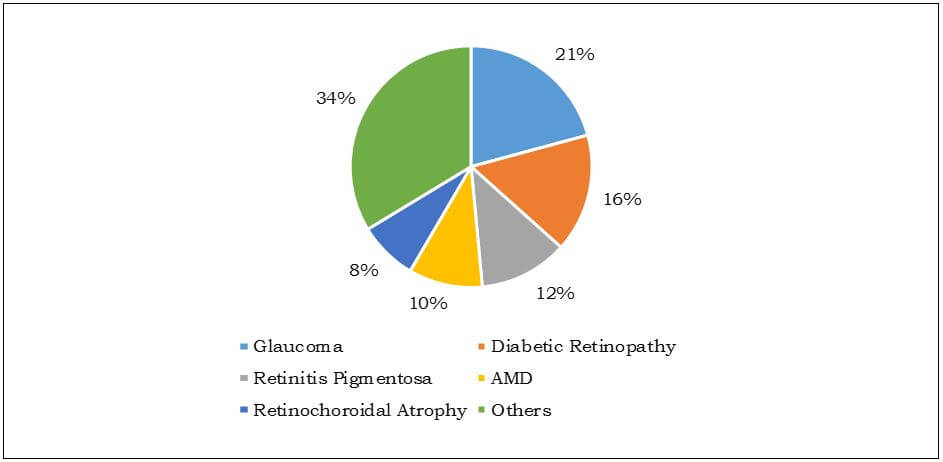
This region offers lucrative opportunities in this market owing to presence of large pool of patients suffering from chronic disorders such as cardiac disorders, neural disorders and hearing and vision loss. In 2011, the Australian Institute of Health & Welfare estimated that at least 300,000 Australians have suffered from chronic heart failure and 30,000 new cases are identified every year. Hence, high incidence of cardiac disorders makes it an attractive market for cardiac bionics. In addition, high prevalence of eye-related diseases in Japan makes it an attractive market for eye bionics in the country.
Leading Causes of Blindness in Japan, 2013
Technological Advancements Witnessed in the Market
The field of medical bionics have witnessed several technological advancements in the recent years. The cochlear implants available in the present scenario have speech recognition in difficult listening situations, which help to differentiate speech in noisy and reverberant situation, understand sound from television or telephone, and identify a sound from distance. In addition, hearing aids feature acoustic scene classifiers, which help hearing aids to classify and identify any sound based on background noise, speech in quiet or in noise, music, wind, and number of other parameters.
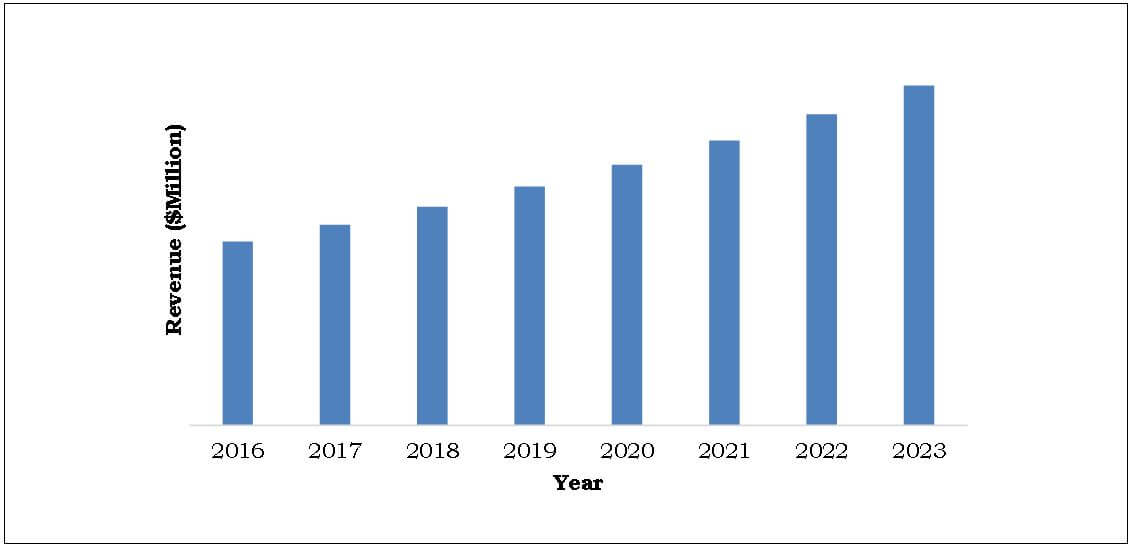
South Africa: Medical Bionics Market, ($Million) 2016-2023
Segmentation
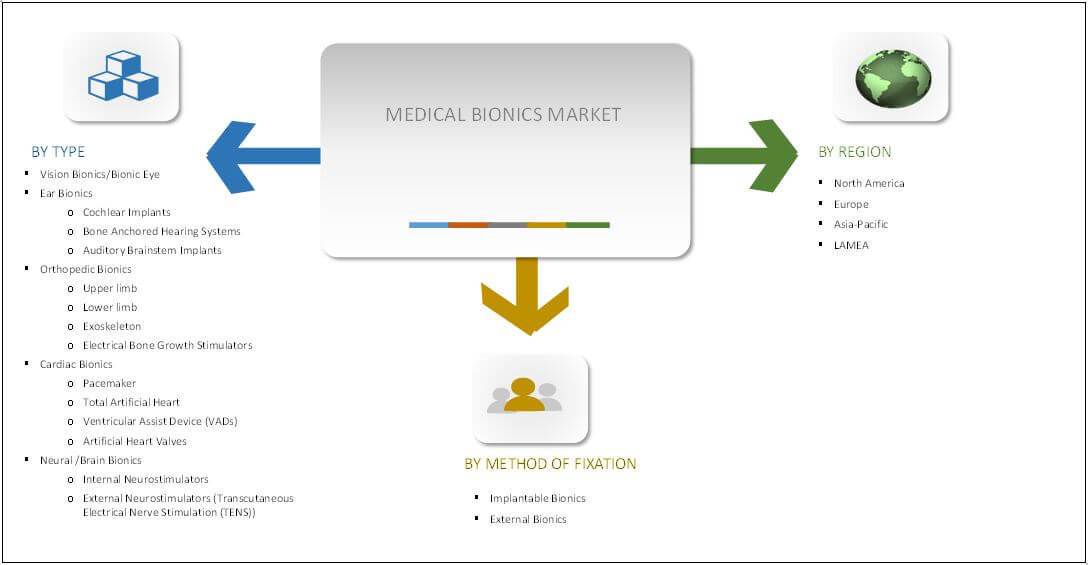
The key companies operating in the medical bionics market are Abbott, Boston Scientific Corporation, Cochlear Ltd., LivaNova PLC, Medtronic plc, Orthofix Holdings, Inc., ssur Corporate, Retina Implant AG, Sonova, SECOND SIGHT, SynCardia Systems, LLC, and William Demant Holding A/S
Key Benefits
Medical Bionics Market Report Highlights
Aspects | Details |
---|---|
By PRODUCT |
|
By METHOD OF FIXATION |
|
By Region |
|
Key Market Players | RETINA IMPLANT AG, SYNCARDIA SYSTEMS, LLC, WILLIAM DEMANT HOLDING A/S, SECOND SIGHT MEDICAL PRODUCTS, INC., LIVANOVA PLC, SONOVA, BOSTON SCIENTIFIC CORPORATION, ABOTT LABORATORIES, COCHLEAR LTD., OSSUR, ORTHOFIX HOLDINGS, INC., MEDTRONIC PLC |
CHAPTER 1 INTRODUCTION
1.1. REPORT DESCRIPTION
1.2. KEY BENEFITS FOR STAKEHOLDERS
1.3. KEY MARKET SEGMENTS
1.4. RESEARCH METHODOLOGY
1.4.1. Secondary research
1.4.2. Primary research
1.4.3. Analyst tools and models
CHAPTER 2 EXECUTIVE SUMMARY
2.1. KEY FINDINGS OF THE STUDY
2.2. CXO PERSPECTIVE
CHAPTER 3 MARKET OVERVIEW
3.1. MARKET DEFINITION AND SCOPE
3.2. KEY FINDINGS
3.2.1. Top investment pockets
3.2.2. Market share analysis, 2016
3.3. MARKET DYNAMICS
3.3.1. Drivers
3.3.1.1. Rise in number of patients suffering from chronic diseases
3.3.1.2. Increasing pool of geriatric population
3.3.1.3. Technological advancements
3.3.1.4. Increasing government focus on funding R&D initiatives
3.3.2. Restraints
3.3.2.1. High cost of treatment
3.3.2.2. Stringent approval process
3.3.3. Opportunities
3.3.3.1. Lucrative opportunities in emerging economies
3.3.4. Impact Analysis
3.4. GOVERNMENT REGULATIONS
3.5. CLINICAL TRIALS
CHAPTER 4 GLOBAL MEDICAL BIONICS MARKET, BY PRODUCT
4.1. OVERVIEW
4.1.1. Market size and forecast
4.2. VISION BIONICS/ BIONICS EYE
4.2.1. Key market trends
4.2.2. Growth factors and opportunities
4.2.3. Market size and forecast
4.3. EAR BIONICS
4.3.1. Key market trends
4.3.2. Growth factors and opportunities
4.3.3. Market size and forecast
4.3.3.1. Cochlear implants
4.3.3.2. Market size and forecast
4.3.3.3. Bone Anchored Hearing Systems (BAHS)
4.3.3.4. Market size and forecast
4.3.3.5. Auditory brainstem implants
4.3.3.6. Market size and forecast
4.4. ORTHOPEDIC BIONICS
4.4.1. Key market trends
4.4.2. Growth factors and opportunities
4.4.3. Market size and forecast
4.4.3.1. Upper limb
4.4.3.2. Market size and forecast
4.4.3.3. Lower limb
4.4.3.4. Market size and forecast
4.4.3.4.1. Bionic knee
4.4.3.4.2. Market size and forecast
4.4.3.4.3. Bionic feet
4.4.3.4.4. Market size and forecast
4.4.3.5. Exoskeleton
4.4.3.6. Market size and forecast
4.4.3.7. Electrical bone growth stimulators
4.4.3.8. Market size and forecast
4.4.3.8.1. Invasive bone growth stimulators
4.4.3.8.2. Market size and forecast
4.4.3.8.3. Non-invasive bone growth stimulators
4.4.3.8.4. Market size and forecast
4.5. CARDIAC BIONICS
4.5.1. Key market trends
4.5.2. Growth factors and opportunities
4.5.3. Market size and forecast
4.5.4. Pacemaker
4.5.4.1. Implantable pacemaker
4.5.4.2. External pacemaker
4.5.5. Market size and forecast
4.5.6. Total artificial heart
4.5.7. Market size and forecast
4.5.8. Ventricular assist device (VADs)
4.5.9. Market size and forecast
4.5.9.1. Left Ventricular Assist Device (LVAD)
4.5.9.2. Market size and forecast
4.5.9.3. Right Ventricular Assist Device (RVAD)
4.5.9.4. Market size and forecast
4.5.9.5. Biventricular Assist Device (BIVAD)
4.5.9.6. Market size and forecast
4.5.10. Artificial Heart Valves
4.5.11. Market size and forecast
4.5.11.1. Mechanical Heart Valves
4.5.11.2. Market size and forecast
4.5.11.3. Tissue Heart Valves
4.5.11.4. Market size and forecast
4.6. NEURAL/BRAIN BIONICS
4.6.1. Key market trends
4.6.2. Growth factors and opportunities
4.6.3. Market size and forecast
4.6.4. Internal Neurostimulators
4.6.5. Market size and forecast
4.6.5.1. Deep Brain Stimulators (DBS)
4.6.5.2. Market size and forecast
4.6.5.3. Sacral Nerve Stimulators (SNS)
4.6.5.4. Market size and forecast
4.6.5.5. Vagus Nerve Stimulators (VNS)
4.6.5.6. Market size and forecast
4.6.5.7. Spinal Cord Stimulators (SCS)
4.6.5.8. Market size and forecast
4.6.5.9. Other Neurostimulators
4.6.5.10. Market size and forecast
4.6.6. External Neurostimulators (Transcutaneous Electrical Nerve Stimulation (TENS))
4.6.7. Market size and forecast
CHAPTER 5 GLOBAL MEDICAL BIONICS MARKET, BY METHOD OF FIXATION
5.1. OVERVIEW
5.1.1. Market size and forecast
5.2. IMPLANTABLE BIONICS
5.2.1. Market size and forecast
5.3. EXTERNAL BIONICS
5.3.1. Market size and forecast
CHAPTER 6 GLOBAL MEDICAL BIONICS MARKET, BY REGION
6.1. OVERVIEW
6.2. NORTH AMERICA
6.2.1. Key market trends
6.2.2. Key growth factors and opportunities
6.2.3. Market size and forecast
6.2.4. U.S. market size and forecast
6.2.5. Canada market size and forecast
6.2.6. Mexico market size and forecast
6.3. EUROPE
6.3.1. Key market trends
6.3.2. Key growth factors and opportunities
6.3.3. Market size and forecast
6.3.4. Germany market size and forecast
6.3.5. France market size and forecast
6.3.6. UK market size and forecast
6.3.7. Italy market size and forecast
6.3.8. Spain market size and forecast
6.3.9. Rest of Europe market size and forecast
6.4. ASIA-PACIFIC
6.4.1. Key market trends
6.4.2. Key growth factors and opportunities
6.4.3. Market size and forecast
6.4.4. Japan market size and forecast
6.4.5. China market size and forecast
6.4.6. India market size and forecast
6.4.7. Australia market size and forecast
6.4.8. Malaysia market size and forecast
6.4.9. Rest of Asia-Pacific market size and forecast
6.5. LAMEA
6.5.1. Key market trends
6.5.2. Key growth factors and opportunities
6.5.3. Market size and forecast
6.5.4. Brazil market size and forecast
6.5.5. South Africa market size and forecast
6.5.6. Saudi Arabia market size and forecast
6.5.7. Rest of LAMEA market size and forecast
CHAPTER 7 COMPANY PROFILES
7.1. ABOTT LABORATORIES
7.1.1. Company overview
7.1.2. Company snapshot
7.1.3. Operating business segments
7.1.4. Business performance
7.1.5. Key strategic moves and developments
7.1.6. Strategy share (%)
7.2. BOSTON SCIENTIFIC CORPORATION
7.2.1. Company overview
7.2.2. Company snapshot
7.2.3. Operating business segments
7.2.4. Business performance
7.2.5. Key strategic moves and developments
7.2.6. Strategy share (%)
7.3. COCHLEAR LTD.
7.3.1. Company overview
7.3.2. Company snapshot
7.3.3. Operating business segments
7.3.4. Business performance
7.3.5. Key strategic moves and developments
7.3.6. Strategy share (%)
7.4. LIVANOVA PLC
7.4.1. Company overview
7.4.2. Company snapshot
7.4.3. Operating business segments
7.4.4. Business performance
7.4.5. Key strategic moves and developments
7.4.6. Strategy share (%)
7.5. MEDTRONIC PLC
7.5.1. Company overview
7.5.2. Company snapshot
7.5.3. Operating business segments
7.5.4. Business performance
7.5.5. Key strategic moves and developments
7.5.6. Strategy share (%)
7.6. ORTHOFIX HOLDINGS, INC.
7.6.1. Company overview
7.6.2. Company snapshot
7.6.3. Operating business segments
7.6.4. Business performance
7.6.5. Key strategic moves and developments
7.6.6. Strategy share (%)
7.7. OSSUR
7.7.1. Company overview
7.7.2. Company snapshot
7.7.3. Operating business segments
7.7.4. Business performance
7.7.5. Key strategic moves and developments
7.7.6. Strategy share (%)
7.8. RETINA IMPLANT AG
7.8.1. Company overview
7.8.2. Company snapshot
7.8.3. Operating business segments
7.8.4. Business performance
7.8.5. Key strategic moves and developments
7.8.6. Strategy share (%)
7.9. SONOVA
7.9.1. Company overview
7.9.2. Company snapshot
7.9.3. Operating business segments
7.9.4. Business performance
7.9.5. Key strategic moves and developments
7.9.6. Strategy share (%)
7.10. SECOND SIGHT MEDICAL PRODUCTS, INC.
7.10.1. Company overview
7.10.2. Company snapshot
7.10.3. Operating business segments
7.10.4. Business performance
7.10.5. Key strategic moves and developments
7.10.6. Strategy share (%)
7.11. SYNCARDIA SYSTEMS, LLC
7.11.1. Company overview
7.11.2. Company snapshot
7.11.3. Operating business segments
7.11.4. Business performance
7.11.5. Key strategic moves and developments
7.11.6. Strategy share (%)
7.12. WILLIAM DEMANT HOLDING A/S
7.12.1. Company overview
7.12.2. Company snapshot
7.12.3. Operating business segments
7.12.4. Business performance
7.12.5. Key strategic moves and developments
7.12.6. Strategy share (%)
LIST OF TABLES
TABLE 1. NORTH AMERICA MEDICAL BIONICS MARKET, BY COUNTRY, 2016-2023($MILLION)
TABLE 2. GLOBAL MEDICAL BIONICS MARKET, BY TYPE, 2014-2022 ($MILLION)
TABLE 3. GLOBAL ORTHOPEDIC BIONICS MARKET, BY TYPE, 2014-2022 ($MILLION)
TABLE 4. GLOBAL EAR BIONICS MARKET, BY TYPE, 2014-2022 ($MILLION)
TABLE 5. GLOBAL CARDIAC BIONICS MARKET, BY TYPE, 2014-2022 ($MILLION)
TABLE 6. GLOBAL PACEMAKERS MARKET, BY TYPE, 2014-2022 ($MILLION)
TABLE 7. GLOBAL VADS MARKET, BY TYPE, 2014-2022 ($MILLION)
TABLE 8. GLOBAL ARTIFICIAL HEART VALVES MARKET, BY TYPE, 2014-2022 ($MILLION)
TABLE 9. GLOBAL NEURAL/BRAIN BIONICS MARKET, BY TYPE, 2014-2022 ($MILLION)
TABLE 10. GLOBAL INTERNAL NEURAL BIONICS MARKET, BY TYPE, 2014-2022 ($MILLION)
TABLE 11. GLOBAL MEDICAL BIONICS MARKET, BY REGION, 2014-2022 ($MILLION)
TABLE 12. NORTH AMERICA MEDICAL BIONICS MARKET, BY COUNTRY, 2014-2022 ($MILLION)
TABLE 13. EUROPE MEDICAL BIONICS MARKET, BY COUNTRY, 2014-2022 ($MILLION)
TABLE 14. ASIA-PACIFIC MEDICAL BIONICS MARKET, BY COUNTRY, 2014-2022 ($MILLION)
TABLE 15. LAMEA MEDICAL BIONICS MARKET, BY COUNTRY, 2014-2022 ($MILLION)
TABLE 16. GLOBAL VISION BIONICS MARKET, BY REGION, 2014-2022 ($MILLION)
TABLE 17. GLOBAL EAR BIONICS MARKET, BY REGION, 2014-2022 ($MILLION)
TABLE 18. GLOBAL ORTHOPEDIC BIONICS MARKET, BY REGION, 2014-2022 ($MILLION)
TABLE 19. GLOBAL CARDIAC BIONICS MARKET, BY REGION, 2014-2022 ($MILLION)
TABLE 20. GLOBAL NEURAL BIONICS MARKET, BY REGION, 2014-2022 ($MILLION)
TABLE 21. NORTH AMERICA MEDICAL BIONICS MARKET, BY TYPE, 2014-2022 ($MILLION)
TABLE 22. EUROPE MEDICAL BIONICS MARKET, BY TYPE, 2014-2022 ($MILLION)
TABLE 23. ASIA-PACIFIC MEDICAL BIONICS MARKET, BY TYPE, 2014-2022 ($MILLION)
TABLE 24. LAMEA MEDICAL BIONICS MARKET, BY TYPE, 2014-2022 ($MILLION)
TABLE 25. GLOBAL MEDICAL BIONICS MARKET, BY FIXATION, 2014-2022 ($MILLION)
TABLE 26. GLOBAL EXTERNAL BIONICS MARKET, BY TYPE, 2014-2022 ($MILLION)
TABLE 27. GLOBAL IMPLANTABLE BIONICS MARKET, BY TYPE, 2014-2022 ($MILLION)
TABLE 28. ABOTT: COMPANY SNAPSHOT
TABLE 29. ABOTT: OPERATING SEGMENTS
TABLE 30. BOSTON : COMPANY SNAPSHOT
TABLE 31. BOSTON : OPERATING SEGMENTS
TABLE 32. COCHLEAR : COMPANY SNAPSHOT
TABLE 33. COCHLEAR : OPERATING SEGMENTS
TABLE 34. LIVANOVA: COMPANY SNAPSHOT
TABLE 35. LIVANOVA: OPERATING SEGMENTS
TABLE 36. MEDTRONIC: COMPANY SNAPSHOT
TABLE 37. MEDTRONIC: OPERATING SEGMENTS
TABLE 38. ORTHOFIX: COMPANY SNAPSHOT
TABLE 39. ORTHOFIX: OPERATING SEGMENTS
TABLE 40. OSSUR: COMPANY SNAPSHOT
TABLE 41. OSSUR: OPERATING SEGMENTS
TABLE 42. RETINA: COMPANY SNAPSHOT
TABLE 43. RETINA: OPERATING SEGMENTS
TABLE 44. SONOVA: COMPANY SNAPSHOT
TABLE 45. SONOVA: OPERATING SEGMENTS
TABLE 46. SECOND SIGHT: COMPANY SNAPSHOT
TABLE 47. SECOND SIGHT: OPERATING SEGMENTS
TABLE 48. SYNCARDIA: COMPANY SNAPSHOT
TABLE 49. SYNCARDIA: OPERATING SEGMENTS
TABLE 50. WILLIAM: COMPANY SNAPSHOT
TABLE 51. WILLIAM: OPERATING SEGMENTS
LIST OF FIGURES
FIGURE 1. MEDICAL BIONICS MARKET SEGMENTATION
FIGURE 2. MARKET SHARE ANALYSIS, CARDIAC BIONICS, 2016
FIGURE 3. MARKET SHARE ANALYSIS, NEURAL/BRAIN BIONICS, 2016
FIGURE 4. MARKET SHARE ANALYSIS, EAR BIONICS MARKET, 2016
FIGURE 5. DISTRIBUTION OF DISABLING HEARING LOSS PATIENTS (%), 2012
FIGURE 6. CLINICAL TRIALS IN MEDICAL BIONICS MARKET, BY REGION
FIGURE 7. CLINICAL TRIALS FOR MEDICAL DEVICES (%)
FIGURE 8. U.S. MEDICAL BIONICS MARKET, 2016-2023($MILLION)
FIGURE 9. CANADA MEDICAL BIONICS MARKET, 2016-2023($MILLION)
FIGURE 10. MEXICO MEDICAL BIONICS MARKET, 2016-2023($MILLION)
FIGURE 11. GERMANY MEDICAL BIONICS MARKET, 2016-2023($MILLION)
FIGURE 12. FRANCE MEDICAL BIONICS MARKET, 2016-2023($MILLION)
FIGURE 13. UK MEDICAL BIONICS MARKET, 2016-2023($MILLION)
FIGURE 14. ITALY MEDICAL BIONICS MARKET, 2016-2023($MILLION)
FIGURE 15. SPAIN MEDICAL BIONICS MARKET, 2016-2023($MILLION)
FIGURE 16. REST OF EUROPE MEDICAL BIONICS MARKET, 2016-2023($MILLION)
FIGURE 17. LEADING CAUSES OF BLINDNESS IN JAPAN, 2013
FIGURE 18. JAPAN MEDICAL BIONICS MARKET, 2016-2023($MILLION)
FIGURE 19. CHINA MEDICAL BIONICS MARKET, 2016-2023($MILLION)
FIGURE 20. INDIA MEDICAL BIONICS MARKET, 2016-2023($MILLION)
FIGURE 21. AUSTRALIA MEDICAL BIONICS MARKET, 2016-2023($MILLION)
FIGURE 22. MALAYSIA MEDICAL BIONICS MARKET, 2016-2023($MILLION)
FIGURE 23. REST OF ASIA-PACIFIC MEDICAL BIONICS MARKET, 2016-2023($MILLION)
FIGURE 24. GLOBAL MEDICAL BIONICS MARKET, BY TYPE, 2014-2022 ($MILLION)
FIGURE 25. GLOBAL ORTHOPEDIC BIONICS MARKET, BY TYPE, 2014-2022 ($MILLION)
FIGURE 26. GLOBAL EAR BIONICS MARKET, BY TYPE, 2014-2022 ($MILLION)
FIGURE 27. GLOBAL CARDIAC BIONICS MARKET, BY TYPE, 2014-2022 ($MILLION)
FIGURE 28. GLOBAL PACEMAKERS MARKET, BY TYPE, 2014-2022 ($MILLION)
FIGURE 29. GLOBAL VADS MARKET, BY TYPE, 2014-2022 ($MILLION)
FIGURE 30. GLOBAL ARTIFICIAL HEART VALVES MARKET, BY TYPE, 2014-2022 ($MILLION)
FIGURE 31. GLOBAL NEURAL/BRAIN BIONICS MARKET, BY TYPE, 2014-2022 ($MILLION)
FIGURE 32. GLOBAL INTERNAL NEURAL BIONICS MARKET, BY TYPE, 2014-2022 ($MILLION)
FIGURE 33. GLOBAL MEDICAL BIONICS MARKET, BY REGION, 2014-2022 ($MILLION)
FIGURE 34. NORTH AMERICA MEDICAL BIONICS MARKET, BY COUNTRY, 2014-2022 ($MILLION)
FIGURE 35. EUROPE MEDICAL BIONICS MARKET, BY COUNTRY, 2014-2022 ($MILLION)
FIGURE 36. ASIA-PACIFIC MEDICAL BIONICS MARKET, BY COUNTRY, 2014-2022 ($MILLION)
FIGURE 37. LAMEA MEDICAL BIONICS MARKET, BY COUNTRY, 2014-2022 ($MILLION)
FIGURE 38. GLOBAL VISION BIONICS MARKET, BY REGION, 2014-2022 ($MILLION)
FIGURE 39. GLOBAL EAR BIONICS MARKET, BY REGION, 2014-2022 ($MILLION)
FIGURE 40. GLOBAL ORTHOPEDIC BIONICS MARKET, BY REGION, 2014-2022 ($MILLION)
FIGURE 41. GLOBAL CARDIAC BIONICS MARKET, BY REGION, 2014-2022 ($MILLION)
FIGURE 42. GLOBAL NEURAL BIONICS MARKET, BY REGION, 2014-2022 ($MILLION)
FIGURE 43. NORTH AMERICA MEDICAL BIONICS MARKET, BY TYPE, 2014-2022 ($MILLION)
FIGURE 44. EUROPE MEDICAL BIONICS MARKET, BY TYPE, 2014-2022 ($MILLION)
FIGURE 45. ASIA-PACIFIC MEDICAL BIONICS MARKET, BY TYPE, 2014-2022 ($MILLION)
FIGURE 46. LAMEA MEDICAL BIONICS MARKET, BY TYPE, 2014-2022 ($MILLION)
FIGURE 47. GLOBAL MEDICAL BIONICS MARKET, BY FIXATION, 2014-2022 ($MILLION)
FIGURE 48. GLOBAL EXTERNAL BIONICS MARKET, BY TYPE, 2014-2022 ($MILLION)
FIGURE 49. GLOBAL IMPLANTABLE BIONICS MARKET, BY TYPE, 2014-2022 ($MILLION)
FIGURE 50. BRAZIL MEDICAL BIONICS MARKET, 2016-2023($MILLION)
FIGURE 51. SOUTH AFRICA MEDICAL BIONICS MARKET, 2016-2023($MILLION)
FIGURE 52. SAUDI ARABIA MEDICAL BIONICS MARKET, 2016-2023($MILLION)
FIGURE 53. REST OF LAMEA MEDICAL BIONICS MARKET, 2016-2023($MILLION)
FIGURE 54. ABOTT: FINANCIALS
FIGURE 55. BOSTON : FINANCIALS
FIGURE 56. COCHLEAR : FINANCIALS
FIGURE 57. LIVANOVA: FINANCIALS
FIGURE 58. MEDTRONIC: FINANCIALS
FIGURE 59. ORTHOFIX: FINANCIALS
FIGURE 60. OSSUR: FINANCIALS
FIGURE 61. RETINA: FINANCIALS
FIGURE 62. SONOVA: FINANCIALS
FIGURE 63. SECOND SIGHT: FINANCIALS
FIGURE 64. SYNCARDIA: FINANCIALS
FIGURE 65. WILLIAM: FINANCIALS
Globally, chronic disease such as cardiac disorders, hearing loss, vision loss, and neural disorders, constitute a major proportion of health and economic burden as these increase the risk of organ failure. Hence, the development of bionics is a vital need so that these can imitate and perform the function of lost natural organ.
Upsurge in the incidence of chronic disease such as hearing and vision loss, which leads to the increased risk of organ failure, has led to high adoption of medical bionic. In addition, technological advancements such as use of cochlear implants and increase in government focus on funding R&D initiatives also led to market growth.
Rise in prevalence of chronic diseases coupled with the rapidly aging population worldwide is set to increase the demand for medical bionics. For instance, with increase in age, hearing loss, cardiac disorders become common among older adults. For instance, in 2013, the American Heart Association stated that 70.2% of men and 70.9% of women in the age group of 60–79 years suffered from cardiovascular disorders in the U.S.
Geographically, Asia-Pacific offers lucrative growth opportunity for the market due to increase in healthcare expenditure, rapid aging population, and rise in incidence of chronic disease. Thus, emerging economies (China and India) possess high potential for this market.
Start reading instantly.
This Report and over 67,404+ more Reports, Available with Avenue Library. T&C*.
Enterprise
License/PDF
Library
Membership
*Taxes/Fees, if applicable will be added during checkout. All prices in USD
To ensure high-level data integrity, accurate analysis, and impeccable forecasts
For complete satisfaction
On-demand customization of scope of the report to exactly meet your needs
Targeted market view to provide pertinent information and save time of readers
Get insights on topics that are crucial for your business. Stay abreast of your interest areas.
Get Industry Data AlertsTo ensure high-level data integrity, accurate analysis, and impeccable forecasts
For complete satisfaction
On-demand customization of scope of the report to exactly meet your needs
Targeted market view to provide pertinent information and save time of readers