
Medication Management Market Summary
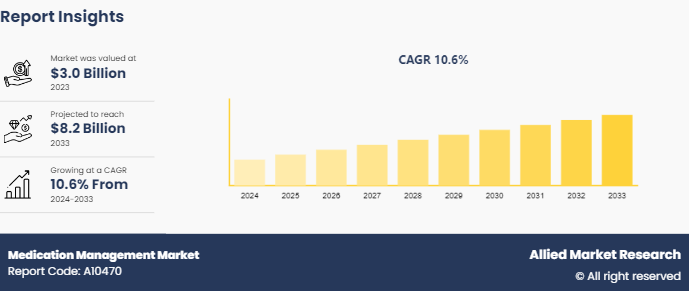
The global medication management market was valued at $3.0 billion in 2023 and is projected to reach $8.2 billion by 2033, growing at a CAGR of 10.6% from 2024 to 2033. The market is primarily driven by the increasing prevalence of chronic diseases, advancements in digital healthcare, the need to enhance medication safety, and the growing adoption of electronic health records (EHRs) and e-prescriptions.
Market Introduction and Overview
Medication management refers to a set of practices designed to optimize the use of medications, improve patient outcomes, and reduce the risks of medication errors, side effects, and non-compliance. These solutions include various tools and systems that support healthcare providers and patients in managing prescriptions, monitoring medication adherence, and ensuring the appropriate use of medications for individual conditions. The market encompasses software solutions, services, and delivery models that enable better medication management in hospitals, pharmacies, and other healthcare settings.
The growing need for more efficient and accurate medication management stems from the rising global burden of chronic conditions, the increasing complexity of polypharmacy, and the growing aging population. As healthcare systems continue to digitalize, advanced medication management systems—integrating AI, machine learning, and real-time analytics—are helping healthcare professionals make more informed decisions, reduce human errors, and improve patient safety.
Key Takeaways
- The medication management market analysis covers 20 countries, offering a detailed breakdown of the market value for each region from 2024 to 2033. This geographical assessment helps identify regional growth patterns, demand trends, and competitive dynamics, providing a clear picture of the market's performance in both developed and emerging economies.
- Over 1,500 sources were reviewed for this study, including product literatures, company press releases, annual reports, and regulatory filings from key players in the medication management industry. In addition, credible sources such as industry journals, government healthcare websites, and trade association reports were analyzed to ensure the data's accuracy and reliability.
- The research integrates high-quality quantitative data, expert opinions, and independent analyses to provide a balanced and in-depth view of the global medication management market. This comprehensive approach equips stakeholders, including investors, manufacturers, and healthcare providers, with the insights they need to make strategic, growth-oriented decisions.
Key Market Dynamics
The medication management market is driven by a combination of factors such as rising medication errors, technological advancements, growing healthcare digitalization, and increasing patient safety concerns. The adoption of medication management solutions is influenced by the need to reduce adverse drug events (ADEs), ensure medication adherence, and optimize treatment outcomes. In addition, evolving healthcare regulations and a focus on improving healthcare delivery efficiency are shaping adoption trends and investment decisions across regions.
Drivers
The medication management market is primarily driven by the increasing global incidence of chronic diseases such as diabetes, cardiovascular diseases, and respiratory conditions. These diseases often require complex medication regimens, leading to a higher risk of medication errors and non-adherence. As healthcare systems move toward digitization, there is an increased demand for tools that improve medication safety, ensure accurate prescriptions, and monitor patient adherence in real time.
Technological advancements, particularly in clinical decision support systems (CDSS), medication analytics, and automated dispensing systems, have significantly enhanced the efficiency and accuracy of medication management. These technologies help healthcare providers make better prescribing decisions, detect potential drug interactions, and reduce human error.
Another key driver is the increasing emphasis on improving patient outcomes through better medication adherence. Solutions such as smart pill dispensers, medication reminder systems, and AI-driven analytics are helping patients stick to prescribed regimens, ultimately reducing hospital readmissions and healthcare costs. Moreover, the widespread adoption of electronic health records (EHRs) and e-prescribing platforms is facilitating better coordination between healthcare providers, further driving the demand for medication management solutions.
Restraints
Despite the favorable factors, the medication management market faces several constraints. High implementation costs for advanced systems, particularly in smaller healthcare facilities, pose a significant barrier to adoption. The upfront expenses for software, training, and integration with existing healthcare systems can be prohibitive, especially in low- and middle-income regions.
In addition, concerns over data security and patient privacy in digital medication management systems remain a challenge. The handling of sensitive medical data requires robust cybersecurity measures to prevent breaches and comply with regulations such as HIPAA.
Resistance to change from healthcare providers and patients, as well as the complexity of integrating new technologies with legacy systems, can also slow market growth.
Opportunities
The medication management market offers substantial growth opportunities, particularly through the integration of artificial intelligence, machine learning, and cloud-based solutions. AI-driven medication management systems can offer predictive analytics and personalized treatment recommendations, significantly improving patient outcomes.
Expanding healthcare access in emerging markets, coupled with increasing investments in affordable digital health solutions, is opening new revenue streams. As governments and healthcare providers continue to prioritize patient safety and care efficiency, the demand for innovative medication management solutions is expected to increase rapidly in the coming years.
Analysis of the Medication Management Market Opportunity
Medication management apps have witnessed significant growth and adoption in recent years, driven by the increasing demand for efficient healthcare solutions. The rise in the aging population globally and the trend towards polypharmacy have contributed to the proliferation of medication management apps. In 2019 alone, the number of pill reminders and medication trackers reached 328 apps, reflecting the growing recognition of their importance in healthcare.
These apps cater to a diverse range of users, including patients with severe health conditions, seniors prone to missing pill intake times, and caregivers responsible for managing prescriptions for others. The benefits of medication management apps include improved medication adherence, enhanced patient safety, and simplified medication planning and dosage management.
In terms of functionality, medication management apps typically fall into two main categories: medication reminders and medication managers. Reminders ensure timely pill intake through customizable notifications, while managers offer advanced features such as medication adherence tracking and interaction checking.
Overall, medication management apps offer a comprehensive solution for streamlining the medication intake process and promoting better health outcomes for users.
Most Popular Healthcare Apps
Percentage of Global App Users That Used the Following Apps, 2021 | Percentage |
Fitness | 59% |
Diet or Nutrition | 52% |
Symptom Navigator | 36% |
Patient Portal App | 28% |
Health/Condition Tracker | 25% |
Medical Tracker/Reminder/Manager | 12% |
Chronic Condition/Disease Manager | 10% |
A pill reminder app is a tool designed to notify individuals when to take specific medications, enhancing medication adherence and safety. Research suggests that participants delay medication intake 80–85% of the time and forget to take it 44–46% of the time, contributing to an estimated 125, 000 deaths annually. These apps, part of medication management solutions, aim to mitigate such risks and improve health outcomes.
The table below compares the different pill reminder apps according to their pros and cons, consumer ratings, and cost
App Name | Key Features | Pros | Cons | App Store Rating | Cost |
MediSafe | Sharing Reminders | Multiple Features | Cost For Premium Version | 4.7/5 | Basic: free Premium: $4.99/month |
Dorecast | Flexibility | Medication Management Features | Cost For Premium Version | 4.2/5 | free in-app purchases from $3.99 |
CareClinic | Symptom Tracking | Information Share Feature | Only Available on Android | 4.2/5 | free in-app purchases from £1.99 |
Pillboxie | Visual Displays | Ease Of Use | Limited Features | 3.7/5 | $1.99 |
Lady Pill Reminder | Birth Control Reminder | Automatic Pause Feature | Limited to Birth Control | 4.6/5 | free upgrade from $2.99 |
MedManage | iOS | Ease Of Use | Prone To Glitches | 4.2/5 | free |
Care4Today | Pill Identification | Notifications For Caregivers | Lack Of Health Tracking | 3.5/5 | free |
RoundHealth | Simplicity | Ease Of Use | No Health Tracking | 4.4/5 | free |
Market Segmentation
The medication management market is segmented into software, service, mode of delivery, end user, and region. On the basis of software, the market is divided into computerized physician order, clinical decision support system solutions, inventory management software, administration software, automated dispensing systems, assurance system software, and other software. On the basis of service, the market is divided into medication analytics, point-of-care verification, and ADE surveillance. On the basis of mode of delivery, the market is divided into on-premises, web-based, and cloud-based. On the basis of end user, the market is divided into hospitals, pharmacy, and others. Region wise, the medication management marketis analyzed across North America, Europe, Asia-Pacific, and LAMEA.
The medication management market shows varied growth trends across these segments. By software, clinical decision support systems and automated dispensing systems are widely adopted for their ability to reduce medication errors and improve prescribing accuracy. In the services segment, medication analytics is gaining momentum as healthcare providers increasingly focus on real-time data to enhance patient care and medication adherence. Cloud-based delivery models are becoming more popular due to their flexibility, lower upfront costs, and ability to integrate seamlessly with other healthcare technologies.
Regional Insights
North America dominates the medication management market, driven by its advanced healthcare infrastructure, high adoption of electronic health records (EHRs), and favorable reimbursement policies. Europe follows closely, with strong healthcare systems and a growing focus on medication safety. Asia-Pacific is projected to experience the fastest growth due to the increasing prevalence of chronic diseases, expanding healthcare access, and government-supported initiatives to enhance digital health adoption. The LAMEA region is gradually emerging, with improving healthcare infrastructure and growing investments in digital health solutions boosting market expansion in the area.
Country Market Outlook
Medication management apps in the U.S. have experienced significant growth, particularly with the evolving changes in healthcare delivery and the rising demand for pharmaceutical services. The convenience of ordering and receiving medications directly at home has led more consumers to turn to these apps, especially in response to challenges such as the COVID-19 pandemic.
The growing trend is reflected in the statistics, with over 300,000 health-related apps available on smartphones by January 2024, including those specifically designed to manage medication reminders and related services.
Several key players are shaping the competitive landscape of medication delivery apps in the U.S. Notably, CVS Pharmacy stands out as a dominant American-based company, serving over 9,000 locations across the country and providing a seamless ordering and delivery experience. The app holds a solid 4.3-star rating on the Google Play Store. NowRx has also made an impact by offering same-day, free medicine delivery, using emerging technologies to enhance customer experience and efficiency.
PillPack, owned by Amazon, has revolutionized medication delivery by organizing prescriptions into personalized doses, streamlining the process for users. Other notable players such as NetMeds, 1MG, Medlife, and RiteAid offer various additional services, including free consultations, pharmaceutical discounts, and an extensive range of healthcare products.
Who Are the Primary End Users Driving Market Adoption?
The primary end users driving the adoption of medication management solutions are hospitals, pharmacies, and other healthcare providers such as long-term care facilities, clinics, and specialized healthcare centers. Hospitals are among the largest end users of medication management systems, as they need to ensure the safe and accurate administration of a high volume of medications across various departments.
Pharmacies are another significant end user, adopting medication management tools to manage inventory, improve prescription accuracy, and offer medication counseling services. Clinics and long-term care facilities are increasingly adopting medication management software to improve patient safety and reduce medication-related errors.
What Are the Latest Industry Trends in the Medication Management Market?
The medication management market is evolving rapidly, with several key trends shaping its future. One of the most prominent trends is the shift toward cloud-based solutions, which offer flexibility, scalability, and reduced upfront costs compared to on-premises systems. Cloud-based platforms also provide better interoperability, allowing healthcare providers to access medication data from multiple locations and systems, improving the coordination of care.
Another key trend is the increased integration of artificial intelligence (AI) and machine learning technologies into medication management systems. Machine learning algorithms also assist in drug-drug interaction checks, identifying potential risks before medication errors occur.
How Is Artificial Intelligence Impacting the Medication Management Market?
Artificial intelligence is revolutionizing the medication management market by enabling smarter, more efficient systems that enhance both clinical and operational outcomes. AI-powered clinical decision support systems (CDSS) can analyze patient data and provide real-time alerts for drug interactions, allergies, and contraindications, significantly reducing the likelihood of medication errors. AI is also being leveraged to predict medication adherence.
Machine learning algorithms are being used to improve the accuracy of medication dispensing and ordering. By analyzing past prescriptions, they can help identify the most appropriate medications for a given condition or patient profile.
What Innovations Are Shaping the Medication Management Industry?
The medication management market is witnessing several innovations that are enhancing medication safety, adherence, and overall patient care. One of the most significant innovations is the development of smart medication dispensers. These devices automatically dispense the correct dose of medication at the right time, helping patients adhere to their prescribed regimens.
Another key innovation is the integration of Internet of Things (IoT) technology into medication management systems. IoT-enabled devices, such as smart pill bottles or connected medication reminders, allow healthcare providers to track patient adherence in real time. Blockchain technology is also emerging as a potential solution for improving the security and transparency of medication data.
Competitive Landscape
The medication management market is highly competitive, featuring a blend of established global players and specialized solution providers that focus on innovative medication safety and adherence technologies. Major companies leading the market include Allscripts, QuadraMed Affinity Corporation, Becton Dickinson, Cerner Corporation, CareFusion, McKesson Corporation, GE Healthcare, Omnicell, Inc., and Talyst, LLC. These companies offer a comprehensive range of solutions, including electronic health records (EHR), clinical decision support systems (CDSS), automated dispensing systems, and medication inventory management software.
In addition to these key players, several smaller companies are gaining traction by focusing on specialized services such as mobile medication management apps, patient adherence solutions, and advanced medication analytics. Many firms in this market are concentrating on the integration of artificial intelligence (AI), cloud-based platforms, and real-time data analytics to improve medication safety, streamline workflows, and enhance patient outcomes.
Recent Key Strategies and Developments
- In May 2024, Together by Renee introduced the Find My Meds feature to tackle the ongoing shortage of GLP-1 medications, a significant challenge for millions of individuals managing diabetes. Utilizing advanced AI technology, the platform automates the medication refill process by checking the availability of prescriptions at nearby pharmacies and, if needed, transferring them to other locations.
- In May 2024, Zafe Care Systems, a partner of iZafe Group, secured a contract with Kristianstad Municipality for the supply of 150-190 units of iZafe’s Dosell medication dispensers. Valued between 3.7 and 4.3 MSEK, the contract, which spans from 2024 to 2028, aims to improve patient safety and independence by ensuring medications are delivered on time.
Industry Trends
- In May 2024, Monash University introduced a new microcredential, the MMR Training Program, preparing registered pharmacists across Australia to conduct Medication Management Reviews in various healthcare settings, particularly in aged care facilities. Developed by the Faculty of Pharmacy and Pharmaceutical Sciences, this program aims to enhance medication management skills, contributing to improved outcomes for patients, especially older Australians.
- In March 2024, the study published in McKnight’s Senior Living, a national media brand providing news, highlighted the efficiency of using automated medication dispensing cabinets in long-term care facilities, with retrieval time for emergency medications reduced by 71%. Nurses favored the medbox solution, emphasizing the importance of timely medication delivery in complex care settings. These findings emphasized the significance of automation in enhancing patient care and addressing labor challenges in medication management.
Key Sources Referred
- World Health Organization (WHO)
- National Institutes of Health (NIH)
- National Library of Medicine
- BioMed Central Ltd
Key Benefits For Stakeholders
- This report presents a comprehensive quantitative analysis of the medication management market, including insights into market segments, current trends, forecasts, and dynamics from 2024 to 2033. It aims to identify key opportunities within the medication management industry.
- The medication management market research provides valuable information on the key drivers, challenges, and opportunities shaping the industry. A Porter’s Five Forces analysis is included to assess the bargaining power of buyers and suppliers, helping stakeholders make informed, profit-driven decisions and strengthen their relationships within the supply chain.
- The detailed market segmentation analysis further highlights existing market opportunities, aiding in strategic decision-making. Major countries across different regions are mapped based on their contribution to global medication management market revenue.
- The medication management market report also offers insights into the positioning of key market players, facilitating performance benchmarking and providing a clear understanding of their current market standings.
Medication Management Market Report Highlights
| Aspects | Details |
| Market Size By 2033 | USD 8.2 Billion |
| Growth Rate | CAGR of 10.6% |
| Forecast period | 2024 - 2033 |
| Report Pages | 310 |
| By Software |
|
| By Service |
|
| By Mode Of Delivery |
|
| By End User |
|
| By Region |
|
| Key Market Players | QuadraMed Corporation, Allscripts, GE Healthcare, Affinity Corporation, McKesson Corporation, Omnicell, Inc., Becton, Cerner Corporation, TALYST, LLC., Carefusion |
Analyst Review
The medication management market is trending towards digital solutions, AI-driven platforms, telemedicine integration, and patient-centric approaches to enhance medication adherence and healthcare efficiency globally.
The medication analytics sub-segment is estimated to show the fastest growth during the forecast period.
North America accounted for the highest share in the medication management market.
The global medication management market is estimated to reach $8.2 billion by 2033.
The top companies to hold the major share in medication management are Allscripts, QuadraMed Affinity Corporation, Becton, Cerner Corporation, CareFusion, McKesson Corporation, GE Healthcare, Omnicell, Inc., and Talyst, LLC.
Loading Table Of Content...

