0
2021
Metal Furniture Market

Metal Furniture Market

by Type (Bed, Sofa, Chair, Table, and Others), Application (Commercial and Residential), and Distribution Channel (Direct distribution, Supermarket/Hypermarket, Specialty Stores, and E-Commerce): Global Opportunity Analysis and Industry Forecast 2021-2028

Report Code: A11417
Jun 2021 | Pages: 288
Tables: 124
Charts: 45
  • Formats*:

  • pdf

    Single User License, Five User
    License & Enterprise User License

  • xls

    Data Pack Excel License

  • ppt

    It comes with the additional cost
    of $2500.00 contact sales.


COVID-19

Pandemic disrupted the entire world and affected many industries.

Get detailed COVID-19 impact analysis on the Metal Furniture Market

Request Now !

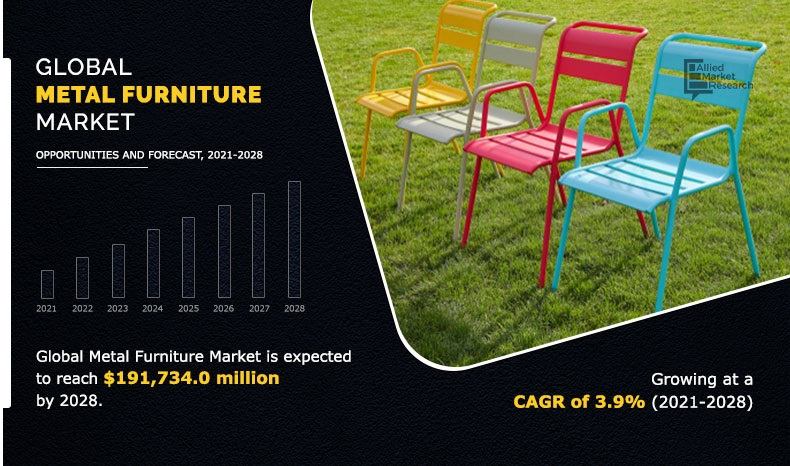
The global metal furniture market size was valued at $141,444.0 million in 2020, and is projected to reach $191,734.0 million by 2028, registering a CAGR of 3.9% from 2021 to 2028.

Metal furniture is a common decor installed across places such as offices, hotels, houses, restaurants, stores, and libraries. The products include metal framed beds, chairs, tables, and metal framed sofas. Manufacturers in this metal furniture market is engaged in delivering eco-friendly furniture. This implies use of recycled items such as salvaged wood, reused wood pallets, and natural materials such as sea-grass and bamboos. The trend of eco-friendly furniture is gaining traction in the furniture industry. Furthermore, the metal furniture market is expected to show growth in potential countries such as the U.S., Germany, and China. 

Global-Metal-Furniture-Market

Rise in standard of living and development in real estate drives growth of the market. In addition, growth in the real estate industry leads to increase in construction of residential and commercial institutes such as hotels, hospitals, homes, flats, and offices. Therefore, increase in residential and commercial institutes leads to rise in demand for installation of furniture. This contributes to growth of the global metal furniture market share. Furthermore, furniture industries have also started gaining traction in the metal furniture market, owing to factors such as technological advancements and customization. Technological advancements include digitally operated furniture and smart apps that display virtual suggestion of decor for a room. Whereas, customization of furniture stands for production of furniture according to requirement of customer. 

The COVID-19 pandemic has adversely affected the metal furniture business. Due to worldwide lockdowns, manufacturing units were temporarily shut, resulting a loss in production and sales. This lockdown was implemented to avoid further spread of coronavirus. Furthermore, construction of infrastructure was also temporarily closed. This reduced demand for metal furniture to a great extent in the market. In addition, customers focused more on their health and safety, which further reduced the trend of metal furniture in the market. 

According to the global metal furniture market analysis, the market is segmented by type, application, distribution channel, and region. On the basis of type, the market is categorized into bed, sofa, chair, table, and others. On the basis of application, it is segmented into commercial and residential. By distribution channel, it is segregated into direct distribution, supermarket/hypermarket, specialty stores, and e-commerce. Region-wise, it is analyzed across North America (the U.S., Canada, and Mexico), Europe (Germany, the UK, France, Italy, Spain and rest of Europe), Asia-Pacific (China, India, Japan, Australia, South Korea, and rest of Asia-Pacific), and LAMEA (Latin America, the Middle East, and Africa)

By type, the bed segment was the largest contributor to the growth of the metal furniture market during 2020. This attributes to the fact that demand for metal beds is on the rise in residential and commercial institutes such as homes, hotels, and hospitals. However, the table segment is expected to be the fastest growing segment according to the global metal furniture market forecast. This is attributed to rise in number of offices and commercial establishments, where tables are essential. 

Metal Furniture Market
By Type

Your browser does not support the canvas element.

The table metal furniture segment is the fastest growing segment of Global Metal Furniture Market

Get more information on this report : Request Sample Pages

On the basis of application, the residential segment was the highest contributor to the market growth during 2020. This is attributed to increase in standard of living that influence customers to invest more on home decor and customized furniture. Furthermore, the commercial segment is expected to be the fastest growing segment during the forecast period, owing to growth in number of restaurants, offices, schools, and hospitals. 

Metal Furniture Market
By Application

Your browser does not support the canvas element.

Commercial metal furniture segment is the fastest growing segment of Global Metal Furniture Market

Get more information on this report : Request Sample Pages

By distribution channel, the specialty store segment was the largest contributor to the growth of metal furniture market during 2020. Specialty stores include showrooms and retail shops in which customers get customized services. In addition, specialty stores stock selective best models. This allows customers to choose right product easily from sorted stock. Hence, these factors propel growth of the segment. On the contrary, the direct distribution segment is expected to be the fastest growing segment during the forecast period, owing to the fact that it allows direct interaction between customer and manufacturer. Through direct interaction, any communication barrier is eliminated, which helps in delivery of ideal customized furniture to customers. 

Metal Furniture Market
By Distribution Channel

Your browser does not support the canvas element.

The direct distribution segment is the fastest growing segment of Global Metal Furniture Market

Get more information on this report : Request Sample Pages

Region-wise, Asia-Pacific was the highest contributor the global metal furniture market growth during 2020. This is attributed to gradual increase in urbanization, population growth, and rise in number of nuclear families. Whereas, North America is expected to be the fastest growing segment during the forecast period, owing to rise in standard of living and increase in demand for customized furniture. 

Metal Furniture Market
By Region

2028
Asia-pacific 
North America
Europe
LAMEA

North America segment is the fastest growing segment of Global Metal Furniture Market

Get more information on this report : Request Sample Pages

Key players in the global metal furniture market rely on strategies such as product launch and innovation for business expansion. These strategies are adopted to maintain dominance of the industry. Key players in the global metal furniture industry profiled in the report include Chyuan Chern Furniture Co., Ltd., Cymax Group Inc., DHP Furniture, Godrej Furniture, Hillsdale Furniture, Inter IKEA systems B.V., Meco Corporation, Oliver Metal Furniture, Simpli Home, and Zinus. 

Key Benefits For Stakeholders

  •  The report provides a quantitative analysis of the current global metal furniture market trends, estimations, and dynamics of the metal furniture market from 2020 to 2028 to identify the prevailing opportunities.
  •  Porter’s five forces analysis highlights potency of buyers and suppliers to enable stakeholders to make profit-oriented business decisions and strengthen their supplier–buyer network.
  •  In-depth analysis and the market trends and segmentation assists to determine the prevailing global metal furniture market opportunities.
  •  The major countries in each region are mapped according to their revenue contribution to the metal furniture market. 
  •  The market player positioning segment facilitates benchmarking and provides a clear understanding of the present position of the market players in the industry.

Key Market Segments

 By Type

  •  Bed
  •  Sofa
  •  Chair 
  •  Table
  •  Others

 By Application:

  •  Commercial 
  •  Residential 

 By Distribution Channel:

  •  Direct distribution
  •  Supermarket/Hypermarket
  •  Specialty Stores
  •  E-commerce

 By Region

  •  North America
  •  Europe
  •  Asia-Pacific
  •  LAMEA

Metal Furniture Market Report Highlights

Aspects Details
By TYPE
  • Bed
  • Sofa
  • Chair
  • Table
  • Others
By APPLICATION
  • Commercial
  • Residential
By DISTRIBUTION CHANNEL
  • Direct Distribution
  • Supermarket/Hypermarket
  • Specialty Stores
  • E-Commerce
By Region
  • North America  (U.S., Canada, Mexico)
  • Europe  (France, Germany, Italy, Spain, UK, Russia, Rest of Europe)
  • Asia-Pacific  (China, Japan, India, South Korea, Australia, Thailand, Malaysia, Indonesia, Rest of Asia-Pacific)
  • LAMEA  (Brazil, South Africa, Saudi Arabia, UAE, Argentina, Rest of LAMEA)
Key Market Players Godrej Interio, Cymax Group Inc., Simpli Home, Meco Corporation, Chyuan Chern Furniture Co., Ltd., Oliver Metal Furniture, Hillsdale Furniture, Zinus, Inter IKEA Systems B.V., DHP Furniture
 

CHAPTER 1:INTRODUCTION

1.1.Report description
1.2.KEY BENEFITS FOR STAKEHOLDERS
1.3.Key market Segments
1.4.Research Methodology

1.4.1.Primary Research
1.4.2.Secondary Research
1.4.3.Analyst tools and models

CHAPTER 2:EXECUTIVE SUMMARY

2.1.Key findings of the study
2.2.CXO Perspective

CHAPTER 3:MARKET OVERVIEW

3.1.Market definition and scope
3.2.Key findings

3.2.1.Top investment pockets

3.3.Porter’s five forces analysis

3.3.1.Bargaining power of suppliers
3.3.2.Bargaining power of buyers
3.3.3.Threat of substitution
3.3.4.Threat of new entrants
3.3.5.Intensity of competitive rivalry

3.4.Market Dynamics

3.4.1.Drivers

3.4.1.1.Increase in consumer interest towards home decor
3.4.1.2.Rapid growth of online retail platform
3.4.1.3.Increase in the number of offices

3.4.2.Restraints

3.4.2.1.Increase in cost of raw materials

3.4.3.Opportunities

3.4.3.1.Increasing standard of living due to rise in the disposable income
3.4.3.2.Emergence of customized furniture and technology

3.5. COVID-19 impact analysis

CHAPTER 4: METAL FURNITURE MARKET, BY TYPE

4.1.Overview

4.1.1.Market size and forecast, by type

4.2.Bed

4.2.1.Key market trends, growth factors and opportunities
4.2.2.Market size and forecast, by region
4.2.3.Market analysis, by country

4.3.Sofa

4.3.1.Key market trends, growth factors and opportunities
4.3.2.Market size and forecast, by region
4.3.3.Market analysis, by country

4.4.Chair

4.4.1.Key market trends, growth factors and opportunities
4.4.2.Market size and forecast, by region
4.4.3.Market analysis, by country

4.5.Table

4.5.1.Key market trends, growth factors and opportunities
4.5.2.Market size and forecast, by region
4.5.3.Market analysis, by country

4.6.Others

4.6.1.Key market trends, growth factors and opportunities
4.6.2.Market size and forecast, by region
4.6.3.Market analysis, by country

CHAPTER 5: METAL FURNITURE MARKET, BY APPLICATION

5.1.Overview

5.1.1.Market size and forecast, by application

5.2.Commercial

5.2.1.Key market trends, growth factors and opportunities
5.2.2.Market size and forecast, by region
5.2.3.Market analysis, by country

5.3.Residential

5.3.1.Key market trends, growth factors and opportunities
5.3.2.Market size and forecast, by region
5.3.3.Market analysis, by country

CHAPTER 6: METAL FURNITURE MARKET, BY DISTRIBUTION CHANNEL

6.1.Overview

6.1.1.Market size and forecast, by distribution channel

6.2.Direct Distribution

6.2.1.Key market trends, growth factors and opportunities
6.2.2.Market size and forecast, by region
6.2.3.Market analysis, by country

6.3.Supermarket/Hypermarket

6.3.1.Key market trends, growth factors and opportunities
6.3.2.Market size and forecast, by region
6.3.3.Market analysis, by country

6.4.Specialty Stores

6.4.1.Key market trends, growth factors and opportunities
6.4.2.Market size and forecast, by region
6.4.3.Market analysis, by country

6.5.E-Commerce

6.5.1.Key market trends, growth factors and opportunities
6.5.2.Market size and forecast, by region
6.5.3.Market analysis, by country

CHAPTER 7: METAL FURNITURE MARKET, BY REGION

7.1.Overview

7.1.1.Market size and forecast, by region

7.2.North America

7.2.1.Key market trends, growth factor and opportunities
7.2.2.Market size and forecast, by type
7.2.3.Market size and forecast, by application
7.2.4.Market size and forecast, by distribution channel
7.2.5.Market size and forecast, by Country

7.2.5.1.U.S.

7.2.5.1.1.Market size and forecast, by type
7.2.5.1.2.Market size and forecast, by application
7.2.5.1.3.Market size and forecast, by distribution channel

7.2.5.2.Canada

7.2.5.2.1.Market size and forecast, by type
7.2.5.2.2.Market size and forecast, by application
7.2.5.2.3.Market size and forecast, by distribution channel

7.2.5.3.Mexico

7.2.5.3.1.Market size and forecast, by type
7.2.5.3.2.Market size and forecast, by application
7.2.5.3.3.Market size and forecast, by distribution channel

7.3.Europe

7.3.1.Key market trends, growth factor and opportunities
7.3.2.Market size and forecast, by type
7.3.3.Market size and forecast, by application
7.3.4.Market size and forecast, by distribution channel
7.3.5.Market size and forecast, by Country

7.3.5.1.Germany

7.3.5.1.1.Market size and forecast, by type
7.3.5.1.2.Market size and forecast, by application
7.3.5.1.3.Market size and forecast, by distribution channel

7.3.5.2.UK

7.3.5.2.1.Market size and forecast, by type
7.3.5.2.2.Market size and forecast, by application
7.3.5.2.3.Market size and forecast, by distribution channel

7.3.5.3.France

7.3.5.3.1.Market size and forecast, by type
7.3.5.3.2.Market size and forecast, by application
7.3.5.3.3.Market size and forecast, by distribution channel

7.3.5.4.Italy

7.3.5.4.1.Market size and forecast, by type
7.3.5.4.2.Market size and forecast, by application
7.3.5.4.3.Market size and forecast, by distribution channel

7.3.5.5.Spain

7.3.5.5.1.Market size and forecast, by type
7.3.5.5.2.Market size and forecast, by application
7.3.5.5.3.Market size and forecast, by distribution channel

7.3.5.6.Rest of Europe

7.3.5.6.1.Market size and forecast, by type
7.3.5.6.2.Market size and forecast, by application
7.3.5.6.3.Market size and forecast, by distribution channel

7.4.Asia-Pacific

7.4.1.Key market trends, growth factor and opportunities
7.4.2.Market size and forecast, by type
7.4.3.Market size and forecast, by application
7.4.4.Market size and forecast, by distribution channel
7.4.5.Market size and forecast, by Country

7.4.5.1.China

7.4.5.1.1.Market size and forecast, by type
7.4.5.1.2.Market size and forecast, by application
7.4.5.1.3.Market size and forecast, by distribution channel

7.4.5.2.India

7.4.5.2.1.Market size and forecast, by type
7.4.5.2.2.Market size and forecast, by application
7.4.5.2.3.Market size and forecast, by distribution channel

7.4.5.3.Japan

7.4.5.3.1.Market size and forecast, by type
7.4.5.3.2.Market size and forecast, by application
7.4.5.3.3.Market size and forecast, by distribution channel

7.4.5.4.Australia

7.4.5.4.1.Market size and forecast, by type
7.4.5.4.2.Market size and forecast, by application
7.4.5.4.3.Market size and forecast, by distribution channel

7.4.5.5.South Korea

7.4.5.5.1.Market size and forecast, by type
7.4.5.5.2.Market size and forecast, by application
7.4.5.5.3.Market size and forecast, by distribution channel

7.4.5.6.Rest of Asia-Pacific

7.4.5.6.1.Market size and forecast, by type
7.4.5.6.2.Market size and forecast, by application
7.4.5.6.3.Market size and forecast, by distribution channel

7.5.LAMEA

7.5.1.Key market trends, growth factor and opportunities
7.5.2.Market size and forecast, by type
7.5.3.Market size and forecast, by application
7.5.4.Market size and forecast, by distribution channel
7.5.5.Market size and forecast, by Country

7.5.5.1.Latin America

7.5.5.1.1.Market size and forecast, by type
7.5.5.1.2.Market size and forecast, by application
7.5.5.1.3.Market size and forecast, by distribution channel

7.5.5.2.Middle East

7.5.5.2.1.Market size and forecast, by type
7.5.5.2.2.Market size and forecast, by application
7.5.5.2.3.Market size and forecast, by distribution channel

7.5.5.3.Africa

7.5.5.3.1.Market size and forecast, by type
7.5.5.3.2.Market size and forecast, by application
7.5.5.3.3.Market size and forecast, by distribution channel

CHAPTER 8:COMPETITION LANDSCAPE

8.1.TOP WINNING STRATEGIES, BY YEAR, 2018–2021*202
8.2.TOP WINNING STRATEGIES, BY DEVELOPMENT, 2018–2021* (%)202
8.3.TOP WINNING STRATEGIES, BY COMPANY, 2018–2021*203
8.4.Product Mapping of Top 10 Key players
8.5.Competitive dashboard of Top 10 Key Players
8.6.Competitive heat map of Top 10 Key Players

CHAPTER 9:COMPANY PROFILES210

9.1.Chyuan Chern Furniture Co., Ltd.

9.1.1.Company overview
9.1.2.Company snapshot
9.1.3.Operating business segments
9.1.4.Product portfolio
9.1.5.Key strategic moves and developments

9.2.Cymax Group Inc.

9.2.1.Company overview
9.2.2.Key Executives
9.2.3.Company snapshot
9.2.4.Operating business segments
9.2.5.Product portfolio
9.2.6.Key strategic moves and developments

9.3.DHP Furniture

9.3.1.Company overview
9.3.2.Key Executives
9.3.3.Company snapshot
9.3.4.Operating business segments
9.3.5.Product portfolio

9.4.Godrej Interio

9.4.1.Company overview
9.4.2.Key Executives
9.4.3.Company snapshot
9.4.4.Operating business segments
9.4.5.Product portfolio
9.4.6.Key strategic moves and developments

9.5.Hillsdale Furniture

9.5.1.Company overview
9.5.2.Key Executive
9.5.3.Company snapshot
9.5.4.Operating business segments
9.5.5.Product portfolio

9.6.Inter IKEA Systems B.V.

9.6.1.Company overview
9.6.2.Key Executives
9.6.3.Company snapshot
9.6.4.Operating business segments
9.6.5.Business performance
9.6.6.Product portfolio
9.6.7.Key strategic moves and developments

9.7.Meco Corporation

9.7.1.Company overview
9.7.2.Key Executives
9.7.3.Company snapshot
9.7.4.Operating business segments
9.7.5.Product portfolio

9.8.Oliver Metal Furniture

9.8.1.Company overview
9.8.2.Key Executives
9.8.3.Company snapshot
9.8.4.Product portfolio
9.8.5.Key strategic moves and developments

9.9.Simpli Home

9.9.1.Company overview
9.9.2.Key Executive
9.9.3.Company snapshot
9.9.4.Operating business segments
9.9.5.Product portfolio
9.9.6.Key strategic moves and developments

9.10.Zinus

9.10.1.Company overview
9.10.2.Key Executive
9.10.3.Company snapshot
9.10.4.Operating business segments
9.10.5.Product portfolio
9.10.6.Key strategic moves and developments

LIST OF TABLES

TABLE 01.GLOBAL METAL FURNITURE MARKET REVENUE, BY TYPE, 2020-2028 ($MILLION)
TABLE 02.BED GLOBAL METAL FURNITURE MARKET, BY REGION, 2020–2028 ($MILLION)
TABLE 03.SOFA GLOBAL METAL FURNITURE MARKET, BY REGION, 2019–2027 ($MILLION)
TABLE 04.CHAIR GLOBAL METAL FURNITURE MARKET, BY REGION, 2020–2028 ($MILLION)
TABLE 05.TABLE GLOBAL METAL FURNITURE MARKET, BY REGION, 2020–2028 ($MILLION)
TABLE 06.OTHERS GLOBAL METAL FURNITURE MARKET, BY REGION, 2020–2028 ($MILLION)
TABLE 07.GLOBAL METAL FURNITURE MARKET REVENUE, BY APPLICATION, 2020-2028 ($MILLION)
TABLE 08.COMMERCIAL GLOBAL METAL FURNITURE MARKET, BY REGION, 2020–2028 ($MILLION)
TABLE 09.RESIDENTIAL GLOBAL METAL FURNITURE MARKET, BY REGION, 2019–2027 ($MILLION)
TABLE 10.GLOBAL METAL FURNITURE MARKET REVENUE, BY DISTRIBUTION CHANNEL, 2020-2028 ($MILLION)
TABLE 11.DIRECT DISTRIBUTION GLOBAL METAL FURNITURE MARKET, BY REGION, 2020–2028 ($MILLION)
TABLE 12.SUPERMARKET/HYPERMARKET GLOBAL METAL FURNITURE MARKET, BY REGION, 2020–2028 ($MILLION)
TABLE 13.SPECIALTY STORES GLOBAL METAL FURNITURE MARKET, BY REGION, 2020–2028 ($MILLION)
TABLE 14.E-COMMERCE GLOBAL METAL FURNITURE MARKET, BY REGION, 2020–2028 ($MILLION)
TABLE 15.GLOBAL METAL FURNITURE MARKET, BY REGION, 2020–2028 ($MILLION)
TABLE 16.NORTH AMERICA GLOBAL METAL FURNITURE MARKET, BY TYPE, 2020–2028 ($MILLION)
TABLE 17.NORTH AMERICA GLOBAL METAL FURNITURE MARKET, BY APPLICATION, 2020–2028 ($MILLION)
TABLE 18.NORTH AMERICA GLOBAL METAL FURNITURE MARKET, BY DISTRIBUTION CHANNEL, 2020–2028 ($MILLION)
TABLE 19.NORTH AMERICA GLOBAL METAL FURNITURE MARKET REVENUE, BY COUNTRY, 2020–2028 ($MILLION)
TABLE 20.U.S. GLOBAL METAL FURNITURE MARKET, BY TYPE, 2020–2028 ($MILLION)
TABLE 21.U.S. GLOBAL METAL FURNITURE MARKET, BY APPLICATION, 2020–2028 ($MILLION)
TABLE 22.U.S. GLOBAL METAL FURNITURE MARKET, BY DISTRIBUTION CHANNEL, 2020–2028 ($MILLION)
TABLE 23.CANADA GLOBAL METAL FURNITURE MARKET, BY TYPE, 2020–2028 ($MILLION)
TABLE 24.CANADA GLOBAL METAL FURNITURE MARKET, BY APPLICATION, 2020–2028 ($MILLION)
TABLE 25.CANADA GLOBAL METAL FURNITURE MARKET, BY DISTRIBUTION CHANNEL, 2020–2028 ($MILLION)
TABLE 26.MEXICO GLOBAL METAL FURNITURE MARKET, BY TYPE, 2020–2028 ($MILLION)
TABLE 27.MEXICO GLOBAL METAL FURNITURE MARKET, BY APPLICATION, 2020–2028 ($MILLION)
TABLE 28.MEXICO GLOBAL METAL FURNITURE MARKET, BY DISTRIBUTION CHANNEL, 2020–2028 ($MILLION)
TABLE 29.EUROPE GLOBAL METAL FURNITURE MARKET, BY TYPE, 2020–2028 ($MILLION)
TABLE 30.EUROPE GLOBAL METAL FURNITURE MARKET, BY APPLICATION, 2020–2028 ($MILLION)
TABLE 31.EUROPE GLOBAL METAL FURNITURE MARKET, BY DISTRIBUTION CHANNEL, 2020–2028 ($MILLION)
TABLE 32.EUROPE GLOBAL METAL FURNITURE MARKET REVENUE, BY COUNTRY, 2020–2028 ($MILLION)
TABLE 33.GERMANY GLOBAL METAL FURNITURE MARKET, BY TYPE, 2020–2028 ($MILLION)
TABLE 34.GERMANY GLOBAL METAL FURNITURE MARKET, BY APPLICATION, 2020–2028 ($MILLION)
TABLE 35.GERMANY GLOBAL METAL FURNITURE MARKET, BY DISTRIBUTION CHANNEL, 2020–2028 ($MILLION)
TABLE 36.U.S. GLOBAL METAL FURNITURE MARKET, BY TYPE, 2020–2028 ($MILLION)
TABLE 37.UK GLOBAL METAL FURNITURE MARKET, BY APPLICATION, 2020–2028 ($MILLION)
TABLE 38.UK GLOBAL METAL FURNITURE MARKET, BY DISTRIBUTION CHANNEL, 2020–2028 ($MILLION)
TABLE 39.FRANCE GLOBAL METAL FURNITURE MARKET, BY TYPE, 2020–2028 ($MILLION)
TABLE 40.FRANCE GLOBAL METAL FURNITURE MARKET, BY APPLICATION, 2020–2028 ($MILLION)
TABLE 41.FRANCE GLOBAL METAL FURNITURE MARKET, BY DISTRIBUTION CHANNEL, 2020–2028 ($MILLION)
TABLE 42.ITALY GLOBAL METAL FURNITURE MARKET, BY TYPE, 2020–2028 ($MILLION)
TABLE 43.ITALY GLOBAL METAL FURNITURE MARKET, BY APPLICATION, 2020–2028 ($MILLION)
TABLE 44.ITALY GLOBAL METAL FURNITURE MARKET, BY DISTRIBUTION CHANNEL, 2020–2028 ($MILLION)
TABLE 45.SPAIN GLOBAL METAL FURNITURE MARKET, BY TYPE, 2020–2028 ($MILLION)
TABLE 46.SPAIN GLOBAL METAL FURNITURE MARKET, BY APPLICATION, 2020–2028 ($MILLION)
TABLE 47.SPAIN GLOBAL METAL FURNITURE MARKET, BY DISTRIBUTION CHANNEL, 2020–2028 ($MILLION)
TABLE 48.REST OF EUROPE GLOBAL METAL FURNITURE MARKET, BY TYPE, 2020–2028 ($MILLION)
TABLE 49.REST OF EUROPE GLOBAL METAL FURNITURE MARKET, BY APPLICATION, 2020–2028 ($MILLION)
TABLE 50.REST OF EUROPE GLOBAL METAL FURNITURE MARKET, BY DISTRIBUTION CHANNEL, 2020–2028 ($MILLION)
TABLE 51.ASIA-PACIFIC GLOBAL METAL FURNITURE MARKET, BY TYPE, 2020–2028 ($MILLION)
TABLE 52.ASIA-PACIFIC GLOBAL METAL FURNITURE MARKET, BY APPLICATION, 2020–2028 ($MILLION)
TABLE 53.ASIA-PACIFIC GLOBAL METAL FURNITURE MARKET, BY DISTRIBUTION CHANNEL, 2020–2028 ($MILLION)
TABLE 54.ASIA-PACIFIC GLOBAL METAL FURNITURE MARKET REVENUE, BY COUNTRY, 2020–2028 ($MILLION)
TABLE 55.CHINA GLOBAL METAL FURNITURE MARKET, BY TYPE, 2020–2028 ($MILLION)
TABLE 56.CHINA GLOBAL METAL FURNITURE MARKET, BY APPLICATION, 2020–2028 ($MILLION)
TABLE 57.CHINA GLOBAL METAL FURNITURE MARKET, BY DISTRIBUTION CHANNEL, 2020–2028 ($MILLION)
TABLE 58.INDIA GLOBAL METAL FURNITURE MARKET, BY TYPE, 2020–2028 ($MILLION)
TABLE 59.INDIA GLOBAL METAL FURNITURE MARKET, BY APPLICATION, 2020–2028 ($MILLION)
TABLE 60.INDIA GLOBAL METAL FURNITURE MARKET, BY DISTRIBUTION CHANNEL, 2020–2028 ($MILLION)
TABLE 61.JAPAN GLOBAL METAL FURNITURE MARKET, BY TYPE, 2020–2028 ($MILLION)
TABLE 62.JAPAN GLOBAL METAL FURNITURE MARKET, BY APPLICATION, 2020–2028 ($MILLION)
TABLE 63.JAPAN GLOBAL METAL FURNITURE MARKET, BY DISTRIBUTION CHANNEL, 2020–2028 ($MILLION)
TABLE 64.AUSTRALIA GLOBAL METAL FURNITURE MARKET, BY TYPE, 2020–2028 ($MILLION)
TABLE 65.AUSTRALIA GLOBAL METAL FURNITURE MARKET, BY APPLICATION, 2020–2028 ($MILLION)
TABLE 66.AUSTRALIA GLOBAL METAL FURNITURE MARKET, BY DISTRIBUTION CHANNEL, 2020–2028 ($MILLION)
TABLE 67.SOUTH KOREA GLOBAL METAL FURNITURE MARKET, BY TYPE, 2020–2028 ($MILLION)
TABLE 68.SOUTH KOREA GLOBAL METAL FURNITURE MARKET, BY APPLICATION, 2020–2028 ($MILLION)
TABLE 69.SOUTH KOREA GLOBAL METAL FURNITURE MARKET, BY DISTRIBUTION CHANNEL, 2020–2028 ($MILLION)
TABLE 70.REST OF ASIA-PACIFIC GLOBAL METAL FURNITURE MARKET, BY TYPE, 2020–2028 ($MILLION)
TABLE 71.REST OF ASIA-PACIFIC GLOBAL METAL FURNITURE MARKET, BY APPLICATION, 2020–2028 ($MILLION)
TABLE 72.REST OF ASIA-PACIFIC GLOBAL METAL FURNITURE MARKET, BY DISTRIBUTION CHANNEL, 2020–2028 ($MILLION)
TABLE 73.LAMEA GLOBAL METAL FURNITURE MARKET, BY TYPE, 2020–2028 ($MILLION)
TABLE 74.LAMEA GLOBAL METAL FURNITURE MARKET, BY APPLICATION, 2020–2028 ($MILLION)
TABLE 75.LAMEA GLOBAL METAL FURNITURE MARKET, BY DISTRIBUTION CHANNEL, 2020–2028 ($MILLION)
TABLE 76.LAMEA GLOBAL METAL FURNITURE MARKET REVENUE, BY COUNTRY, 2020–2028 ($MILLION)
TABLE 77.LATIN AMERICA GLOBAL METAL FURNITURE MARKET, BY TYPE, 2020–2028 ($MILLION)
TABLE 78.LATIN AMERICA GLOBAL METAL FURNITURE MARKET, BY APPLICATION, 2020–2028 ($MILLION)
TABLE 79.LATIN AMERICA GLOBAL METAL FURNITURE MARKET, BY DISTRIBUTION CHANNEL, 2020–2028 ($MILLION)
TABLE 80.MIDDLE EAST GLOBAL METAL FURNITURE MARKET, BY TYPE, 2020–2028 ($MILLION)
TABLE 81.MIDDLE EAST GLOBAL METAL FURNITURE MARKET, BY APPLICATION, 2020–2028 ($MILLION)
TABLE 82.MIDDLE EAST GLOBAL METAL FURNITURE MARKET, BY DISTRIBUTION CHANNEL, 2020–2028 ($MILLION)
TABLE 83.AFRICA GLOBAL METAL FURNITURE MARKET, BY TYPE, 2020–2028 ($MILLION)
TABLE 84.AFRICA GLOBAL METAL FURNITURE MARKET, BY APPLICATION, 2020–2028 ($MILLION)
TABLE 85.AFRICA GLOBAL METAL FURNITURE MARKET, BY DISTRIBUTION CHANNEL, 2020–2028 ($MILLION)
TABLE 86.CHYUAN CHERN FURNITURE CO., LTD.: COMPANY SNAPSHOT
TABLE 87.CHYUAN CHERN FURNITURE CO., LTD.: OPERATING SEGMENTS
TABLE 88.CHYUAN CHERN FURNITURE CO., LTD.: PRODUCT PORTFOLIO
TABLE 89.CYMAX GROUP INC.: KEY EXECUTIVES
TABLE 90.CYMAX GROUP INC.: COMPANY SNAPSHOT
TABLE 91.CYMAX GROUP INC.: OPERATING SEGMENTS
TABLE 92.CYMAX GROUP INC.: PRODUCT PORTFOLIO
TABLE 93.DHP FURNITURE: KEY EXECUTIVES
TABLE 94.DHP FURNITURE: COMPANY SNAPSHOT
TABLE 95.DHP FURNITURE: OPERATING SEGMENTS
TABLE 96.DHP FURNITURE: PRODUCT PORTFOLIO
TABLE 97.GODREJ INTERIO: KEY EXECUTIVES
TABLE 98.GODREJ INTERIO: COMPANY SNAPSHOT
TABLE 99.GODREJ INTERIO: OPERATING SEGMENTS
TABLE 100.GODREJ INTERIO: PRODUCT PORTFOLIO
TABLE 101.HILLSDALE FURNITURE: KEY EXECUTIVE
TABLE 102.HILLSDALE FURNITURE: COMPANY SNAPSHOT
TABLE 103.HILLSDALE FURNITURE: OPERATING SEGMENTS
TABLE 104.HILLSDALE FURNITURE: PRODUCT PORTFOLIO
TABLE 105.INTER IKEA SYSTEMS B.V.: KEY EXECUTIVES
TABLE 106.INTER IKEA SYSTEMS B.V.: COMPANY SNAPSHOT
TABLE 107.INTER IKEA SYSTEMS B.V.: OPERATING SEGMENTS
TABLE 108.INTER IKEA SYSTEMS B.V.: NET REVENUE, 2017–2019 ($MILLION)
TABLE 109.INTER IKEA SYSTEMS B.V.: PRODUCT PORTFOLIO
TABLE 110.MECO CORPORATION: KEY EXECUTIVES
TABLE 111.MECO CORPORATION: COMPANY SNAPSHOT
TABLE 112.MECO CORPORATION: OPERATING SEGMENTS
TABLE 113.MECO CORPORATION: PRODUCT PORTFOLIO
TABLE 114.OLIVER METAL FURNITURE: KEY EXECUTIVES
TABLE 115.OLIVER METAL FURNITURE: COMPANY SNAPSHOT
TABLE 116.OLIVER METAL FURNITURE: PRODUCT PORTFOLIO
TABLE 117.SIMPLI HOME: KEY EXECUTIVE
TABLE 118.SIMPLI HOME: COMPANY SNAPSHOT
TABLE 119.SIMPLI HOME: OPERATING SEGMENTS
TABLE 120.SIMPLI HOME: PRODUCT PORTFOLIO
TABLE 121.ZINUS: KEY EXECUTIVE
TABLE 122.ZINUS: COMPANY SNAPSHOT
TABLE 123.ZINUS: OPERATING SEGMENTS
TABLE 124.ZINUS: PRODUCT PORTFOLIO

LIST OF FIGURES

FIGURE 01.KEY MARKET SEGMENT
FIGURE 02.EXECUTIVE SUMMARY
FIGURE 03.TOP INVESTMENT POCKET
FIGURE 04.MODERATE BARGAINING POWER OF SUPPLIER
FIGURE 05.LOW BARGAINING POWER OF BUYERS
FIGURE 06.MODERATE THREAT OF SUBSTITUTION
FIGURE 07.MODERATE THREAT OF NEW ENTRANTS
FIGURE 08.MODERATE INTENSITY OF COMPETITIVE RIVALRY
FIGURE 09.GLOBAL METAL FURNITURE MARKET: DRIVER, RESTRAINTS AND OPPORTUNITIES
FIGURE 10.COMPARATIVE SHARE ANALYSIS OF BED GLOBAL METAL FURNITURE MARKET REVENUE, BY COUNTRY, 2020 & 2028 (%)
FIGURE 11.COMPARATIVE SHARE ANALYSIS OF SOFA GLOBAL METAL FURNITURE MARKET REVENUE, BY COUNTRY, 2020 & 2028 (%)
FIGURE 12.COMPARATIVE SHARE ANALYSIS OF CHAIR GLOBAL METAL FURNITURE MARKET REVENUE, BY COUNTRY, 2020 & 2028 (%)
FIGURE 13.COMPARATIVE SHARE ANALYSIS OF TABLE GLOBAL METAL FURNITURE MARKET REVENUE, BY COUNTRY, 2020 & 2028 (%)
FIGURE 14.COMPARATIVE SHARE ANALYSIS OF OTHERS GLOBAL METAL FURNITURE MARKET REVENUE, BY COUNTRY, 2020 & 2028 (%)
FIGURE 15.COMPARATIVE SHARE ANALYSIS OF COMMERCIAL GLOBAL METAL FURNITURE MARKET REVENUE, BY COUNTRY, 2020 & 2028 (%)
FIGURE 16.COMPARATIVE SHARE ANALYSIS OF RESIDENTIAL GLOBAL METAL FURNITURE MARKET REVENUE, BY COUNTRY, 2020 & 2028 (%)90
FIGURE 17.COMPARATIVE SHARE ANALYSIS OF DIRECT DISTRIBUTION GLOBAL METAL FURNITURE MARKET REVENUE, BY COUNTRY, 2020 & 2028 (%)
FIGURE 18.COMPARATIVE SHARE ANALYSIS OF SUPERMARKET/HYPERMARKET GLOBAL METAL FURNITURE MARKET REVENUE, BY COUNTRY, 2020 & 2028 (%)
FIGURE 19.COMPARATIVE SHARE ANALYSIS OF SPECIALTY STORES GLOBAL METAL FURNITURE MARKET REVENUE, BY COUNTRY, 2020 & 2028 (%)
FIGURE 20.COMPARATIVE SHARE ANALYSIS OF E-COMMERCE GLOBAL METAL FURNITURE MARKET REVENUE, BY COUNTRY, 2020 & 2028 (%)
FIGURE 21.U.S. GLOBAL METAL FURNITURE MARKET, 2020 & 2028 ($MILLION)
FIGURE 22.CANADA GLOBAL METAL FURNITURE MARKET, 2020 & 2028 ($MILLION)
FIGURE 23.MEXICO GLOBAL METAL FURNITURE MARKET, 2020 & 2028 ($MILLION)
FIGURE 24.GERMANY GLOBAL METAL FURNITURE MARKET, 2020 & 2028 ($MILLION)
FIGURE 25.UK GLOBAL METAL FURNITURE MARKET, 2020 & 2028 ($MILLION)
FIGURE 26.FRANCE GLOBAL METAL FURNITURE MARKET, 2020 & 2028 ($MILLION)
FIGURE 27.ITALY GLOBAL METAL FURNITURE MARKET, 2020 & 2028 ($MILLION
FIGURE 28.SPAIN GLOBAL METAL FURNITURE MARKET, 2020 & 2028 ($MILLION)
FIGURE 29.REST OF EUROPE GLOBAL METAL FURNITURE MARKET, 2020 & 2028 ($MILLION)
FIGURE 30.CHINA GLOBAL METAL FURNITURE MARKET, 2020 & 2028 ($MILLION)
FIGURE 31.INDIA GLOBAL METAL FURNITURE MARKET, 2020 & 2028 ($MILLION)
FIGURE 32.JAPAN GLOBAL METAL FURNITURE MARKET, 2020 & 2028 ($MILLION)
FIGURE 33.AUSTRALIA GLOBAL METAL FURNITURE MARKET, 2020 & 2028 ($MILLION)
FIGURE 34.SOUTH KOREA GLOBAL METAL FURNITURE MARKET, 2020 & 2028 ($MILLION)
FIGURE 35.REST OF ASIA-PACIFIC GLOBAL METAL FURNITURE MARKET, 2020 & 2028 ($MILLION)
FIGURE 36.LATIN AMERICA GLOBAL METAL FURNITURE MARKET, 2020 & 2028 ($MILLION)
FIGURE 37.MIDDLE EAST GLOBAL METAL FURNITURE MARKET, 2020 & 2028 ($MILLION)
FIGURE 38.AFRICA GLOBAL METAL FURNITURE MARKET, 2020 & 2028 ($MILLION)
FIGURE 39.TOP WINNING STRATEGIES, BY YEAR, 2018-2021
FIGURE 40.TOP WINNING STRATEGIES, BY DEVELOPMENT, 2018-2021
FIGURE 41.TOP WINNING STRATEGIES, BY COMPANY, 2018-2021
FIGURE 42.PRODUCT MAPPING OF TOP 10 KEY PLAYERS
FIGURE 43.COMPETITIVE DASHBOARD OF TOP 10 KEY PLAYERS
FIGURE 44.COMPETITIVE HEAT MAP OF TOP 10 KEY PLAYERS
FIGURE 45.INTER IKEA SYSTEMS B.V.: NET REVENUE, 2017–2019 ($MILLION)


Growth in population and urbanization propels growth of the global metal furniture market. As growth in population and urbanization leads to increase in infrastructure activities. Increase in numerous residential and commercial infrastructure leads to increase in demand for furniture. Commercial institutes such as hotels, restaurants, hospitals and offices also drive the market growth.

Furthermore, increase in disposable income and improvement in standard of living provides various opportunities to manufacturers in the metal furniture market. Growth in demand of metal furniture fuels competition among manufacturers. Hence, to maintain foothold in the market, manufacturers are adopting innovation in production of furniture. These innovative ideas include attractive designs and use of strong, durable, and eco-friendly materials.

Outbreak of the corona virus pandemic has affected sales and production of metal furniture business. Due to the disruptive supply chain and temporarily shut of production plant the metal furniture industries suffered losses. Furthermore, the trend of home décor and interior/exterior designing started diminishing, as the customers focused more on the health and safety of them and their family. 

Moreover, majority of metal furniture manufacturers are expanding their business to online platforms. As through online platforms, manufacturers can sell their products by reducing distribution costs out of their profit margins.

PURCHASE OPTIONS

Call or Email us

U.S.-Canada Toll-free: +1-800-792-5285
Int'l : +1-503-894-6022
Europe : +44-845-528-1300
Email : help@alliedmarketresearch.com
 
FREQUENTLY ASKED QUESTIONS?

A. The size of global metal furniture market will be $191,734.0 million from 2021 to 2027.

A. The base year calculated in the global football market report is 2020.

A. The top companies in the global football market are Chyuan Chern Furniture Co., Ltd., Cymax Group Inc., DHP Furniture, Godrej Furniture, Hillsdale Furniture, Inter IKEA systems B.V., Meco Corporation, Oliver Metal Furniture, Simpli Home, and Zinus.

A. According to the global metal furniture market analysis, the market is segmented by type, application, distribution channel, and region. On the basis of type, the market is categorized into bed, sofa, chair, table, and others. On the basis of application, it is segmented into commercial and residential. By distribution channel, it is segregated into direct distribution, supermarket/hypermarket, specialty stores, and e-commerce. Region-wise, it is analyzed across North America (the U.S., Canada, and Mexico), Europe (Germany, the UK, France, Italy, Spain and rest of Europe), Asia-Pacific (China, India, Japan, Australia, South Korea, and rest of Asia-Pacific), and LAMEA (Latin America, the Middle East, and Africa)

A. There is a surge in the trend of customized furniture, home décor, interior and exterior designing among the customers. Furthermore, the rise in disposable income leads the customer to invest more in new furniture models available in the market.

A. Region-wise Asia-Pacific hold maximum market share of the global metal furniture market.

A. The increase in the cost of raw material used in furniture industries acts as an restraint to the market. As the increase in cost of raw material affects the price of furniture which leads customers to opt for better products with less cost.

A. The COVID-19 pandemic has adversely affected the metal furniture business. Due to worldwide lockdowns, manufacturing units were temporarily shut, resulting a loss in production and sales. This lockdown was implemented to avoid further spread of coronavirus. Furthermore, construction of infrastructure was also temporarily closed. This reduced demand for metal furniture to a great extent in the market. In addition, customers focused more on their health and safety, which further reduced the trend of metal furniture in the market.

Looking for Customization?

 Customization Request

Have a Question?

 Speak with Analyst

Any Confusion?

 Inquire Before Buying

Have a glance of the Report

  Request Sample

Purchase Full Report of
Metal Furniture Market

Start reading instantly.
This Report and over 66,804+ more Reports, Available with Avenue Library. T&C*.

  • Online Only
  • $3,712
  • Online cloud access only
  • Restricted print, copy, paste & download
  • Read only
  • Free industry update
    (Within 180 days)
  • Free report update in next update cycle
    (Jun 2022 - Jun 2023)
  • Data Pack
  • $4,125
  • Restricted to one authorized user
  • One print only
  • Available in
    Excel
  • Free industry update
    (Within 180 days)
  •   Free report update in next update cycle
    (Jun 2022 - Jun 2023)
  • Single User
  • $5,769
  • Restricted to one authorized user
  • One print only
  • Available in
    PDF
  • Free industry update
    (Within 180 days)
  •   Free report update in next update cycle
    (Jun 2022 - Jun 2023)
  • Five Users
  • $6,929
  • Limited to five authorized users
  • Print upto five copies
  • Available in
    PDF
  • Free industry update
    (Within 180 days)
  •   Free report update in next update cycle
    (Jun 2022 - Jun 2023)
  • Enterprise
    License/PDF

  • $10,663
  • Unlimited
    within
    company/enterprise
  • Available in Excel & PDF
  • Free industry update
    (Within 180 days)
  •   Free report update in next update cycle
    (Jun 2022 - Jun 2023)
  • Library
    Membership

  • $999 $ 1,175
    Per User/ Per month/ Billed annually
  • Published Content
    E-access
  • Company Profiles
    E-access
  • Newly Added Content Access
  • 10 PDF
    Downloads
  • 5 Excel Data
    Pack Downloads
  • 250 Company Profiles PDF Downloads
  • Buy Now

*Taxes/Fees, if applicable will be added during checkout. All prices in USD

RELATED REPORTS
 

Why Allied Market Research?


Infallible Methodology

To ensure high-level data integrity, accurate analysis, and impeccable forecasts

Analyst Support

For complete satisfaction

Customization

On-demand customization of scope of the report to exactly meet your needs

TARGETED MARKET VIEW

Targeted market view to provide pertinent information and save time of readers

Get fresh content delivered

Get insights on topics that are crucial for your business. Stay abreast of your interest areas.

Get Industry Data Alerts

Why Allied Market Research?

Infallible Methodology

To ensure high-level data integrity, accurate analysis, and impeccable forecasts

Analyst Support

For complete satisfaction

Customization

On-demand customization of scope of the report to exactly meet your needs

TARGETED MARKET VIEW

Targeted market view to provide pertinent information and save time of readers