
Metal Oxide Nanoparticles Market Research 2030
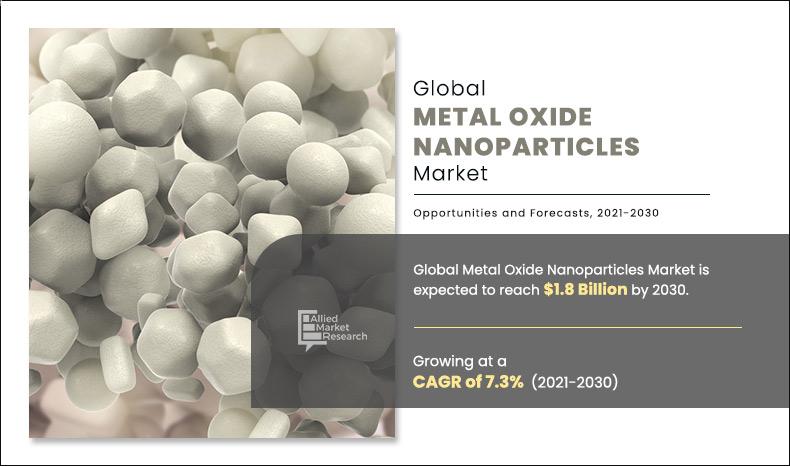
The global metal oxide nanoparticles market size was valued at $0.9 billion in 2020, and is projected to reach $1.8 billion by 2030, growing at a CAGR of 7.3% from 2021 to 2030.
Metal Oxide Nanoparticles (MONPs) are nanoparticles of metal oxides such as titanium, aluminum, zinc, magnesium, cerium and copper among others. Its particle size ranges from 1 and 100 nanometers (nm), although higher sizes are also available in the market. MONPs exhibit different physiochemical properties as compared to their native bulk compounds. Properties such as surface, optical, thermal, and magnetics. MONPs are used as an additive in manufacturing a wide range of electronic components, fuel additive, building materials, as an additive in cosmetic products, medicines, and glass.
Currently, there are numerous factors that drive the global metal oxide nanoparticles market. MONPs are used in the electronics, automotive, healthcare, construction, and personal care industries. Globally, there is a growing demand for MONP-based sensors and biosensing materials that increase the usage of nanoparticles of TiO2, and ZnO among others. Gas sensors based on MONPs provide high sensitivity and easy detection of gaseous contaminates at low cost. Other than sensors, MONPs in electronics and optoelectronics include use in integrated circuits, batteries, solar cells, and antennas. In addition, metal oxide nanoparticles are being developed for biomedical and biosensing applications. Treatments like cancer therapy and dentistry can be enhanced by the use of MONPs. Nanoparticles based on iron oxide are used in cancer therapy.
However, the metal and metal oxide nanoparticles have shown to have potential negative impacts on both human health as well as the environment. It generates new classes of toxins that can affect microbial communities. In 2020, a study was designed to evaluate the possible adverse effects and consequences of metal oxide nanoparticles used on some major body organ functions and health parameters. The study confirmed the health risks of the use of metal oxide nanoparticles in the medical field without precautions and supervision. Thus, as the product incorporation of MONP increases globally, concerns over the toxicity of MONPs could attract regulations over its use. This could hamper its market growth during the forecast period.
The development of metal oxide nanoparticles synthesis using green route is seen as a solution to countering the toxicity of MONPs. Green synthesis consists of using plant-based feedstock as reducing agents to prepare metal oxide nanoparticles. In 2018, nanoparticles of gold (Au), platinum (Pt), palladium (Pd), silver (Ag) and copper oxide (CuO) materials were synthesized in simple aqueous media using the natural polymer gum karaya as a reducing and stabilizing agent. The green synthesis has gained significant global attention due to its feasibility and low environmental impact. Hence, developments in this area could offer fresh growth opportunities for the global metal oxide nanoparticles market growth during the forecast period.
The global metal oxide nanoparticles market is segmented into type, end use industry, and region. On the basis of type, the global metal oxide nanoparticles market is segmented in to aluminium oxide, titanium dioxide, copper oxide, magnesium oxide, zinc oxide, and others. On the basis of end use industry, it is segmented into optics & electronics, healthcare, automotive, construction, ceramic & glass, personal care, paints & coatings, and others. Region wise, the global metal oxide nanoparticles market is segmented into North America, Europe, Asia-Pacific, and LAMEA. The key players engaged in the production of MONPs are EPRUI Biotech Co. Ltd., Hongwu International Group Ltd., Intelligent Materials Pvt. Ltd. (Nanoshel), Meliorum Technologies Inc., Merck KGaA, Nanophase Technologies Corporation, NanoResearch Elements Inc., SkySpring Nanomaterials Inc., Star Grace Mining Co. Ltd., and TCT Nanotech.
Metal Oxide Nanoparticles Market, By Region
Asia-Pacific metal oxide nanoparticles market share is projected to grow at the highest CAGR of 8.0%. Countries such as China, Japan, India, and Korea are the major users of metal oxide nanoparticles that are used in the electronics, personal care, healthcare and construction sectors.
By Country
Global Metal Oxide Nanoparticles Market Value, by Country, 2020-2030 ($Billion)
Metal Oxide Nanoparticles Market, by Type
Depending on the type, the titanium dioxide segment accounted for the largest market share in 2020, owing to its wide range of applications such as in manufacturing sensors, catalysts, building materials, cosmetic products, fuel additive, and glass among others
By Type
Global Metal Oxide Nanoparticles Market Value, by Type, 2020-2030 ($ Billion)
Metal Oxide Nanoparticles Market, by End Use Industry
On the basis of end use industry, the optics & electronics segment accounted for the largest revenue share in 2020, and is expected to grow at the CAGR of 7.7%. Numerous types of MONPs are used across the globe to manufacture sensing materials, antennas, integrated circuits, and solar cells.
By End-use Industry
Global Metal Oxide Nanoparticles Market Value, by End-use Industry, 2020-2030 ($ Billion)
Key benefits for stakeholders
- The report outlines the current metal oxide nanoparticles market trends and future estimations from 2020 to 2030 to understand the prevailing opportunities and potential investment pockets.
- Porter’s five forces analysis helps to analyze the potential of buyers & suppliers and the competitive scenario of the industry for strategy building.
- The major countries in the region have been mapped according to their individual revenue contribution to the regional market.
- The key drivers, restraints, and opportunities and their detailed impact analysis are explained in the study.
- The profiles of key players and their key strategic developments are enlisted in the report.
Metal Oxide Nanoparticles Market Report Highlights
| Aspects | Details |
| By Type |
|
| By END-USE INDUSTRY |
|
| By Region |
|
| Key Market Players | INTELLIGENT MATERIALS PVT. LTD, NANO RESEARCH ELEMENTS INC, EPRUI BIOTECH CO. LTD., MELIORUM TECHNOLOGIES INC., STAR GRACE MINING CO. LTD., SKYSPRING NANOMATERIALS INC, NANOPHASE TECHNOLOGIES CORPORATION, TCT NANOTECH, MERCK KGAA, HONGWU INTERNATIONAL GROUP LTD. |
Analyst Review
According to the insights of the leading CXO’s, the demand for metal oxide nanoparticles is anticipated to grow in the long run ,as more research is required for new applications areas and improvements in the existing applications. Currently, MONPs are used in manufacturing sensors, integrated circuits, cosmetic products, fuel additive, textiles, and building materials. Global healthcare infrastructure is improving and ever-expanding. This trend will increase access to early diagnostics and treatment, thereby requiring more advanced treatments. Furthermore, There are numerous studies are being conducted for incorporating metal oxide nanoparticles that elevate its demand. Apart from the major types of MONPs such as ZnO and TiO2, widening the application areas of other MONPs such as MgO and CuO will look to diversify the revenue share of the current market. In addition, deriving metal oxide nanoparticles through a green synthesis method has been touted as simple, cost effective, and eco-friendly. Hence, more research needs to be directed towards this area.
Enhancement in optical, electrical and magnetic properties of metal oide nanoparticles compared to bulk forms has attracted the attention towards metal oxide nanoparticles
The global metal oxide nanoparticles market was valued at $0.9 billion in 2020, and is projected to reach $1.8 billion by 2030, growing at a CAGR of 7.3% from 2021 to 2030.
EPRUI Biotech Co. Ltd., Hongwu International Group Ltd., Intelligent Materials Pvt. Ltd. (Nanoshel), Meliorum Technologies Inc., Merck KGaA, Nanophase Technologies Corporation, NanoResearch Elements Inc., SkySpring Nanomaterials Inc., Star Grace Mining Co. Ltd., and TCT Nanotechare the major suppliers of metal oxide nanoparticles
Electronics, healthcare, personal care, and construction sectors are the rapidly growing end use industries for metal oxide nanoparticles
The global metal oxide nanoparticles market is segmented based on the type, end-use industry, and region
The use of metal oxide nanoparticles in manufacturing electronics, and sensing materials is currently driving the global market
The global healthcare and personal care industries are projected to drive the adoption of metal oxide nanoparticles
The COVID-19 pandemic disrupted the global manufacturing sector thereby reducing the demand for advanced materials like MONPs. However, the potential of MONPs in the treatment of COVID-19 and its possible mutations is projected to positively impact the overall market
Loading Table Of Content...

