
Metal Recycling Market Overview
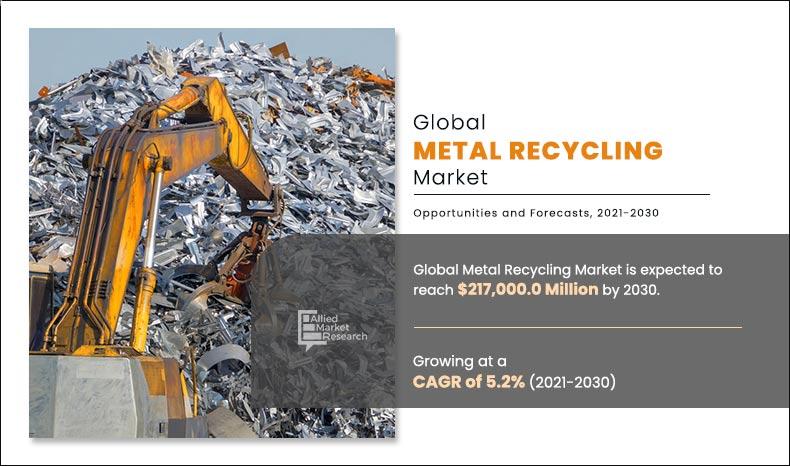
The Global Metal Recycling Market Size was $217.0 billion in 2020 and is expected to reach $368.7 billion by 2030, registering a CAGR of 5.2% from 2021 to 2030.
Metal recycling is defined as the reprocessing of scrap metal into valuable products. The process is carried out to reduce greenhouse gas emission, manage energy consumption and conserve natural resources. Metal recycling is the process of taking waste metal, processing it and creating a new material from it. This recycled metal can be used to make products such as bar, ropes, and poles. Metals are used in various industry verticals such as building & construction, packaging, automotive, industrial machinery, and shipbuilding industry.
Market Dynamics
Rise in construction activities across various regions such as Europe & Asia-Pacific are expected to fuel the global metal recycling market growth. Increase in urbanization and rise in industrialization result in rapid development of the economies, which boosts the demand for global metal recycling market. Thus, fast-paced urbanization results in increased government and consumer spending in residential and infrastructure construction, which significantly boosts the growth of the metal recycling market. In addition, recycling metals help the industry to create the jobs and also contribute to the economy of the country. For instance, in the U.S. more than a million people are employed by a recycling industry that generates $236 billion per year.
Increase in urbanization and industrialization is one of the major factors driving the growth of the metal recycling market. The high acceptance of the process by manufactures to procure raw materials to manufacture finished goods without affecting their properties and the presence of laws and regulations enforced by governments are accelerating the market growth. For instance, the U.S. recycling industry contributes $116.8 billion in economic output to the national economy. In addition, surge in concerns about greenhouse gas emission, and increase in environmental concerns among population, fuel the growth of the global metal recycling market.
Major players such as Nucor Corporation, Commercial Metals Company, Aurubis AG, Dowa Holdings Co.Ltd. and others are adopting business expansion as key development strategy to improve the geographical presence of the metal recycling market. For instance, in January 2022, Nucor Corporation announced that it will build its new state of the art sheet mil in Mason Country, West Virginia. It aims in strengthened ability to serve customers in the Midwest and Northeast, the two largest sheet consuming regions in the U.S. When fully operational, the new mill will employ approximately 800 full-time teammates. It aims in improving the presence in the market & improve the product portfolio of the company.
However, unorganized flow of waste metals and presence of less scrap collection zones are anticipated to hamper the growth of the metal recycling market. Conversely, increase in construction of buildings owing to increase in disposal of building waste into the landfills is anticipated to provide lucrative opportunities for the growth of the global metal recycling market.
By Scrap Type
Old scrap segment is projected to grow at a highest CAGR of 6.0%.
Metal Recycling Market Segment Review
The metal recycling market is segmented on the basis of metal type, scrap type, end user, and region.
By scrap type, the metal recycling market is bifurcated into old scrap, and new scrap. The old scrap segment generated the highest revenue in 2020. By metal type, the market is fragmented into ferrous and non-ferrous metals. The ferrous segment dominated the market in 2020.
By end user, the metal recycling market is categorized into building & construction, packaging, automotive, shipbuilding, electronics & electrical equipment and others. The automotive segment was the highest revenue contributor during the forecast period. However, electronics contain heavy and high valued metals, such as lead, copper, gold, and aluminum and its recycling ensures natural resources conversation. Therefore, electronics and electrical equipment industry is the fastest growing sector during the forecast period.
Region-wise, the metal recycling market analyzed across North America (the U.S., Canada, and Mexico), Europe (Germany, France, the UK, Italy, and rest of Europe), Asia-Pacific (China, Japan, India, Australia, and rest of Asia-Pacific), and LAMEA (Latin America, the Middle East, and Africa). Asia-Pacific region generated the highest revenue in 2020.
By Type
Ferrous segment generated the highest revenue in 2020
Competition Analysis
The key players profiled in the global metal recycling market include ArcelorMittal, Nucor Corporation, Commercial Metals Company, SIMS Metal Management Limited, Aurubis AG, European Metal Recycling Limited, Tata Steel, Dowa Holdings Co., Ltd., OmniSource Corporation, and Schnitzer Steel Industries Inc.
Major players are adopting acquisition and product launch as key developmental strategies to improve the product portfolio of the global metal recycling market. For instance, in February 2021, Steel Dynamics Inc acquired three metals recycling locations in South Texas in close proximity to prime scrap-generating urban and manufacturing areas. These sites will also provide important support for the Sinton Steel Mill’s prime scrap needs. This acquisition aims to improve the product portfolio of the company.
By Region
Asia-Pacific holds a dominant position in 2020 and is expected to grow at a significant rate during the forecast period.
What are the Key Benefits for Stakeholders
- The report provides an extensive analysis of the current and emerging global metal recycling market trends and dynamics.
- In-depth market analysis is conducted by global metal recycling market estimations for the global metal recycling market segments between 2020 and 2030.
- Extensive analysis of the global metal recycling market is conducted by following key product positioning and monitoring of the top competitors within the market framework.
- A comprehensive analysis of all the regions is provided to determine the prevailing opportunities.
- The global metal recycling market forecast analysis from 2021 to 2030 is included in the report.
- The key market players within containment barrier market are profiled in this report and their strategies are analyzed thoroughly, which help understand the competitive outlook of the global metal recycling market.
Metal Recycling Market Report Highlights
| Aspects | Details |
| By METAL TYPE |
|
| By Scrap TYPE |
|
| By END USER |
|
| By Key Market Players |
|
Analyst Review
Metal recycling refers to the recovery of scrap metals from end-of-life products that can be re-used as raw material in the production of new products. This contributes toward preservation of natural resources by reducing the need for mining, and decreases emissions, and ozone layer depletion. In addition, it conserves energy as scrap metal processing requires less energy than extracting fresh metal from ores. Government initiatives and consumer awareness toward recycling is anticipated to foster the market growth. According to the Institute of Scrap Recycling Industries (ISRI), the U.S. alone recycles more than 130 million metric tons of ferrous metals and automotive industry was the largest source for scrap in 2020.
Metal recycling is a process and at the same time the basis of an efficient industry. Metal recycling includes the recovering and processing of metal from the end-of life products or structures, so it can be used as a raw material in the production of new goods. Metal recycling also helps in declining greenhouse gas emission levels and preserve natural resources.
Iron & steel, aluminum, copper, and lead are some of the extensively recycled metals owing to their high intrinsic properties. Steel is widely used in automotive, shipbuilding, and packaging industries as it is highly durable and its properties remain unaffected after recycling. Likewise, aluminum is also infinitely recyclable and saves around 95% of the energy as compared to its primary manufacturing. For instance, aluminum extracted from a 50-year-old building can be recycled into a car’s new engine block without losing its quality.
However, unorganized flow of waste metals and less scrap collections zones are anticipated to hamper the growth of the market. Conversely, increase in construction of buildings owing to increase in the disposal of building waste into the landfills is anticipated to provide lucrative opportunities for the growth of the global metal recycling market.
The global metal recycling market was valued at $217.0 billion in 2020 and is projected to reach $368.7 billion by 2030, registering a CAGR of 5.2% from 2021 to 2030.
The metal recycling market involves the reprocessing of scrap metal into valuable products. This process aims to reduce greenhouse gas emissions, manage energy consumption, and conserve natural resources. Recycled metals are utilized in various industries, including building & construction, packaging, automotive, industrial machinery, and shipbuilding.
Major companies operating in the metal recycling market include Nucor Corporation, Commercial Metals Company, Aurubis AG, and Dowa Holdings Co. Ltd. These companies are expanding their operations to enhance their presence in the market.
In 2020, the Asia-Pacific region dominated the global metal recycling market, accounting for 45.5% of the market share.
The growth of the metal recycling market is driven by increased urbanization and industrialization, leading to rapid economic development. Additionally, rising environmental concerns and the need to reduce greenhouse gas emissions have boosted the demand for metal recycling.
Challenges in the metal recycling market include unorganized flow of waste metals and the presence of fewer scrap collection zones, which can hinder efficient recycling processes.
Loading Table Of Content...

