0
2022
Micro Fulfillment Market

Micro Fulfillment Market

by Component (Control Systems, Material Handling), by Application (Grocery, Merchandise), by End User Industry (Retailers, Manufacturers and distributors): Global Opportunity Analysis and Industry Forecast, 2021-2031

Report Code: A17069
Sep 2022 | Pages: 295
Tables: 203
Charts: 72
  • Formats*:

  • pdf

    Single User License, Five User
    License & Enterprise User License

  • xls

    Data Pack Excel License

  • ppt

    It comes with the additional cost
    of $2500.00 contact sales.


Micro Fulfillment Market Research, 2031

The global micro fulfillment market size was valued at $2.1 billion in 2021, and is projected to reach $88.3 billion by 2031, growing at a CAGR of 44.8% from 2022 to 2031. Micro fulfilment is strategical placement of small warehouses and distribution facilities in the densely populated areas. This close proximity of the facility to the consumers, enables a quick and cost-effective delivery of the products that were ordered using online channels.

The micro fulfillment market was hampered during the outbreak of COVID-19 pandemic, owing to the disruption of supply chains. In addition, micro fulfillment centers were negatively impacted, due to restrictions on manufacturing activities.

Micro Fulfillment Market

The e-commerce sector is growing at an exponential rate, owing to the convenience and large variety of products available on the online channels. The sales in e-commerce sector surged during the COVID-19 pandemic induced lockdowns. This positive impact of COVID-19 on e-commerce sector is expected to continue for the coming years. This increased demand has stressed-out the traditional form of distribution and shipping. Where all the items are stocked in limited number of big warehouses spread across the region, and are directly delivered from there. This method of shipping is proving to be inefficient and less profitable as it requires a high transit time between the warehouses and final delivery location. Therefore, a relatively new concept of keeping the in-demand stocks in small-scale warehouse at multiple densely populated places, is being adopted by the shippers. These small-scale warehouses are known as micro-fulfilment facilities. This concept of small-scale warehousing allows a quick, and profitable delivery. In addition, owing to close proximity to the population, the travel time is less; thus, resulting in less consumption of fuel, making it a sustainable delivery method. Moreover, the micro fulfilment facilities have broadened the scope of e-commerce to include perishable goods such as groceries. Such advantages of micro fulfilment facilities are propelling the growth of the micro fulfillment industry.

Furthermore, rise in urbanization has increased the number of residential complexes in various regions. This positively influences the growth of the micro fulfilment market. Moreover, factors such as increase in internet penetration, and government policies to support the e-commerce sector also play a major role in driving growth of e-commerce industries. This positively influences the micro fulfillment market growth.

In addition, major businesses in the micro fulfilment market offer a wide range of products and services, to meet the needs of the consumers. They constantly innovate their offerings to stay competitive in the market. For instance, in September 2021, Honeywell International Inc., introduced its latest innovation in shipping industry’s robotic technology. It launched a smart depalletizing robot for the micro fulfilment market. This is anticipated to enable the warehouses and distribution centers automate the manual process. Moreover, major players in the e-commerce industry are partnering with technology companies for the advancement of their micro fulfilment centers with advanced products such as robots, and software.
Micro Fulfillment Market

COVID-19 rapidly spread across various countries and regions, causing an enormous impact on the lives of people and the overall community. It began as a human health condition and later became a significant threat to global trade, economy, and finance. The COVID-19 pandemic had halted the production of many components in micro fulfilment market due to lockdown. The economic slowdown initially resulted in reduced spending on various micro fulfilment components. However, COVID-19 has positively affected the e-commerce industry. This prevented the micro fulfilment market from plummeting downwards. In addition, owing to the introduction of various vaccines, the severity of COVID-19 pandemic has significantly reduced. As of mid-2022 the number of COVID-19 cases have diminished significantly. This has led to the full-fledged reopening of micro fulfilment component manufacturing companies at their full-scale capacities. Furthermore, it has been more than two years since the outbreak of this pandemic, and many companies have already shown notable signs of recovery.

Furthermore, the advancements in technology that have improved the material handling devices and robots, are anticipated to provide lucrative opportunities for the market growth.

Micro Fulfillment Market

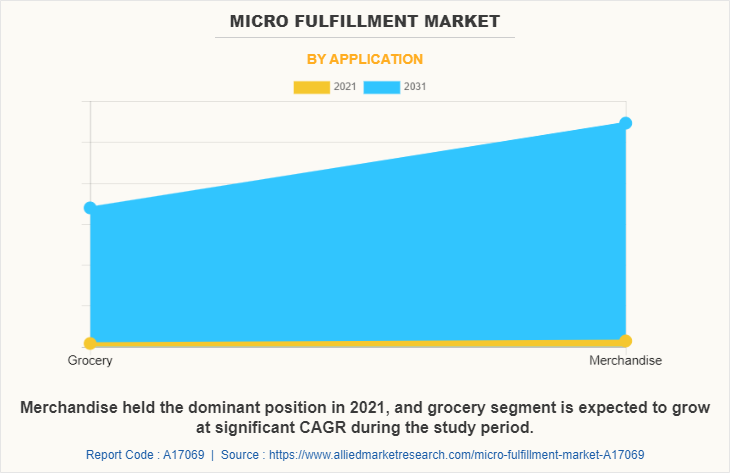
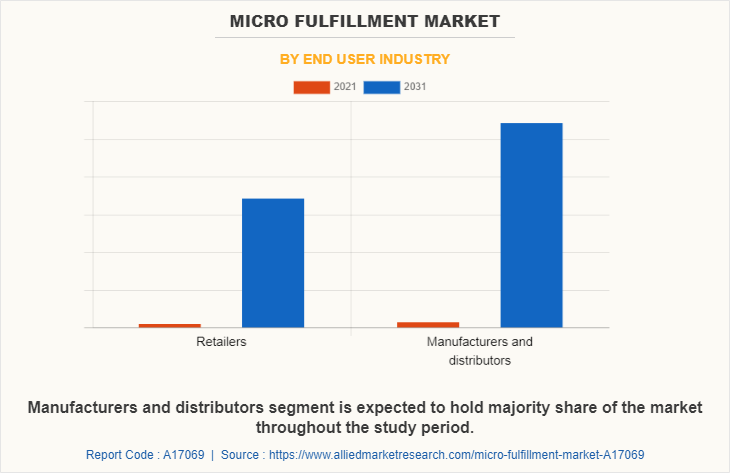
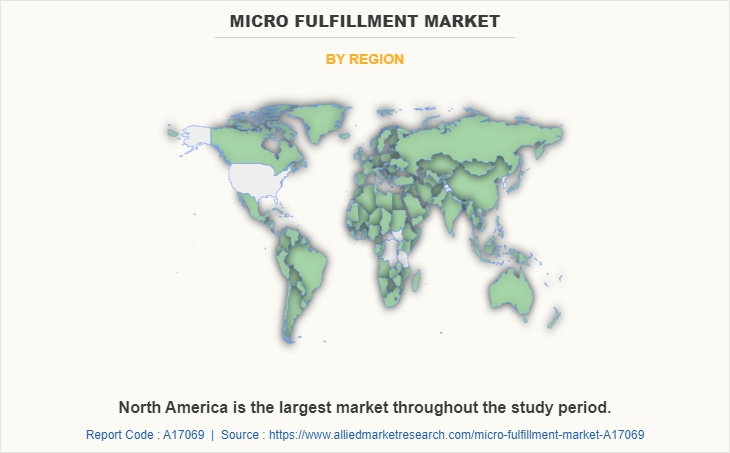
The micro fulfillment market is segmented into End User Industry, Component and Application. On the basis of component, the market is bifurcated into control systems, and material handling. On the basis of application, the market is categorized into grocery, and merchandise. On the basis of end-user industry, it is bifurcated into retailers, and manufacturers & distributors. On the basis of region, the market is analyzed across North America, Europe, Asia-Pacific, and LAMEA. North America held the largest micro fulfillment market share in 2021, accounting for the highest share; whereas, Asia-Pacific is anticipated to grow at a higher CAGR throughout the forecast period. This is attributed to rapid economic growth of the region.
Micro Fulfillment Market

Competition Analysis 

Key companies profiled in the micro fulfillment market forecast report include Ahold Delhaize, Alert Innovation, Inc., Bastian Solutions, LLC, Davinci Micro Fulfillment, Flowspace, Fortna Inc., Honeywell International Inc, HÖRMANN Group (HÖRMANN Logistik), Instacart, KION GROUP AG (Dematic), KPI Integrated Solutions, LOCAD, OPEX, PACK & SEND Holdings Pty Ltd, Pacline Overhead Conveyors, Swisslog, and The Kroger Company.

Key Benefits For Stakeholders

  • This report provides a quantitative analysis of the market segments, current trends, estimations, and dynamics of the micro fulfillment market analysis from 2021 to 2031 to identify the prevailing micro fulfillment market overview.
  • The market research is offered along with information related to key drivers, restraints, and opportunities.
  • Porter's five forces analysis highlights the potency of buyers and suppliers to enable stakeholders make profit-oriented business decisions and strengthen their supplier-buyer network.
  • In-depth analysis of the micro fulfillment market segmentation assists to determine the prevailing market opportunities.
  • Major countries in each region are mapped according to their revenue contribution to the global market.
  • Market player positioning facilitates benchmarking and provides a clear understanding of the present position of the market players.
  • The report includes the analysis of the regional as well as global micro fulfillment market trends, key players, market segments, application areas, and market growth strategies.

Micro Fulfillment Market Report Highlights

Aspects Details
Market Size By 2031 USD 88.3 billion
Growth Rate CAGR of 44.8%
Forecast period 2021 - 2031
Report Pages 295
By End User Industry
  • Retailers
    • Size
      • Below 10000 square feet
      • Above 10000 square feet
  • Manufacturers and distributors
By Component
  • Control Systems
  • Material Handling
By Application
  • Grocery
  • Merchandise
By Region
  • North America  (U.S., Canada, Mexico)
  • Europe  (Germany, France, Italy, UK, Spain, Netherlands, Rest Of Europe)
  • Asia-Pacific  (China, Japan, India, South Korea, Australia, Indonesia, Vietnam, Rest Of Asia-Pacific)
  • LAMEA  (Brazil, Argentina, Saudi Arabia, UAE, South Africa, Kenya)
Key Market Players Swisslog, The Kroger Company, KPI Integrated Solutions, LOCAD, Instacart, PACLINE OVERHEAD CONVEYORS, Davinci Micro Fulfillment, HÖRMANN, Fortna Inc., Bastian Solutions, LLC, Ahold Delhaize, Flowspace, OPEX, Dematic, Alert Innovation, Inc., PACK and SEND Holdings Pty Ltd, Honeywell International Inc
 

CHAPTER 1:INTRODUCTION

1.1.Report description
1.2.Key benefits for stakeholders
1.3.Key market segments
1.4.Manufacturers & distributors methodology

1.4.1.Primary manufacturers & distributors
1.4.2.Secondary manufacturers & distributors
1.4.3.Analyst tools and models

CHAPTER 2:EXECUTIVE SUMMARY

2.1.CXO perspective

CHAPTER 3:MARKET OVERVIEW

3.1.Market definition and scope
3.2.Key Findings

3.2.1.Top Investment Pockets

3.3.Porter's five forces analysis
3.4.PESTEL Analysis
3.5.Value chain Analysis
3.6.Market dynamics

3.6.1.Drivers

3.6.1.1.Growth of e-commerce Industry
3.6.1.2.Advantages of micro fulfilment centers
3.6.1.3.Movement of fulfillment centers closer to end-consumer

3.6.2.Restraints

3.6.2.1.High Initial Cost

3.6.3.Opportunities

3.6.3.1.Advancements in technology

3.7.COVID-19 impact analysis

CHAPTER 4:MICRO FULFILLMENT MARKET, BY COMPONENT

4.1.Overview

4.1.1.Market size and forecast, by component

4.2.Control systems

4.2.1.Key market trends, growth factors, and opportunities
4.2.2.Market size and forecast, by region
4.2.3.Market analysis, by country

4.3.Material handling

4.3.1.Key market trends, growth factors, and opportunities
4.3.2.Market size and forecast, by region
4.3.3.Market analysis, by country

CHAPTER 5:MICRO FULFILLMENT MARKET, BY APPLICATION

5.1.Overview

5.1.1.Market size and forecast, By application

5.2.Grocery

5.2.1.Key market trends, growth factors, and opportunities
5.2.2.Market size and forecast, by region
5.2.3.Market analysis, by country

5.3.Merchandise

5.3.1.Key market trends, growth factors, and opportunities
5.3.2.Market size and forecast, by region
5.3.3.Market analysis, by country

CHAPTER 6:MICRO FULFILLMENT MARKET, BY END-USER INDUSTRY

6.1.Overview

6.1.1.Market size and forecast, end-user

6.2.Retailers

6.2.1.Key market trends, growth factors, and opportunities
6.2.2.Market size and forecast, by region
6.2.3.Market analysis, by country
6.2.4.Market size and forecast, by size

6.2.4.1.Below 10000 square feet

6.2.4.1.1.Market size and forecast, by region

6.2.4.2.Above 10000 square feet

6.2.4.2.1.Market size and forecast, by region

6.2.4.3.Market size and forecast for below 10000 square feet, by type

6.2.4.3.1.Manual

6.2.4.3.1.1.Market size and forecast for manual, by region

6.2.4.3.2.Automated

6.2.4.3.2.1.Market size and forecast for automated, by region

6.3.Manufacturers & distributors

6.3.1.Key market trends, growth factors, and opportunities
6.3.2.Market size and forecast, by region
6.3.3.Market analysis, by country

CHAPTER 7:MICRO FULFILLMENT MARKET, BY REGION

7.1.Overview

7.1.1.Market size and forecast, by region

7.2.North America

7.2.1.Key market trends, growth factors, and opportunities
7.2.2.Market size and forecast, by component
7.2.3.Market size and forecast, By application
7.2.4.Market size and forecast, by end-user industry

7.2.4.1.Market size and forecast for retailers, by size

7.2.4.1.1.Market size and forecast for below 10000 square feet, by type

7.2.5.Market analysis, by country

7.2.5.1.U.S.

7.2.5.1.1.Market size and forecast, by component
7.2.5.1.2.Market size and forecast, By application
7.2.5.1.3.Market size and forecast, by end-user industry

7.2.5.2.Canada

7.2.5.2.1.Market size and forecast, by component
7.2.5.2.2.Market size and forecast, By application
7.2.5.2.3.Market size and forecast, by end-user industry

7.2.5.3.Mexico

7.2.5.3.1.Market size and forecast, by component
7.2.5.3.2.Market size and forecast, By application
7.2.5.3.3.Market size and forecast, by end-user industry

7.3.Europe

7.3.1.Key market trends, growth factors, and opportunities
7.3.2.Market size and forecast, by component
7.3.3.Market size and forecast, By application
7.3.4.Market size and forecast, by end-user industry

7.3.4.1.Market size and forecast for retailers, by size

7.3.4.1.1.Market size and forecast for below 10000 square feet, by type

7.3.5.Market analysis, by country

7.3.5.1.Germany

7.3.5.1.1.Market size and forecast, by component
7.3.5.1.2.Market size and forecast, By application
7.3.5.1.3.Market size and forecast, by end-user industry

7.3.5.2.France

7.3.5.2.1.Market size and forecast, by component
7.3.5.2.2.Market size and forecast, By application
7.3.5.2.3.Market size and forecast, by end-user industry

7.3.5.3.Italy

7.3.5.3.1.Market size and forecast, by component
7.3.5.3.2.Market size and forecast, By application
7.3.5.3.3.Market size and forecast, by end-user industry

7.3.5.4.UK

7.3.5.4.1.Market size and forecast, by component
7.3.5.4.2.Market size and forecast, By application
7.3.5.4.3.Market size and forecast, by end-user industry

7.3.5.5.Spain

7.3.5.5.1.Market size and forecast, by component
7.3.5.5.2.Market size and forecast, By application
7.3.5.5.3.Market size and forecast, by end-user industry

7.3.5.6.Netherlands

7.3.5.6.1.Market size and forecast, by component
7.3.5.6.2.Market size and forecast, By application
7.3.5.6.3.Market size and forecast, by end-user industry

7.3.5.7.Rest of Europe

7.3.5.7.1.Market size and forecast, by component
7.3.5.7.2.Market size and forecast, By application
7.3.5.7.3.Market size and forecast, by end-user industry

7.4.Asia-Pacific

7.4.1.Key market trends, growth factors, and opportunities
7.4.2.Market size and forecast, by component
7.4.3.Market size and forecast, By application
7.4.4.Market size and forecast, by end-user industry

7.4.4.1.Market size and forecast for retailers, by size

7.4.4.1.1.Market size and forecast for below 10000 square feet, by type

7.4.5.Market analysis, by country

7.4.5.1.China

7.4.5.1.1.Market size and forecast, by component
7.4.5.1.2.Market size and forecast, By application
7.4.5.1.3.Market size and forecast, by end-user industry

7.4.5.2.Japan

7.4.5.2.1.Market size and forecast, by component
7.4.5.2.2.Market size and forecast, by application
7.4.5.2.3.Market size and forecast, by end-user industry

7.4.5.3.India

7.4.5.3.1.Market size and forecast, by component
7.4.5.3.2.Market size and forecast, by application
7.4.5.3.3.Market size and forecast, by end-user industry

7.4.5.4.South Korea

7.4.5.4.1.Market size and forecast, by component
7.4.5.4.2.Market size and forecast, By application
7.4.5.4.3.Market size and forecast, by end-user industry

7.4.5.5.Australia

7.4.5.5.1.Market size and forecast, by component
7.4.5.5.2.Market size and forecast, By application
7.4.5.5.3.Market size and forecast, by end-user industry

7.4.5.6.Indonesia

7.4.5.6.1.Market size and forecast, by component
7.4.5.6.2.Market size and forecast, By application
7.4.5.6.3.Market size and forecast, by end-user industry

7.4.5.7.Vietnam

7.4.5.7.1.Market size and forecast, by component
7.4.5.7.2.Market size and forecast, by application
7.4.5.7.3.Market size and forecast, by end-user industry

7.4.5.8.Rest of Asia-Pacific

7.4.5.8.1.Market size and forecast, by component
7.4.5.8.2.Market size and forecast, By application
7.4.5.8.3.Market size and forecast, by end-user industry

7.5.LAMEA

7.5.1.Key market trends, growth factors, and opportunities
7.5.2.Market size and forecast, by component
7.5.3.Market size and forecast, by application
7.5.4.Market size and forecast, by end-user industry

7.5.4.1.Market size and forecast for retailers, by size

7.5.4.1.1.Market size and forecast for below 10000 square feet, by type

7.5.5.Market analysis, by country

7.5.5.1.Brazil

7.5.5.1.1.Market size and forecast, by component
7.5.5.1.2.Market size and forecast, By application
7.5.5.1.3.Market size and forecast, by end-user industry

7.5.5.2.Argentina

7.5.5.2.1.Market size and forecast, by component
7.5.5.2.2.Market size and forecast, By application
7.5.5.2.3.Market size and forecast, by end-user industry

7.5.5.3.Saudi Arabia

7.5.5.3.1.Market size and forecast, by component
7.5.5.3.2.Market size and forecast, By application
7.5.5.3.3.Market size and forecast, by end-user industry

7.5.5.4.UAE

7.5.5.4.1.Market size and forecast, by component
7.5.5.4.2.Market size and forecast, By application
7.5.5.4.3.Market size and forecast, by end-user industry

7.5.5.5.South Africa

7.5.5.5.1.Market size and forecast, by component
7.5.5.5.2.Market size and forecast, By application
7.5.5.5.3.Market size and forecast, by end-user industry

7.5.5.6.Kenya

7.5.5.6.1.Market size and forecast, by component
7.5.5.6.2.Market size and forecast, By application
7.5.5.6.3.Market size and forecast, by end-user industry

CHAPTER 8:COMPETITION LANDSCAPE

8.1.Top winning strategies
8.2.Product mapping
8.3.Competitive dashboard
8.4.Competitive heat map
8.5.Key developments

8.5.1.Partnership
8.5.2.Business expansion
8.5.3.Collaboration
8.5.4.Product lunch
8.5.5.Agreement
8.5.6.Acquisition

8.6.Top Player Positioning 2021

CHAPTER 9:COMPANY PROFILES

9.1.AHOLD DELHAIZE NV

9.1.1.Company overview
9.1.2.Key executive
9.1.3.Company snapshot
9.1.4.Operating business segments
9.1.5.Product portfolio
9.1.6.Business performance
9.1.7.Key strategic moves and developments

9.2.ALERT INNOVATION, INC.

9.2.1.Company overview
9.2.2.Key executive
9.2.3.Company snapshot
9.2.5.Product portfolio
9.2.6.Key strategic moves and developments

9.3.BASTIAN SOLUTIONS, LLC

9.3.1.Company overview
9.3.2.Key executive
9.3.3.Company snapshot
9.3.5.Product portfolio
9.3.6.Key strategic moves and developments

9.4.DAVINCI MICRO FULFILLMENT

9.4.1.Company overview
9.4.2.Key executive
9.4.3.Company snapshot
9.4.5.Product portfolio

9.5.FLOWSPACE

9.5.1.Company overview
9.5.2.Key executive
9.5.3.Company snapshot
9.5.5.Product portfolio

9.6.FORTNA INC.

9.6.1.Company overview
9.6.2.Key executive
9.6.3.Company snapshot
9.6.5.Product portfolio

9.7.INSTACART

9.7.1.Company overview
9.7.2.Key executive
9.7.3.Company snapshot
9.7.5.Product portfolio
9.7.6.Key strategic moves and developments

9.8.KION GROUP (DEMATIC)

9.8.1.Company overview
9.8.2.Key Executives
9.8.3.Company snapshot
9.8.4.Operating business segments
9.8.5.Product portfolio
9.8.6.Business performance

9.9.KPI INTEGRATED SOLUTIONS

9.9.1.Company overview
9.9.2.Key executives
9.9.3.Company snapshot
9.9.5.Product portfolio
9.9.6.Key strategic moves and developments

9.10.LOCAD

9.10.1.Company overview
9.10.2.Key executive
9.10.3.Company snapshot
9.10.5.Product portfolio

9.11.OPEX CORPORATION

9.11.1.Company overview
9.11.2.Key executive
9.11.3.Company snapshot
9.11.5.Product portfolio

9.12.PACK & SEND HOLDINGS Pty Ltd

9.12.1.Company overview
9.12.2.Key executive
9.12.3.Company snapshot
9.12.5.Product portfolio

9.13.PACLINE OVERHEAD CONVEYORS

9.13.1.Company overview
9.13.2.Key executive
9.13.3.Company snapshot
9.13.5.Product portfolio
9.13.6.Key strategic moves and developments

9.14.SWISSLOG HOLDING

9.14.1.Company overview
9.14.2.Key executive
9.14.3.Company snapshot
9.14.5.Product portfolio

9.15.THE KROGER COMPANY

9.15.1.Company overview
9.15.2.Key executive
9.15.3.Company snapshot
9.15.4.Operating business segments
9.15.5.Product portfolio
9.15.6.Business performance
9.15.7.Key strategic moves and developments

CHAPTER 10:KEY INNOVATORS

10.1.HONEYWELL INTERNATIONAL INC

10.1.1.Company overview
10.1.2.Key executive
10.1.3.Company snapshot
10.1.4.Operating business segments
10.1.5.Product portfolio
10.1.6.R&D expenditure
10.1.7.Business performance
10.1.8.Key strategic moves and developments
10.1.9.AMR Perspective: Honeywell international Inc., Innovations and its Impact on the Market

10.2.HÖRMANN GROUP (HÖRMANN LOGISTIK)

10.2.1.Company overview
10.2.2.Key executive
10.2.3.Company snapshot
10.2.4.Operating business segments
10.2.5.Product portfolio
10.2.6.R&D expenditure
10.2.7.Business performance
10.2.8.Key strategic moves and developments
10.2.9.AMR Perspective: HÖRMANN Logistik Innovations and its Impact on the Market

LIST OF TABLES

TABLE 01.MICRO FULFILLMENT MARKET REVENUE, BY COMPONENT, 2021–2031 ($MILLION)
TABLE 02.MICRO FULFILLMENT MARKET REVENUE FOR CONTROL SYSTEMS, BY REGION 2021–2031($MILLION)
TABLE 03.NORTH AMERICA MICRO FULFILLMENT MARKET REVENUE FOR CONTROL SYSTEMS, BY COUNTRY 2021–2031($MILLION)
TABLE 04.EUROPE MICRO FULFILLMENT MARKET REVENUE FOR CONTROL SYSTEMS, BY COUNTRY 2021–2031($MILLION)
TABLE 05.ASIA-PACIFIC MICRO FULFILLMENT MARKET REVENUE FOR CONTROL SYSTEMS, BY COUNTRY 2021–2031($MILLION)
TABLE 06.LAMEA MICRO FULFILLMENT MARKET REVENUE FOR CONTROL SYSTEMS, BY COUNTRY 2021–2031($MILLION)
TABLE 07.MICRO FULFILLMENT MARKET REVENUE FOR MATERIAL HANDLING, BY REGION 2021–2031($MILLION)
TABLE 08.NORTH AMERICA MICRO FULFILLMENT MARKET REVENUE FOR MATERIAL HANDLING, BY COUNTRY 2021–2031($MILLION)
TABLE 09.EUROPE MICRO FULFILLMENT MARKET REVENUE FOR MATERIAL HANDLING, BY COUNTRY 2021–2031($MILLION)
TABLE 10.ASIA-PACIFIC MICRO FULFILLMENT MARKET REVENUE FOR MATERIAL HANDLING, BY COUNTRY 2021–2031($MILLION)
TABLE 11.LAMEA MICRO FULFILLMENT MARKET REVENUE FOR MATERIAL HANDLING, BY COUNTRY 2021–2031($MILLION)
TABLE 12.MICRO FULFILLMENT MARKET REVENUE, BY APPLICATION, 2021–2031 ($MILLION)
TABLE 13.NORTH AMERICA MICRO FULFILLMENT MARKET REVENUE FOR GROCERY, BY COUNTRY 2021–2031($MILLION)
TABLE 14.NORTH AMERICA MICRO FULFILLMENT MARKET REVENUE FOR GROCERY, BY COUNTRY 2021–2031($MILLION)
TABLE 15.EUROPE MICRO FULFILLMENT MARKET REVENUE FOR GROCERY, BY COUNTRY 2021–2031($MILLION)
TABLE 16.ASIA-PACIFIC MICRO FULFILLMENT MARKET REVENUE FOR GROCERY, BY COUNTRY 2021–2031($MILLION)
TABLE 17.LAMEA MICRO FULFILLMENT MARKET REVENUE FOR GROCERY, BY COUNTRY 2021–2031($MILLION)
TABLE 18.NORTH AMERICA MICRO FULFILLMENT MARKET REVENUE FOR MERCHANDISE, BY COUNTRY 2021–2031($MILLION)
TABLE 19.NORTH AMERICA MICRO FULFILLMENT MARKET REVENUE FOR MERCHANDISE, BY COUNTRY 2021–2031($MILLION)
TABLE 20.EUROPE MICRO FULFILLMENT MARKET REVENUE FOR MERCHANDISE, BY COUNTRY 2021–2031($MILLION)
TABLE 21.ASIA-PACIFIC MICRO FULFILLMENT MARKET REVENUE FOR MERCHANDISE, BY COUNTRY 2021–2031($MILLION)
TABLE 22.LAMEA MICRO FULFILLMENT MARKET REVENUE FOR MERCHANDISE, BY COUNTRY 2021–2031($MILLION)
TABLE 23.MICRO FULFILLMENT MARKET REVENUE, END-USER INDUSTRY, 2021–2031 ($MILLION)
TABLE 24.MICRO FULFILLMENT MARKET REVENUE FOR RETAILERS, BY REGION 2021–2031($MILLION)
TABLE 25.MICRO FULFILLMENT MARKET REVENUE FOR RETAILERS, BY SIZE 2021–2031($MILLION)
TABLE 26.NORTH AMERICA MICRO FULFILLMENT MARKET REVENUE FOR RETAILERS, BY COUNTRY 2021–2031($MILLION)
TABLE 27.EUROPE MICRO FULFILLMENT MARKET REVENUE FOR RETAILERS, BY COUNTRY 2021–2031($MILLION)
TABLE 28.ASIA-PACIFIC MICRO FULFILLMENT MARKET REVENUE FOR RETAILERS, BY COUNTRY 2021–2031($MILLION)
TABLE 29.LAMEA MICRO FULFILLMENT MARKET REVENUE FOR RETAILERS, BY COUNTRY 2021–2031($MILLION)
TABLE 30.MICRO FULFILLMENT MARKET FOR BELOW 10000 SQUARE FEET, BY REGION 2021–2031 ($MILLION)
TABLE 31.MICRO FULFILLMENT MARKET FOR ABOVE 10000 SQUARE FEET, BY REGION 2021–2031 ($MILLION)
TABLE 32.MICRO FULFILLMENT MARKET REVENUE FOR MANUAL, BY REGION 2021–2031 ($MILLION)
TABLE 33.MICRO FULFILLMENT MARKET REVENUE FOR AUTOMATED, BY REGION 2021–2031 ($MILLION)
TABLE 34.MICRO FULFILLMENT MARKET REVENUE FOR MANUFACTURERS & DISTRIBUTORS, BY REGION 2020–2030 ($MILLION)
TABLE 35.NORTH AMERICA MICRO FULFILLMENT MARKET REVENUE FOR MANUFACTURERS & DISTRIBUTORS, BY COUNTRY 2021–2031($MILLION)
TABLE 36.EUROPE MICRO FULFILLMENT MARKET REVENUE FOR MANUFACTURERS & DISTRIBUTORS, BY COUNTRY 2021–2031($MILLION)
TABLE 37.ASIA-PACIFIC MICRO FULFILLMENT MARKET REVENUE FOR MANUFACTURERS & DISTRIBUTORS, BY COUNTRY 2021–2031($MILLION)
TABLE 38.LAMEA MICRO FULFILLMENT MARKET REVENUE FOR MANUFACTURERS & DISTRIBUTORS, BY COUNTRY  2021–2031($MILLION)
TABLE 39.MICRO FULFILLMENT MARKET REVENUE, BY REGION 2021–2031($MILLION)
TABLE 40.NORTH AMERICA MICRO FULFILLMENT MARKET REVENUE, BY COMPONENT 2021–2031($MILLION)
TABLE 41.NORTH AMERICA MICRO FULFILLMENT MARKET REVENUE, BY APPLICATION 2021–2031($MILLION)
TABLE 42.NORTH AMERICA MICRO FULFILLMENT MARKET REVENUE, BY END-USER INDUSTRY 2021–2031($MILLION)
TABLE 43.MICRO FULFILLMENT MARKET FOR RETAILERS, BY SIZE 2021–2031 ($MILLION)
TABLE 44.MICRO FULFILLMENT MARKET REVENUE FOR BELOW 10000 SQUARE FEET, BY TYPE 2021–2031 ($MILLION)
TABLE 45.NORTH AMERICA MICRO FULFILLMENT MARKET REVENUE, BY COUNTRY, 2021–2031($MILLION)
TABLE 46.U.S. MICRO FULFILLMENT MARKET REVENUE, BY COMPONENT 2021–2031($MILLION)
TABLE 47.U.S. MICRO FULFILLMENT MARKET REVENUE, BY APPLICATION 2021–2031($MILLION)
TABLE 48.U.S. MICRO FULFILLMENT MARKET REVENUE, BY END-USER INDUSTRY 2021–2031($MILLION)
TABLE 49.CANADA MICRO FULFILLMENT MARKET REVENUE, BY COMPONENT 2021–2031($MILLION)
TABLE 50.CANADA MICRO FULFILLMENT MARKET REVENUE, BY APPLICATION 2021–2031($MILLION)
TABLE 51.CANADA MICRO FULFILLMENT MARKET REVENUE, BY END-USER INDUSTRY 2021–2031($MILLION)
TABLE 52.MEXICO MICRO FULFILLMENT MARKET REVENUE, BY COMPONENT 2021–2031($MILLION)
TABLE 53.MEXICO MICRO FULFILLMENT MARKET REVENUE, BY APPLICATION 2021–2031($MILLION)
TABLE 54.MEXICO MICRO FULFILLMENT MARKET REVENUE, BY END-USER INDUSTRY 2021–2031($MILLION)
TABLE 55.EUROPE MICRO FULFILLMENT MARKET REVENUE, BY COMPONENT 2021–2031($MILLION)
TABLE 56.EUROPE MICRO FULFILLMENT MARKET REVENUE, BY APPLICATION 2021–2031($MILLION)
TABLE 57.EUROPE MICRO FULFILLMENT MARKET REVENUE, BY END-USER INDUSTRY 2021–2031($MILLION)
TABLE 58.MICRO FULFILLMENT MARKET FOR RETAILERS, BY SIZE 2021–2031 ($MILLION)
TABLE 59.MICRO FULFILLMENT MARKET REVENUE FOR BELOW 10000 SQUARE FEET, BY TYPE 2021–2031 ($MILLION)
TABLE 60.EUROPE MICRO FULFILLMENT MARKET REVENUE, BY COUNTRY, 2021–2031($MILLION)
TABLE 61.GERMANY MICRO FULFILLMENT MARKET REVENUE, BY COMPONENT 2021–2031($MILLION)
TABLE 62.GERMANY MICRO FULFILLMENT MARKET REVENUE, BY APPLICATION 2021–2031($MILLION)
TABLE 63.GERMANY MICRO FULFILLMENT MARKET REVENUE, BY END-USER INDUSTRY 2021–2031($MILLION)
TABLE 64.FRANCE MICRO FULFILLMENT MARKET REVENUE, BY COMPONENT 2021–2031($MILLION)
TABLE 65.FRANCE MICRO FULFILLMENT MARKET REVENUE, BY APPLICATION 2021–2031($MILLION)
TABLE 66.FRANCE MICRO FULFILLMENT MARKET REVENUE, BY END-USER INDUSTRY 2021–2031($MILLION)
TABLE 67.ITALY MICRO FULFILLMENT MARKET REVENUE, BY COMPONENT 2021–2031($MILLION)
TABLE 68.ITALY MICRO FULFILLMENT MARKET REVENUE, BY APPLICATION 2021–2031($MILLION)
TABLE 69.ITALY MICRO FULFILLMENT MARKET REVENUE, BY END-USER INDUSTRY 2021–2031($MILLION)
TABLE 70.UK MICRO FULFILLMENT MARKET REVENUE, BY COMPONENT 2021–2031($MILLION)
TABLE 71.UK MICRO FULFILLMENT MARKET REVENUE, BY APPLICATION 2021–2031($MILLION)
TABLE 72.UK MICRO FULFILLMENT MARKET REVENUE, BY END-USER INDUSTRY 2021–2031($MILLION)
TABLE 73.SPAIN MICRO FULFILLMENT MARKET REVENUE, BY COMPONENT 2021–2031($MILLION)
TABLE 74.SPAIN MICRO FULFILLMENT MARKET REVENUE, BY APPLICATION 2021–2031($MILLION)
TABLE 75.SPAIN MICRO FULFILLMENT MARKET REVENUE, BY END-USER INDUSTRY 2021–2031($MILLION)
TABLE 76.NETHERLANDS MICRO FULFILLMENT MARKET REVENUE, BY COMPONENT 2021–2031($MILLION)
TABLE 77.NETHERLANDS MICRO FULFILLMENT MARKET REVENUE, BY APPLICATION 2021–2031($MILLION)
TABLE 78.NETHERLANDS MICRO FULFILLMENT MARKET REVENUE, BY END-USER INDUSTRY 2021–2031($MILLION)
TABLE 79.REST OF EUROPE MICRO FULFILLMENT MARKET REVENUE, BY COMPONENT 2021–2031($MILLION)
TABLE 80.REST OF EUROPE MICRO FULFILLMENT MARKET REVENUE, BY APPLICATION 2021–2031($MILLION)
TABLE 81.REST OF EUROPE MICRO FULFILLMENT MARKET REVENUE, BY END-USER INDUSTRY 2021–2031($MILLION)
TABLE 82.ASIA-PACIFIC MICRO FULFILLMENT MARKET REVENUE, BY COMPONENT 2021–2031($MILLION)
TABLE 83.ASIA-PACIFIC MICRO FULFILLMENT MARKET REVENUE, BY APPLICATION 2021–2031($MILLION)
TABLE 84.ASIA-PACIFIC MICRO FULFILLMENT MARKET REVENUE, BY END-USER INDUSTRY 2021–2031($MILLION)
TABLE 85.MICRO FULFILLMENT MARKET FOR RETAILERS, BY SIZE 2021–2031 ($MILLION)
TABLE 86.MICRO FULFILLMENT MARKET REVENUE FOR BELOW 10000 SQUARE FEET, BY TYPE 2021–2031 ($MILLION)
TABLE 87.ASIA-PACIFIC MICRO FULFILLMENT MARKET REVENUE, BY COUNTRY, 2021–2031($MILLION)
TABLE 88.CHINA MICRO FULFILLMENT MARKET REVENUE, BY COMPONENT 2021–2031($MILLION)
TABLE 89.CHINA MICRO FULFILLMENT MARKET REVENUE, BY APPLICATION 2021–2031($MILLION)
TABLE 90.CHINA MICRO FULFILLMENT MARKET REVENUE, BY END-USER INDUSTRY 2021–2031($MILLION)
TABLE 91.JAPAN MICRO FULFILLMENT MARKET REVENUE, BY COMPONENT 2021–2031($MILLION)
TABLE 92.JAPAN MICRO FULFILLMENT MARKET REVENUE, BY APPLICATION 2021–2031($MILLION)
TABLE 93.JAPAN MICRO FULFILLMENT MARKET REVENUE, BY END-USER INDUSTRY 2021–2031($MILLION)
TABLE 94.INDIA MICRO FULFILLMENT MARKET REVENUE, BY COMPONENT 2021–2031($MILLION)
TABLE 95.INDIA MICRO FULFILLMENT MARKET REVENUE, BY APPLICATION 2021–2031($MILLION)
TABLE 96.INDIA MICRO FULFILLMENT MARKET REVENUE, BY END-USER INDUSTRY 2021–2031($MILLION)
TABLE 97.SOUTH KOREA MICRO FULFILLMENT MARKET REVENUE, BY COMPONENT 2021–2031($MILLION)
TABLE 98.SOUTH KOREA MICRO FULFILLMENT MARKET REVENUE, BY APPLICATION 2021–2031($MILLION)
TABLE 99.SOUTH KOREA MICRO FULFILLMENT MARKET REVENUE, BY END-USER INDUSTRY 2021–2031($MILLION)
TABLE 100.AUSTRALIA MICRO FULFILLMENT MARKET REVENUE, BY COMPONENT 2021–2031($MILLION)
TABLE 101.AUSTRALIA MICRO FULFILLMENT MARKET REVENUE, BY APPLICATION 2021–2031($MILLION)
TABLE 102.AUSTRALIA MICRO FULFILLMENT MARKET REVENUE, BY END-USER INDUSTRY 2021–2031($MILLION)
TABLE 103.INDONESIA MICRO FULFILLMENT MARKET REVENUE, BY COMPONENT 2021–2031($MILLION)
TABLE 104.INDONESIA MICRO FULFILLMENT MARKET REVENUE, BY APPLICATION 2021–2031($MILLION)
TABLE 105.INDONESIA MICRO FULFILLMENT MARKET REVENUE, BY END-USER INDUSTRY 2021–2031($MILLION)
TABLE 106.VIETNAM MICRO FULFILLMENT MARKET REVENUE, BY COMPONENT 2021–2031($MILLION)
TABLE 107.VIETNAM MICRO FULFILLMENT MARKET REVENUE, BY APPLICATION 2021–2031($MILLION)
TABLE 108.VIETNAM MICRO FULFILLMENT MARKET REVENUE, BY END-USER INDUSTRY 2021–2031($MILLION)
TABLE 109.REST OF ASIA-PACIFIC MICRO FULFILLMENT MARKET REVENUE, BY COMPONENT 2021–2031($MILLION)
TABLE 110.REST OF ASIA-PACIFIC MICRO FULFILLMENT MARKET REVENUE, BY APPLICATION 2021–2031($MILLION)
TABLE 111.REST OF ASIA-PACIFIC MICRO FULFILLMENT MARKET REVENUE, BY END-USER INDUSTRY 2021–2031($MILLION)
TABLE 112.LAMEA MICRO FULFILLMENT MARKET REVENUE, BY COMPONENT 2021–2031($MILLION)
TABLE 113.LAMEA MICRO FULFILLMENT MARKET REVENUE, BY APPLICATION 2021–2031($MILLION)
TABLE 114.LAMEA MICRO FULFILLMENT MARKET REVENUE, BY END-USER INDUSTRY 2021–2031($MILLION)
TABLE 115.MICRO FULFILLMENT MARKET FOR RETAILERS, BY SIZE 2021–2031 ($MILLION)
TABLE 116.MICRO FULFILLMENT MARKET REVENUE FOR BELOW 10000 SQUARE FEET, BY TYPE 2021–2031 ($MILLION)
TABLE 117.LAMEA MICRO FULFILLMENT MARKET REVENUE, BY COUNTRY, 2021–2031($MILLION)
TABLE 118.BRAZIL MICRO FULFILLMENT MARKET REVENUE, BY COMPONENT 2021–2031($MILLION)
TABLE 119.BRAZIL MICRO FULFILLMENT MARKET REVENUE, BY END-USER INDUSTRY 2021–2031($MILLION)
TABLE 120.BRAZIL MICRO FULFILLMENT MARKET REVENUE, BY END-USER INDUSTRY 2021–2031($MILLION)
TABLE 121.ARGENTINA MICRO FULFILLMENT MARKET REVENUE, BY COMPONENT 2021–2031($MILLION)
TABLE 122.ARGENTINA MICRO FULFILLMENT MARKET REVENUE, BY APPLICATION 2021–2031($MILLION)
TABLE 123.ARGENTINA MICRO FULFILLMENT MARKET REVENUE, BY END-USER INDUSTRY 2021–2031($MILLION)
TABLE 124.SAUDI ARABIA MICRO FULFILLMENT MARKET REVENUE, BY COMPONENT 2021–2031($MILLION)
TABLE 125.SAUDI ARABIA MICRO FULFILLMENT MARKET REVENUE, BY APPLICATION 2021–2031($MILLION)
TABLE 126.SAUDI ARABIA MICRO FULFILLMENT MARKET REVENUE, BY END-USER INDUSTRY 2021–2031($MILLION)
TABLE 127.UAE MICRO FULFILLMENT MARKET REVENUE, BY COMPONENT 2021–2031($MILLION)
TABLE 128.UAE MICRO FULFILLMENT MARKET REVENUE, BY APPLICATION 2021–2031($MILLION)
TABLE 129.UAE MICRO FULFILLMENT MARKET REVENUE, BY END-USER INDUSTRY 2021–2031($MILLION)
TABLE 130.SOUTH AFRICA MICRO FULFILLMENT MARKET REVENUE, BY COMPONENT 2021–2031($MILLION)
TABLE 131.SOUTH AFRICA MICRO FULFILLMENT MARKET REVENUE, BY APPLICATION 2021–2031($MILLION)
TABLE 132.SOUTH AFRICA MICRO FULFILLMENT MARKET REVENUE, BY END-USER INDUSTRY 2021–2031($MILLION)
TABLE 133.KENYA MICRO FULFILLMENT MARKET REVENUE, BY COMPONENT 2021–2031($MILLION)
TABLE 134.KENYA MICRO FULFILLMENT MARKET REVENUE, BY APPLICATION 2021–2031($MILLION)
TABLE 135.KENYA MICRO FULFILLMENT MARKET REVENUE, BY END-USER INDUSTRY 2021–2031($MILLION)
TABLE 136.AHOLD DELHAIZE: KEY EXECUTIVE
TABLE 137.AHOLD DELHAIZE: COMPANY SNAPSHOT
TABLE 138.AHOLD DELHAIZE: OPERATING SEGMENTS
TABLE 139.AHOLD DELHAIZE: PRODUCT PORTFOLIO
TABLE 140.ALERT INNOVATION, INC.: KEY EXECUTIVE
TABLE 141.ALERT INNOVATION, INC.: COMPANY SNAPSHOT
TABLE 142.ALERT INNOVATION, INC: OPERATING SEGMENTS
TABLE 143.ALERT INNOVATION, INC.: PRODUCT PORTFOLIO
TABLE 144.BASTIAN SOLUTIONS, LLC: KEY EXECUTIVE
TABLE 145.BASTIAN SOLUTIONS, LLC: COMPANY SNAPSHOT
TABLE 146.AHOLD DELHAIZE: OPERATING SEGMENTS
TABLE 147.BASTIAN SOLUTIONS, LLC: PRODUCT PORTFOLIO
TABLE 148.DAVINCI MICRO FULFILLMENT: KEY EXECUTIVE
TABLE 149.DAVINCI MICRO FULFILLMENT: COMPANY SNAPSHOT
TABLE 150.DEMATIC.: OPERATING SEGMENTS
TABLE 151.DAVINCI MICRO FULFILLMENT: PRODUCT PORTFOLIO
TABLE 152.FLOWSPACE: KEY EXECUTIVE
TABLE 153.FLOWSPACE: COMPANY SNAPSHOT
TABLE 154.FLOWSPACE.: OPERATING SEGMENTS
TABLE 155.FLOWSPACE: PRODUCT PORTFOLIO
TABLE 156.FORTNA INC.: KEY EXECUTIVE
TABLE 157.FORTNA INC.: COMPANY SNAPSHOT
TABLE 158.FORTNA INC.: OPERATING SEGMENTS
TABLE 159.FORTNA INC.: PRODUCT PORTFOLIO
TABLE 160.INSTACART: KEY EXECUTIVE
TABLE 161.INSTACART: COMPANY SNAPSHOT
TABLE 162.INSTACART: OPERATING SEGMENTS
TABLE 163.INSTACART: PRODUCT PORTFOLIO
TABLE 164.DEMATIC: KEY EXECUTIVES
TABLE 165.DEMATIC: COMPANY SNAPSHOT
TABLE 166.DEMATIC.: OPERATING SEGMENTS
TABLE 167.DEMATIC: PRODUCT PORTFOLIO
TABLE 168.KPI INTEGRATED SOLUTIONS: KEY EXECUTIVES
TABLE 169.KPI INTEGRATED SOLUTIONS: COMPANY SNAPSHOT
TABLE 170.KPI INTEGRATED SOLUTIONS: OPERATING SEGMENTS
TABLE 171.KPI INTEGRATED SOLUTIONS.: PRODUCT PORTFOLIO
TABLE 172.LOCAD: KEY EXECUTIVE
TABLE 173.LOCAD: COMPANY SNAPSHOT
TABLE 174.LOCAD: OPERATING SEGMENTS
TABLE 175.LOCAD: PRODUCT PORTFOLIO
TABLE 176.OPEX: KEY EXECUTIVE
TABLE 177.OPEX: COMPANY SNAPSHOT
TABLE 178.OPEX: OPERATING SEGMENTS
TABLE 179.OPEX: PRODUCT PORTFOLIO
TABLE 180.PACK & SEND HOLDINGS: KEY EXECUTIVE
TABLE 181.PACK & SEND HOLDINGS: COMPANY SNAPSHOT
TABLE 182.PACK & SEND HOLDINGS: OPERATING SEGMENTS
TABLE 183.PACK & SEND HOLDINGS: PRODUCT PORTFOLIO
TABLE 184.PACLINE OVERHEAD CONVEYORS: KEY EXECUTIVE
TABLE 185.PACLINE OVERHEAD CONVEYORS: COMPANY SNAPSHOT
TABLE 186.PACLINE OVERHEAD CONVEYORS: OPERATING SEGMENTS
TABLE 187.PACLINE OVERHEAD CONVEYORS: PRODUCT PORTFOLIO
TABLE 188.SWISSLOG HOLDING: KEY EXECUTIVE
TABLE 189.SWISSLOG HOLDING: COMPANY SNAPSHOT
TABLE 190.SWISSLOG HOLDING: OPERATING SEGMENTS
TABLE 191.AHOLD DELHAIZE: PRODUCT PORTFOLIO
TABLE 192.THE KROGER COMPANY: KEY EXECUTIVE
TABLE 193.THE KROGER COMPANY: COMPANY SNAPSHOT
TABLE 194.THE KROGER COMPANY: OPERATING SEGMENTS
TABLE 195.THE KROGER COMPANY: PRODUCT PORTFOLIO
TABLE 196.HONEYWELL INTERNATIONAL INC: KEY EXECUTIVE
TABLE 197.HONEYWELL INTERNATIONAL INC: COMPANY SNAPSHOT
TABLE 198.HONEYWELL INTERNATIONAL INC: OPERATING SEGMENTS
TABLE 199.HONEYWELL INTERNATIONAL INC: PRODUCT PORTFOLIO
TABLE 200.HÖRMANN: KEY EXECUTIVE
TABLE 201.HÖRMANN: COMPANY SNAPSHOT
TABLE 202.HÖRMANN: OPERATING SEGMENTS
TABLE 203.HÖRMANN: PRODUCT PORTFOLIO

LIST OF FIGURES

FIGURE 01.KEY MARKET SEGMENTS
FIGURE 02.SEGMENT EXECUTIVE SUMMARY
FIGURE 03.COUNTRY EXECUTIVE SUMMARY
FIGURE 04.TOP INVESTMENT POCKETS
FIGURE 05.MODERATE BARGAINING POWER OF SUPPLIERS
FIGURE 06.MODERATE BARGAINING POWER OF BUYERS
FIGURE 07.MODERATE THREAT OF SUBSTITUTES
FIGURE 08.LOW THREAT OF NEW ENTRANTS
FIGURE 09.HIGH INTENSITY OF RIVALRY
FIGURE 10.POLITICAL
FIGURE 11.ECONOMICAL
FIGURE 12.SOCIAL
FIGURE 13.TECHNOLOGICAL
FIGURE 14.ENVIRONMENTAL
FIGURE 15.LEGAL
FIGURE 16.VALUE CHAIN ANALYSIS
FIGURE 17.MARKET DYNAMICS: MICRO FULFILLMENT MARKET
FIGURE 18.MICRO FULFILLMENT MARKET, BY COMPONENT, 2021–2031
FIGURE 19.COMPARATIVE SHARE ANALYSIS OF MICRO FULFILLMENT MARKET REVENUE FOR CONTROL SYSTEMS,  BY COUNTRY, 2021 & 2031 (%)
FIGURE 20.COMPARATIVE SHARE ANALYSIS OF MICRO FULFILLMENT MARKET REVENUE FOR MATERIAL HANDLING,  BY COUNTRY, 2021 & 2031 (%)
FIGURE 21.MICRO FULFILLMENT MARKET, BY APPLICATION, 2021–2031
FIGURE 22.COMPARATIVE SHARE ANALYSIS OF MICRO FULFILLMENT MARKET REVENUE FOR GROCERY, BY COUNTRY,  2021 & 2031 (%)
FIGURE 23.COMPARATIVE SHARE ANALYSIS OF MICRO FULFILLMENT MARKET REVENUE FOR MERCHANDISE, BY COUNTRY, 2021 & 2031 (%)
FIGURE 24.MICRO FULFILLMENT MARKET, END-USER INDUSTRY, 2021–2031
FIGURE 25.COMPARATIVE SHARE ANALYSIS OF MICRO FULFILLMENT MARKET REVENUE FOR RETAILERS, BY COUNTRY,  2021 & 2031 (%)
FIGURE 26.COMPARATIVE SHARE ANALYSIS OF MICRO FULFILLMENT MARKET REVENUE FOR MANUFACTURERS & DISTRIBUTORS, BY COUNTRY, 2021 & 2031 (%)
FIGURE 27.MICRO FULFILLMENT MARKET, BY REGION, 2021-2031
FIGURE 28.U.S. MICRO FULFILLMENT MARKET REVENUE, 2021–2031($MILLION)
FIGURE 29.CANADA MICRO FULFILLMENT MARKET REVENUE, 2021–2031($MILLION)
FIGURE 30.MEXICO MICRO FULFILLMENT MARKET REVENUE, 2021–2031($MILLION)
FIGURE 31.GERMANY MICRO FULFILLMENT MARKET REVENUE, 2021–2031($MILLION)
FIGURE 32.FRANCE MICRO FULFILLMENT MARKET REVENUE, 2021–2031($MILLION)
FIGURE 33.ITALY MICRO FULFILLMENT MARKET REVENUE, 2021–2031($MILLION)
FIGURE 34.UK MICRO FULFILLMENT MARKET REVENUE, 2021–2031($MILLION)
FIGURE 35.SPAIN MICRO FULFILLMENT MARKET REVENUE, 2021–2031($MILLION)
FIGURE 36.NETHERLANDS MICRO FULFILLMENT MARKET REVENUE, 2021–2031($MILLION)
FIGURE 37.REST OF EUROPE MICRO FULFILLMENT MARKET REVENUE, 2021–2031($MILLION)
FIGURE 38.CHINA MICRO FULFILLMENT MARKET REVENUE, 2021–2031($MILLION)
FIGURE 39.JAPAN MICRO FULFILLMENT MARKET REVENUE, 2021–2031($MILLION)
FIGURE 40.INDIA MICRO FULFILLMENT MARKET REVENUE, 2021–2031($MILLION)
FIGURE 41.SOUTH KOREA MICRO FULFILLMENT MARKET REVENUE, 2021–2031($MILLION)
FIGURE 42.AUSTRALIA MICRO FULFILLMENT MARKET REVENUE, 2021–2031($MILLION)
FIGURE 43.INDONESIA MICRO FULFILLMENT MARKET REVENUE, 2021–2031($MILLION)
FIGURE 44.VIETNAM MICRO FULFILLMENT MARKET REVENUE, 2021–2031($MILLION)
FIGURE 45.REST OF ASIA-PACIFIC MICRO FULFILLMENT MARKET REVENUE, 2021–2031($MILLION)
FIGURE 46.BRAZIL MICRO FULFILLMENT MARKET REVENUE, 2021–2031($MILLION)
FIGURE 47.ARGENTINA MICRO FULFILLMENT MARKET REVENUE, 2021–2031($MILLION)
FIGURE 48.SAUDI ARABIA MICRO FULFILLMENT MARKET REVENUE, 2021–2031($MILLION)
FIGURE 49.UAE MICRO FULFILLMENT MARKET REVENUE, 2021–2031($MILLION)
FIGURE 50.SOUTH AFRICA MICRO FULFILLMENT MARKET REVENUE, 2021–2031($MILLION)
FIGURE 51.KENYA MICRO FULFILLMENT MARKET REVENUE, 2021–2031($MILLION)
FIGURE 52.TOP WINNING STRATEGIES, BY YEAR, 2020–2022
FIGURE 53.TOP WINNING STRATEGIES, BY DEVELOPMENT, 2020–2022
FIGURE 54.TOP WINNING STRATEGIES, BY COMPANY, 2020–2022
FIGURE 55.PRODUCT MAPPING OF TOP 17 KEY PLAYERS
FIGURE 56.COMPETITIVE DASHBOARD OF TOP 17 KEY PLAYERS
FIGURE 57.COMPETITIVE HEATMAP OF TOP 17 KEY PLAYERS
FIGURE 58.TOP PLAYER POSITIONING, 2021
FIGURE 59.AHOLD DELHAIZE: REVENUE, 2019–2021 ($MILLION)
FIGURE 60.AHOLD DELHAIZE: REVENUE SHARE BY SEGMENT, 2021 (%)
FIGURE 61.AHOLD DELHAIZE: REVENUE SHARE BY REGION, 2021 (%)
FIGURE 62.DEMATIC: REVENUE, 2019–2021 ($MILLION)
FIGURE 63.DEMATIC: REVENUE SHARE BY SEGMENT, 2021 (%)
FIGURE 64.DEMATIC: REVENUE SHARE BY REGION, 2021 (%)
FIGURE 65.THE KROGER COMPANY: REVENUE, 2019–2021 ($MILLION)
FIGURE 66.THE KROGER COMPANY: REVENUE SHARE BY SEGMENT, 2021 (%)
FIGURE 67.HONEYWELL INTERNATIONAL INC: R&D EXPENDITURE, 2019–2021 ($MILLION)
FIGURE 68.HONEYWELL INTERNATIONAL INC: REVENUE, 2019–2021 ($MILLION)
FIGURE 69.HONEYWELL INTERNATIONAL INC: REVENUE SHARE BY SEGMENT, 2021 (%)
FIGURE 70.HÖRMANN: R&D EXPENDITURE, 2019–2021 ($MILLION)
FIGURE 71.HÖRMANN: REVENUE, 2019–2021 ($MILLION)
FIGURE 72.HÖRMANN: REVENUE SHARE BY SEGMENT, 2021 (%)


The micro fulfilment market has witnessed significant growth in past few years, owing to surge in purchase from online channels. The market is also experiencing growth owing to increased number of residential complexes.

Micro fulfilment facilities offer a highly needed solution to the problems associated with the traditional method of delivery. Traditional method was slow, less profitable, and was negatively affected with human errors. Micro fulfilment facilities being closer to the consumers can quickly deliver perishable as well as non-perishable high demand products. The micro fulfilment facilities are largely free form human errors and are more productive with the wide scale use of automated system. Developed countries such as U.S., and Canada, which already had a highly developed e-commerce sector lead the micro fulfilment market. The respective governments in developing countries have implemented policies to help in the growth of the e-commerce sector. Trustable online payment methods have also positively influenced the market. Moreover, increase in number of residential complexes, fueled by urbanization plays critical role in the development of micro fulfilment market.

Furthermore, the advancements in artificial intelligence, automation, and communication protocols are anticipated to provide lucrative opportunities for the market growth.

PURCHASE OPTIONS

Call or Email us

U.S.-Canada Toll-free: +1-800-792-5285
Int'l : +1-503-894-6022
Europe : +44-845-528-1300
Email : help@alliedmarketresearch.com
 
FREQUENTLY ASKED QUESTIONS?

A. Rise in number of grocery delivery startups is a major trend positively influencing the Micro Fulfillment Market.

A. Micro Fulfillment centers are extensively used for grocery and merchandise delivery applications.

A. North America is the largest regional market for Micro Fulfillment.

A. $2,126.0 Million is the estimated industry size of Micro Fulfillment.

A. Ahold Delhaize, Alert Innovation, Inc., Bastian Solutions, LLC, Davinci Micro Fulfillment, Flowspace and Fortna Inc., are some of the top companies to hold the market share in Micro Fulfillment

A. The company profile has been selected on factors such as geographical presence, market dominance (in terms of revenue and volume sales), various strategies and recent developments.

A. The Micro Fulfillment market is projected to reach $ 88,329.5 million by 2031.

A. The latest version of the global Micro Fulfillment market report can be obtained on demand from the website.

Looking for Customization?

 Customization Request

Have a Question?

 Speak with Analyst

Any Confusion?

 Inquire Before Buying

Have a glance of the Report

  Request Sample
RELATED TAGS

Purchase Full Report of
Micro Fulfillment Market

Start reading instantly.
This Report and over 66,905+ more Reports, Available with Avenue Library. T&C*.

  • Online Only
  • $3,570
  • Online cloud access only
  • Restricted print, copy, paste & download
  • Read only
  • Free industry update
    (Within 180 days)
  • Free report update in next update cycle
    (Sep 2023 - Sep 2024)
  • Data Pack
  • $3,840
  • Restricted to one authorized user
  • One print only
  • Available in
    Excel
  • Free industry update
    (Within 180 days)
  •   Free report update in next update cycle
    (Sep 2023 - Sep 2024)
  • Single User
  • $5,769
  • Restricted to one authorized user
  • One print only
  • Available in
    PDF
  • Free industry update
    (Within 180 days)
  •   Free report update in next update cycle
    (Sep 2023 - Sep 2024)
  • Five Users
  • $6,450
  • Limited to five authorized users
  • Print upto five copies
  • Available in
    PDF
  • Free industry update
    (Within 180 days)
  •   Free report update in next update cycle
    (Sep 2023 - Sep 2024)
  • Enterprise
    License/PDF

  • $9,600
  • Unlimited
    within
    company/enterprise
  • Available in Excel & PDF
  • Free industry update
    (Within 180 days)
  •   Free report update in next update cycle
    (Sep 2023 - Sep 2024)
  • Library
    Membership

  • $999 $ 1,175
    Per User/ Per month/ Billed annually
  • Published Content
    E-access
  • Company Profiles
    E-access
  • Newly Added Content Access
  • 10 PDF
    Downloads
  • 5 Excel Data
    Pack Downloads
  • 250 Company Profiles PDF Downloads
  • Buy Now

*Taxes/Fees, if applicable will be added during checkout. All prices in USD

RELATED REPORTS
 

Why Allied Market Research?


Infallible Methodology

To ensure high-level data integrity, accurate analysis, and impeccable forecasts

Analyst Support

For complete satisfaction

Customization

On-demand customization of scope of the report to exactly meet your needs

TARGETED MARKET VIEW

Targeted market view to provide pertinent information and save time of readers

Get fresh content delivered

Get insights on topics that are crucial for your business. Stay abreast of your interest areas.

Get Industry Data Alerts

Why Allied Market Research?

Infallible Methodology

To ensure high-level data integrity, accurate analysis, and impeccable forecasts

Analyst Support

For complete satisfaction

Customization

On-demand customization of scope of the report to exactly meet your needs

TARGETED MARKET VIEW

Targeted market view to provide pertinent information and save time of readers