Report Code: A00127 | Sep 2016 | Pages: 104 | ||
Tables: 29 | Charts: 38 |
|
Pandemic disrupted the entire world and affected many industries.
Get detailed COVID-19 impact analysis on the Micro Irrigation Systems Market
Request Now !Micro Irrigation Systems Market is expected to garner $8,321 million by 2022, registering a CAGR of 16.6% during the forecast period 2016 - 2022. Irrigation involves provision of water to dry land for crop cultivation. The micro-irrigation process supplies water at frequent intervals above and below the soils surface. Micro-irrigation systems are generally low- or medium-pressure systems that deliver water in the form of sprinkles, spray, mist, drip, and jet. Due to rise in concerns of water scarcity, micro irrigation systems prove to be an innovative and efficient solution as compared to the conventional irrigation practices. The two major factors that drive the micro-irrigation systems market are an increase in the demand for food and agriculture products and a rise in water supply & storage problem.
The high initial investment and high maintenance cost of the micro-irrigation system act as the hindrance to the growth of the market. A micro-irrigation system is not a feasible option for the farmer with less area of cultivation. However, an increase in the investment from the companies is expected to reduce the impact of these restraints. Various companies develop cost-effective equipment for this market. The micro-irrigation market faces challenges from the high cost of equipment and narrow level of commercialization in the developing economies.
The report incorporates the study of micro-irrigation systems, and focuses on the various growth prospects and restraints in the market. The study highlights Porters five forces analysis for the market that comprises of the impact of suppliers, competitors, new entrants, substitutes, and buyers on the market. The study also depicts the value chain analysis for the world micro-irrigation systems market.
Segment Overview:
The micro-irrigation systems market is segmented on the basis of product type, crop type, application, and geography. The segmentation done under product type is sprinkler irrigation and drip irrigation. In 2015, the sprinkler irrigation systems contributed the highest revenue in the market, globally. However, the drip irrigation systems are anticipated to exhibit the fastest growth during the forecast period 2016 - 2022.
Based on crop type, the market is sub-segmented into plantation crops, field crops, orchard crops, and others. The orchard crop type segment garnered the highest revenue share in 2015 and is expected to exhibit the same during the forecast period. However, the plantation crop type is projected to have the fastest growth during the forecast period.
Based on applications, the market is segmented into small farming, large & corporate farming, government, and others. Among the application segments, small farming dominated the market in terms of expenditure, in 2015, and is projected to continue its dominance throughout the forecast period.
The geographical regions considered in the report are North America, Europe, Asia-Pacific, and LAMEA. Asia-Pacific currently constitutes the highest market share in the world micro irrigation systems market on account of massive irrigated areas and adoption of micro irrigation systems across the hilly terrains.
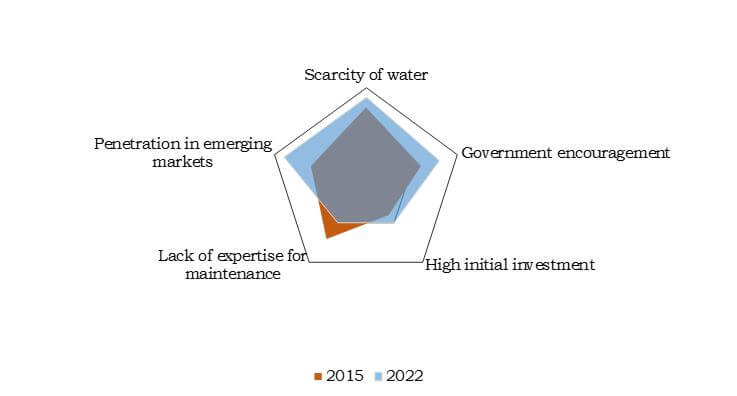
Scarcity of Water
Water is depleting to a greater extent and needs to be utilized optimally. Among the agricultural, industrial, and personal use sectors, the agricultural sector is the predominant consumer of water, globally. Micro-irrigation helps to avoid wastage of water, by using water in the form of spray, mist, drip, and other forms. Thus, micro-irrigation systems enhance productivity and reduce virtual water requirement in the agricultural sector. Hence, the impact of scarcity of water is remarkable at present; however, it is expected to increase during the forecast period owing to the depleting resources, environmental conditions, and increasing population.
Government Encouragement
Government plays a prime role in helping farmers for installing micro-irrigation systems, by providing subsidies to the small-scale farmers. Many regional government provide electricity free-of-cost to the farmers. Farmers in the developing countries are encouraged to adopt micro-irrigation systems to increase productivity through optimum water usage. Government encouragement drives the market, notably, and it is expected to have a strong impact on the market during the forecast period.
High Initial Investment
The installation of micro-irrigation systems requires high initial costs, as expensive components are used in the system. This restrains the growth of the world micro-irrigation systems market. The rise in prices of components and systems is also expected to increase the impact of the high initial investment on the market. Thus, currently, high initial investment has a notable impact on the market, which is expected to increase during the forecast period.
Key benefits
Micro Irrigation Systems Market Report Highlights
Aspects | Details |
---|---|
By Type |
|
By Crop Type |
|
By Application |
|
By Geography |
|
Key Market Players | Rivulis Irrigation Ltd., The Toro Company, Lindsay Corporation, T-L Irrigation Co., Rain Bird Corporation, Nelson Irrigation Corporation, Netafim Ltd., Hunter Industries, Jain Irrigation Systems Ltd., Valmont Industries, Inc. |
CHAPTER 1 INTRODUCTION
1.1 Report description
1.2 Key benefits
1.3 Key market segments
1.4 Research methodology
1.4.1 Secondary research
1.4.2 Primary research
1.4.3 Analyst tools and models
CHAPTER 2 EXECUTIVE SUMMARY
2.1 CXO perspective
CHAPTER 3 MARKET OVERVIEW
3.1 Market definition and scope
3.2 Key findings
3.2.1 Top impacting factors
3.2.1.1 Scarcity of water
3.2.1.2 Government encouragement
3.2.1.3 High initial investment
3.2.1.4 Lack of expertise for maintenance
3.2.1.5 Penetration in emerging markets
3.2.2 Top winning strategies
3.2.3 Top investment pockets
3.3 Value chain analysis
3.3.1 Manufacturers and importers
3.3.2 Machinery dealers
3.3.3 Local service providers
3.3.4 End users
3.4 Porters five forces analysis
3.4.1 Limited product knowledge and more concentrated suppliers have led to high bargaining power among suppliers
3.4.2 Minimal brand popularity and favorable government policies have led to high threat of new entrants in the market
3.4.3 High initial investments and better productivity & optimum resource utilization of the industry product have led to moderate threat of substitutes in the market
3.4.4 Numerous competitors and insignificant brand loyalty have led to high rivalry in the market
3.4.5 Less knowledge about the product has led to low bargaining power among buyers
3.5 Market player positioning, 2015
3.6 Market dynamics
3.6.1 Drivers
3.6.1.1 Scarcity of water
3.6.1.2 Crop yield enhancement
3.6.1.3 Government encouragement
3.6.2 Restraints
3.6.2.1 High initial investment
3.6.2.2 Lack of expertise for maintenance
3.6.3 Opportunities
3.6.3.1 Penetration in emerging markets
3.6.3.2 Growth in greenhouse vegetable production
CHAPTER 4 WORLD MICRO IRRIGATION SYSTEMS MARKET, BY TYPE
4.1 Sprinkler irrigation
4.1.1 Key market trends
4.1.2 Key drivers and opportunities
4.1.3 Market size and forecast
4.2 Drip irrigation
4.2.1 Key market trends
4.2.2 Key drivers and opportunities
4.2.3 Market size and forecast
CHAPTER 5 WORLD MICRO IRRIGATION SYSTEMS MARKET, BY CROP TYPE
5.1 Plantation crops
5.1.1 Key market trends
5.1.2 Key drivers and opportunities
5.1.3 Market size and forecast
5.2 Field crops
5.2.1 Key market trends
5.2.2 Key drivers and opportunities
5.2.3 Market size and forecast
5.3 Orchard crops
5.3.1 Key market trends
5.3.2 Key drivers and opportunities
5.3.3 Market size and forecast
5.4 Other (forage and turf grasses)
5.4.1 Key market trends
5.4.2 Key drivers and opportunities
5.4.3 Market size and forecast
CHAPTER 6 WORLD MICRO IRRIGATION SYSTEMS MARKET, BY APPLICATION
6.1 Small-scale farming
6.1.1 Key market trends
6.1.2 Key drivers and opportunities
6.1.3 Market size and forecast
6.2 Large and corporate farming
6.2.1 Key market trends
6.2.2 Key drivers and opportunities
6.2.3 Market size and forecast
6.3 Government
6.3.1 Key market trends
6.3.2 Key drivers and opportunities
6.3.3 Market size and forecast
6.4 Others (private/residential gardens, commercial)
6.4.1 Key market trends
6.4.2 Key drivers and opportunities
6.4.3 Market size and forecast
CHAPTER 7 WORLD MICRO IRRIGATION SYSTEMS MARKET, BY GEOGRAPHY
7.1 North America
7.1.1 Key market trends
7.1.2 Key growth factors and opportunities
7.1.3 Market size and forecast
7.1.4 U.S.
7.1.4.1 Market size and forecast
7.1.5 Canada
7.1.5.1 Market size and forecast
7.1.6 Mexico
7.1.6.1 Market size and forecast
7.2 Europe
7.2.1 Key market trends
7.2.2 Key growth factors and opportunities
7.2.3 Market size and forecast
7.2.4 U.K.
7.2.4.1 Market size and forecast
7.2.5 Russia
7.2.5.1 Market size and forecast
7.2.6 France
7.2.6.1 Market size and forecast
7.2.7 Germany
7.2.7.1 Market size and forecast
7.2.8 Rest of Europe
7.2.8.1 Market size and forecast
7.3 Asia-Pacific
7.3.1 Key market trends
7.3.2 Key growth factors and opportunities
7.3.3 Market size and forecast
7.3.4 India
7.3.4.1 Market size and forecast
7.3.5 China
7.3.5.1 Market size and forecast
7.3.6 Japan
7.3.6.1 Market size and forecast
7.3.7 Australia
7.3.7.1 Market size and forecast
7.3.8 Rest of Asia-Pacific
7.3.8.1 Market size and forecast
7.4 LAMEA
7.4.1 Key market trends
7.4.2 Key growth factors and opportunities
7.4.3 Market size and forecast
7.4.4 Latin America
7.4.4.1 Market size and forecast
7.4.5 Middle East
7.4.5.1 Market size and forecast
7.4.6 Africa
7.4.6.1 Market size and forecast
CHAPTER 8 COMPANY PROFILE
8.1 Valmont Industries, Inc.
8.1.1 Company overview
8.1.2 Company snapshot
8.1.3 Business performance
8.1.4 Strategic moves and developments
8.2 Hunter Industries
8.2.1 Company overview
8.2.2 Company snapshot
8.2.3 Strategic moves and developments
8.3 The Toro Company
8.3.1 Company overview
8.3.2 Company snapshot
8.3.3 Business performance
8.3.4 Strategic moves and developments
8.4 Jain Irrigation Systems Ltd.
8.4.1 Company overview
8.4.2 Company snapshot
8.4.3 Business performance
8.4.4 Strategic moves and developments
8.5 Nelson Irrigation Corporation
8.5.1 Company overview
8.5.2 Company snapshot
8.5.3 Strategic moves and developments
8.6 Netafim Ltd.
8.6.1 Company overview
8.6.2 Company snapshot
8.6.3 Strategic moves and developments
8.7 Lindsay Corporation
8.7.1 Company overview
8.7.2 Company snapshot
8.7.3 Business performance
8.7.4 Strategic moves and developments
8.8 T-L Irrigation Co.
8.8.1 Company overview
8.8.2 Company snapshot
8.8.3 Strategic moves and developments
8.9 Rain Bird Corporation
8.9.1 Company overview
8.9.2 Company snapshot
8.9.3 Strategic moves and developments
8.10 Rivulis Irrigation Ltd.
8.10.1 Company overview
8.10.2 Company snapshot
8.10.3 Strategic moves and developments
List of Figures
FIG. 1 TOP IMPACTING FACTORS
FIG. 2 TOP WINNING STRATEGIES IN MICRO IRRIGATION SYSTEMS MARKET
FIG. 3 TOP WINNING STRATEGY ANALYSIS
FIG. 4 TOP INVESTMENT POCKETS
FIG. 5 VALUE CHAIN ANALYSIS OF MICRO IRRIGATION SYSTEMS MARKET
FIG. 6 PORTERS FIVE FORCES ANALYSIS
FIG. 7 MARKET PLAYER POSITIONING
FIG. 8 WATER CONSUMPTION ACROSS THE WORLD, 2015 (%)
FIG. 9 US PROJECTED WATER USE, 2015 (%)
FIG. 10 U.S. MARKET, REVENUE, 2014-2022 ($MILLION)
FIG. 11 CANADA MARKET, REVENUE, 2014-2022 ($MILLION)
FIG. 12 MEXICO MARKET, REVENUE, 2014-2022 ($MILLION)
FIG. 13 U.K. MARKET, REVENUE, 2014-2022 ($MILLION)
FIG. 14 RUSSIA MARKET, REVENUE, 2014-2022 ($MILLION)
FIG. 15 FRANCE MARKET, REVENUE, 2014-2022 ($MILLION)
FIG. 16 GERMANY MARKET, REVENUE, 2014-2022 ($MILLION)
FIG. 17 REST OF EUROPE MARKET, REVENUE, 2014-2022 ($MILLION)
FIG. 18 INDIA MARKET, REVENUE, 2015-2022 ($MILLION)
FIG. 19 CHINA MARKET, REVENUE, 2015-2022 ($MILLION)
FIG. 20 JAPAN MARKET, REVENUE, 2015-2022 ($MILLION)
FIG. 21 AUSTRALIA MARKET, REVENUE, 2015-2022 ($MILLION)
FIG. 22 REST OF ASIA-PACIFIC MARKET, REVENUE, 2015-2022 ($MILLION)
FIG. 23 LATIN AMERICA MARKET, REVENUE, 2015-2022 ($MILLION)
FIG. 24 MIDDLE EAST MARKET, REVENUE, 2015-2022 ($MILLION)
FIG. 25 AFRICA MARKET, REVENUE, 2015-2022 ($MILLION)
FIG. 26 VALMONT INDUSTRIES, INC.: NET SALES, 20122015 ($MILLION)
FIG. 27 VALMONT INDUSTRIES, INC.: NET SALES, BY DIVISION, 2015 (%)
FIG. 28 VALMONT INDUSTRIES, INC.: NET SALES, BY GEOGRAPHY, 2015 (%)
FIG. 29 THE TORO COMPANY: NET SALES, 20122015 ($MILLION)
FIG. 30 THE TORO COMPANY: NET SALES, BY DIVISION, 2015 (%)
FIG. 31 THE TORO COMPANY: NET SALES, PROFESSIONAL SEGMENT, 2015 (%)
FIG. 32 THE TORO COMPANY, NET SALES, BY GEOGRAPHY, 2015 (%)
FIG. 33 JAIN IRRIGATION SYSTEMS LTD.: NET REVENUE, 20122015 ($MILLION)
FIG. 34 JAIN IRRIGATION SYSTEMS LTD.: NET REVENUE, BY DIVISION, 2015 (%)
FIG. 35 JAIN IRRIGATION SYSTEMS LTD.: NET REVENUE, BY GEOGRAPHY, 2015 (%)
FIG. 36 LINDSAY CORPORATION: NET REVENUE, 20122015 ($MILLION)
FIG. 37 LINDSAY CORPORATION: NET REVENUE, BY DIVISION, 2015 (%)
FIG. 38 LINDSAY CORPORATION: NET REVENUE, BY GEOGRAPHY, 2015 (%)
List of Tables
TABLE 1 WORLD MICRO IRRIGATION SYSTEMS MARKET, REVENUE, BY GEOGRAPHY, 20142022 ($MILLION)
TABLE 2 SPRINKLER MICRO IRRIGATION SYSTEMS MARKET, BY GEOGRAPHY 2015-2022 ($MILLION)
TABLE 3 DRIP MICRO IRRIGATION SYSTEMS MARKET, BY GEOGRAPHY 2015-2022 ($MILLION)
TABLE 4 PLANTATION CROPS MARKET, BY GEOGRAPHY 2014-2022 ($MILLION)
TABLE 5 FIELD CROPS MARKET, BY GEOGRAPHY 2014-2022 ($MILLION)
TABLE 6 ORCHARD CROPS MARKET, BY GEOGRAPHY 2014-2022 ($MILLION)
TABLE 7 OTHER CROPS MARKET, BY GEOGRAPHY 2014-2022 ($MILLION)
TABLE 8 SMALL-SCALE FARMING MARKET, BY GEOGRAPHY 2014-2022 ($MILLION)
TABLE 9 LARGE AND CORPORATE FARMING MARKET, BY GEOGRAPHY 2014-2022 ($MILLION)
TABLE 10 GOVERNMENT FARMING MARKET, BY GEOGRAPHY 2014-2022 ($MILLION)
TABLE 11 OTHER FARMING MARKET, BY GEOGRAPHY 2014-2022 ($MILLION)
TABLE 12 NORTH AMERICA MICRO IRRIGATION SYSTEMS MARKET, BY TYPE 2014-2022 ($MILLION)
TABLE 13 NORTH AMERICA MICRO IRRIGATION SYSTEMS MARKET, BY COUNTRY 2015 ($MILLION)
TABLE 14 EUROPE MICRO IRRIGATION SYSTEMS MARKET, BY TECHNOLOGY 2014-2022 ($MILLION)
TABLE 15 EUROPE MICRO IRRIGATION SYSTEMS MARKET, BY COUNTRY, 2014 ($MILLION)
TABLE 16 ASIA-PACIFIC MICRO IRRIGATION SYSTEMS MARKET, BY TECHNOLOGY 2015-2022 ($MILLION)
TABLE 17 ASIA-PACIFIC MICRO IRRIGATION SYSTEMS MARKET, BY COUNTRY, 2015 ($MILLION)
TABLE 18 LAMEA MICRO IRRIGATION SYSTEMS MARKET, BY TECHNOLOGY 2015-2022 ($MILLION)
TABLE 19 LAMEA MICRO IRRIGATION SYSTEMS MARKET, BY COUNTRY, 2015, ($MILLION)
TABLE 20 VALMONT INDUSTRIES, INC.: COMPANY SNAPSHOT
TABLE 21 HUNTER INDUSTRIES: COMPANY SNAPSHOT
TABLE 22 THE TORO COMPANY: COMPANY SNAPSHOT
TABLE 23 JAIN IRRIGATION SYSTEMS LTD.: COMPANY SNAPSHOT
TABLE 24 NELSON IRRIGATION CORPORATION: COMPANY SNAPSHOT
TABLE 25 NETAFIM LTD.: COMPANY SNAPSHOT
TABLE 26 LINDSAY CORPORATION: COMPANY SNAPSHOT
TABLE 27 T-L IRRIGATION CO.: COMPANY SNAPSHOT
TABLE 28 RAIN BIRD CORPORATION: COMPANY SNAPSHOT
TABLE 29 RIVULIS IRRIGATION LTD.: COMPANY SNAPSHOT
Â
The world micro irrigation systems market is expected to witness a remarkable growth due to the technological advancements and increase in awareness during the forecast period. The demand for easy system functionalities has further propelled this growth particularly in the rural sector. Moreover, adoption in emerging economies and growth in greenhouse vegetable production are the expected growth perspectives for the market. The market growth is restricted by factors such as high initial investments and lack of expertise for maintenance.
Micro irrigation systems have been increasingly employed in Asia-Pacific, followed by LAMEA, North America, and Europe. The highest market share of the market in Asia-Pacific is attributed to the increasing adoption in China and India.
Among drip and sprinkler irrigation system, sprinkler irrigation is leading the market due to ease of automation and wider irrigation area coverage by such systems. Besides this, the crop type orchard crops have dominated the market owing to decreased labor costs, and increased efficiency. Small farming application have dominated other applications of micro irrigation systems owing to massive farmlands under this sub-segment.
Manufacturers in the market focus on product innovation with exceptional product offerings to lead in the market. Jain Irrigation Systems Ltd., Netafim Ltd., and The Toro Company are the leading market players, occupying prominent revenue-share. These players adopt R&D, product launch, and acquisition as their key strategies to sustain in the market.
Start reading instantly.
This Report and over 66,905+ more Reports, Available with Avenue Library. T&C*.
Enterprise
License/PDF
Library
Membership
*Taxes/Fees, if applicable will be added during checkout. All prices in USD
To ensure high-level data integrity, accurate analysis, and impeccable forecasts
For complete satisfaction
On-demand customization of scope of the report to exactly meet your needs
Targeted market view to provide pertinent information and save time of readers
Get insights on topics that are crucial for your business. Stay abreast of your interest areas.
Get Industry Data AlertsTo ensure high-level data integrity, accurate analysis, and impeccable forecasts
For complete satisfaction
On-demand customization of scope of the report to exactly meet your needs
Targeted market view to provide pertinent information and save time of readers