0
2021
Micro Motor Market

Micro Motor Market

by Type (AC and DC), Technology (Brushed Motor and Brushless Motor), Power Consumption (Less Than 10V, 10V-20V, and More Than 20V), and Application (Industrial, Automotive & Aerospace, Healthcare, and Others): Global Opportunity Analysis and Industry Forecast, 2021-2030

Report Code: A12183
Jul 2021 | Pages: 267
Tables: 128
Charts: 65
  • Formats*:

  • pdf

    Single User License, Five User
    License & Enterprise User License

  • xls

    Data Pack Excel License

  • ppt

    It comes with the additional cost
    of $2500.00 contact sales.


COVID-19

Pandemic disrupted the entire world and affected many industries.

Get detailed COVID-19 impact analysis on the Micro Motor Market

Request Now !

Micro Motor Market Outlook- 2030

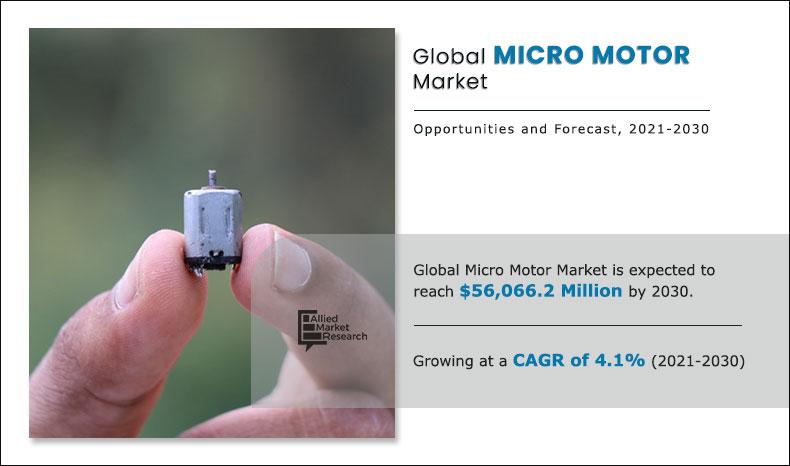
The global micro motor market size was $ 36,477.9 million in 2020, and is expected to reach $56,066.2 million by 2030, with a CAGR of 4.1% from 2021 to 2030. Micro motor is lighter and compact in size. Micro motor is basically designed for low power consumption and minimize electromagnetic interference. Micro motor has features such as quick operation, superior performance, and broader power option. Micro motor finds applications in drilling, polishing, grinding, and various other industrial applications. Micro motor is available in both modes brushed as well as brushless. Micro motor is widely used in industrial and aerospace industry. Micro motor is available in power range of 1V to 60V. The factors that make a micro motor advantageous over other motors are electronic control, high power to weight ratio, and high speed. They find their applications in hand-held power tools, computer peripherals, printers, disk drives, and vehicles. 

The COVID-19 pandemic has negatively influenced the global micro motor market primarily due to the halt in international trade, prolonged lockdowns, and ceased processes in manufacturing and electronics industry.

The benefits associated with micro motor such as high torque, low noise level, save energy, and increase operational efficiency fuel the micro motor market growth . The rise in trend of industrial automation and growing popularity of miniature electronic devices fuel the growth of the micro motor market. Micro motor finds use in various applications such as hand dryer, surgical devices, fans, pumps, compressors, and domestic appliances. Increase in urban population and rise in consumer awareness about eco-friendly products drive the micro motor market growth.   

Micro-Motor-Market-2021-2030

A rise in demand for DC motors in HVAC, agriculture, and other applications, owing to features such as energy efficiency, variable speed, environment friendly, compact size, and minimal maintenance cost drive the growth of the market. An increase in urbanization and industrialization in emerging countries such as Germany, France, the U.S., and others fuels the demand for automotive vehicle. This is expected to fuel the demand for micro motor; thereby, driving the growth of the 10V-20V micro motor globally. For instance, degree of urbanization in the U.S. increased by 0.4% from 2017 to 2019.

In addition, micro motor is used in various industry verticals such as agriculture, medical, healthcare, and automotive, owing to rise in demand for motors. The healthcare industry in various countries such as the UK, the U.S., and India is growing at a significant pace, due to increase in investments in this sector by government. For instance, in 2018, the UK Government spent $252.9 billion on the healthcare industry. This is expected to drive the demand for brushless DC motors, owing to features such as energy efficient, high torque, and high rpm. Growth in demand for HVACs in the Middle East, especially in Gulf Cooperation Council (GCC) countries and increase in demand for HVAC in the UAE due to rise in focus to decrease the dependence on oil drive the growth of the micro motor market in this region. Additionally, events such as World Expo 2020 in UAE and FIFA World Cup 2022 in Qatar boost the demand for infrastructure and HVAC. This is expected to increase the demand for micro motor in the Middle East. All such instances drive the growth of the micro motor market. 

However, slow-down in the automotive industry and high initial capital investment are expected to restraint the growth of the micro motor market. Furthermore, rise in demand for micro motor from robotics and automated robot technologies is anticipated to provide lucrative opportunities for the growth of the micro motor market. 

Micro Motor Market
By Type

Your browser does not support the canvas element.

AC segment holds dominant position in 2020

Get more information on this report : Request Sample Pages

The global micro motor market is segmented on the basis of type, technology, power consumption, application, and region. On the basis of type, the market is divided into AC and DC. The AC segment generated the highest revenue in 2020. Based on technology, the market is divided into brushed and brushless. The brushed segment dominated the market in 2020. On the basis of power consumption, the market is categorized into less than 10V, 10V-20V, and more than 20V. More than 20V segment generated the highest revenue in 2020. Based on application, the market is divided into industrial, automotive & aerospace, healthcare, and others. The industrial segment dominated the market in 2020. 

Region wise, the global micro motor market analysis is conducted across North America (the U.S., Canada, and Mexico), Europe (the UK, France, Germany, Italy, and rest of Europe), Asia-Pacific (China, Japan, India, Australia, and rest of Asia-Pacific), and LAMEA (Latin America, the Middle East, and Africa). In 2020, Asia-Pacific was the highest contributor to the global micro motor market share, and is anticipated to secure a leading position during the forecast period.

Micro Motor Market
By Technology

Your browser does not support the canvas element.

Brushed Motor segment is expected to grow at a significant CAGR

Get more information on this report : Request Sample Pages

Competition Analysis

Key players profiled in this report include Mabuchi Motor Co Ltd, Nidec Corporation, Buhler Motor GmbH, Johnson Electric Holdings Limited, Maxon Motor AG, Arc Systems Inc, ABB Group, Mitsuba Corporation, Constar Micromotor Co Ltd, and Siemens AG.

The key players in this market adopted product launch, partnership, and expansion as their key strategies to meet the changing consumer demands. For instance, in February 2021, Nidec Corporation acquired Mitsubishi Heavy Industries Machine Tools Co. Ltd, based in Japan, deals in motors, machine tools, cutting tools, and related products. The acquisition aimed to improve the product portfolio of motors and actuators.

Micro Motor Market
By Region

2030
Asia-pacific 
North America
Europe
LAMEA

Asia-Pacific Region is expected to dominate the market during the forecast period.

Get more information on this report : Request Sample Pages

Key Benefits For Stakeholders

  • The report provides an extensive analysis of the current micro motor market trends and future estimations.  
  • Extensive analysis of global micro motor market is conducted by following key product positioning and monitoring of the top competitors within the market framework.
  • A comprehensive analysis of all the regions is provided to determine the prevailing opportunities.
  • The global micro motor market forecast analysis from 2021 to 2030 is included in the report.
  • The key market players within the global micro motor market are profiled in this report and their strategies are analyzed thoroughly, which help understand the competitive outlook of the global micro motor market.

Global Micro Motor Market Segments

By Type

  • AC
  • DC

By Technology

  • Brushed Motor
  • Brushless Motor

By Power Consumption

  • Below 9V
  • 10V-20V
  • 21V-50V
  • More than 50V

By Application

  • Industrial
  • Automotive & Aerospace
  • Healthcare 
  • Others 

By Region

  • North America
    • U.S.
    • Canada
    • Mexico
  • Europe
    • Germany
    • France
    • UK
    • Italy
    • Rest of Europe
  • Asia-Pacific
    • China
    • Japan
    • India
    • Australia
    • Rest of Asia-Pacific
  • LAMEA
    • Latin America 
    • Middle East
    • Africa

Key Players

  • Mabuchi Motor Co Ltd
  • Nidec Corporation
  •  Buhler Motor GmbH
  • Johnson Electric Holdings Limited
  •  Maxon Motor AG
  •  Arc Systems Inc
  • ABB Group
  • Mitsuba Corporation
  •  Constar Micromotor Co Ltd
  • Siemens AG.

Micro Motor Market Report Highlights

Aspects Details
By Type
  • AC
  • DC
By Technology
  • Brushed Motor
  • Brushless Motor
By Power Consumption
  • Below 9V
  • 10V-20V
  • 21V-50V
  • More than 50V
By Application
  • Industrial
  • Automotive & Aerospace
  • Healthcare
  • Others
By Region
  • North America  (U.S., Canada, Mexico)
  • Europe  (France, Germany, Italy, Spain, UK, Russia, Rest of Europe)
  • Asia-Pacific  (China, Japan, India, South Korea, Australia, Thailand, Malaysia, Indonesia, Rest of Asia-Pacific)
  • LAMEA  (Brazil, South Africa, Saudi Arabia, UAE, Argentina, Rest of LAMEA)
Key Market Players Constar Micromotor Co Ltd, ARC SYSTEMS INC., BÜHLER MOTOR GmbH, SIEMENS AG, MAXON MOTORS AG, NIDEC CORPORATION, Mitsuba Corporation, Mabuchi Motor Co Ltd, JOHNSON ELECTRIC HOLDINGS LIMITED, ABB GROUP
 

CHAPTER 1:INTRODUCTION

1.1.Report description
1.2.Key benefits for stakeholders
1.3.Key market segments
1.4.Key market players
1.5.Research methodology

1.5.1.Primary research
1.5.2.Secondary research
1.5.3.Analyst tools and models

CHAPTER 2:EXECUTIVE SUMMARY

2.1.Key Findings of The Study
2.2.CXO perspective

CHAPTER 3:MARKET OVERVIEW

3.1.Market definition and scope
3.2.Key Findings

3.2.1.Top Investment Pockets
3.2.2.Top winning strategies

3.3.Porter's five forces analysis
3.4.Market player positioning, 2020
3.5.Market dynamics

3.5.1.Drivers

3.5.1.1.Benefit associated with micro motor
3.5.1.2.Growth in use of micro motors in HVAC end users
3.5.1.3.Rise in awareness about electric and green vehicles among customers

3.5.2.Restraints

3.5.2.1.Fluctuation in raw material prices
3.5.2.2.High initial cost of investment and complexity

3.5.3.Opportunity

3.5.3.1.Standardization and regulatory norms in emerging markets

3.6.COVID-19 Impact Analysis

CHAPTER 4:GLOBAL MICRO MOTOR MARKET, BY TYPE

4.1.Overview

4.1.1.Market size and forecast, by type

4.2.AC

4.2.1.Key market trends, growth factors, and opportunities
4.2.2.Market size and forecast, by region

4.2.2.1.Market size and forecast, by type

4.2.3.Market analysis, by country

4.3.DC

4.3.1.Key market trends, growth factors, and opportunities
4.3.2.Market size and forecast, by region

4.3.2.1.Market size and forecast, by type

4.3.3.Market analysis, by country

CHAPTER 5:GLOBAL MICRO MOTOR MARKET, BY TECHNOLOGY

5.1.Overview

5.1.1.Market size and forecast, by technology

5.2.Brushed Motor

5.2.1.Key market trends, growth factors, and opportunities
5.2.2.Market size and forecast, by region

5.2.2.1.Market size and forecast, by technology

5.2.3.Market analysis, by country

5.3.Brushless Motor

5.3.1.Key market trends, growth factors, and opportunities
5.3.2.Market size and forecast, by region

5.3.2.1.Market size and forecast, by technology

5.3.3.Market analysis, by country

CHAPTER 6:GLOBAL MICRO MOTOR MARKET, BY POWER CONSUMTPION

6.1.Overview

6.1.1.Market size and forecast, by power consumption

6.2.Less than 10V

6.2.1.Key market trends, growth factors, and opportunities
6.2.2.Market size and forecast, by region
6.2.3.Market analysis, by country

6.3.10V-20V

6.3.1.Key market trends, growth factors, and opportunities
6.3.2.Market size and forecast, by region
6.3.3.Market analysis, by country

6.4.More than 20V

6.4.1.Key market trends, growth factors, and opportunities
6.4.2.Market size and forecast, by region
6.4.3.Market analysis, by country

CHAPTER 7:GLOBAL MICRO MOTOR MARKET, BY APPLICATION

7.1.Overview

7.1.1.Market size and forecast, by power consumption

7.2.Industrial

7.2.1.Key market trends, growth factors, and opportunities
7.2.2.Market size and forecast, by region
7.2.3.Market analysis, by country

7.3.Automotive & Aerospace

7.3.1.Key market trends, growth factors, and opportunities
7.3.2.Market size and forecast, by region
7.3.3.Market analysis, by country

7.4.Healthcare

7.4.1.Key market trends, growth factors, and opportunities
7.4.2.Market size and forecast, by region
7.4.3.Market analysis, by country

7.5.Others

7.5.1.Key market trends, growth factors, and opportunities
7.5.2.Market size and forecast, by region
7.5.3.Market analysis, by country

CHAPTER 8:MICRO MOTOR MARKET, BY REGION

8.1.Overview

8.1.1.Market size and forecast, by region

8.2.North America

8.2.1.Key market trends, growth factors, and opportunities
8.2.2.Market size and forecast, by type

8.2.2.1.North America market size and forecast, by type

8.2.3.Market size and forecast, by technology

8.2.3.1.North America market size and forecast, by technology

8.2.4.Market size and forecast, by power consumption
8.2.5.Market size and forecast, by application
8.2.6.Market analysis, by country

8.2.6.1.U.S.

8.2.6.1.1.Market size and forecast, by type
8.2.6.1.2.Market size and forecast, by technology
8.2.6.1.3.Market size and forecast, by power consumption
8.2.6.1.4.Market size and forecast, by application

8.2.6.2.Canada

8.2.6.2.1.Market size and forecast, by type
8.2.6.2.2.Market size and forecast, by technology
8.2.6.2.3.Market size and forecast, by power consumption
8.2.6.2.4.Market size and forecast, by application

8.2.6.3.Mexico

8.2.6.3.1.Market size and forecast, by type
8.2.6.3.2.Market size and forecast, by technology
8.2.6.3.3.Market size and forecast, by power consumption
8.2.6.3.4.Market size and forecast, by application

8.3.Europe

8.3.1.Key market trends, growth factors, and opportunities
8.3.2.Market size and forecast, by type

8.3.2.1.Europe market size and forecast, by type

8.3.3.Market size and forecast, by technology

8.3.3.1.Europe market size and forecast, by technology

8.3.4.Market size and forecast, by power consumption
8.3.5.Market size and forecast, by application
8.3.6.Market analysis, by country
8.3.7.Germany

8.3.7.1.1.Market size and forecast, by type
8.3.7.1.2.Market size and forecast, by technology
8.3.7.1.3.Market size and forecast, by power consumption
8.3.7.1.4.Market size and forecast, by application

8.3.7.2.France

8.3.7.2.1.Market size and forecast, by type
8.3.7.2.2.Market size and forecast, by technology
8.3.7.2.3.Market size and forecast, by power consumption
8.3.7.2.4.Market size and forecast, by application

8.3.7.3.UK

8.3.7.3.1.Market size and forecast, by type
8.3.7.3.2.Market size and forecast, by technology
8.3.7.3.3.Market size and forecast, by power consumption
8.3.7.3.4.Market size and forecast, by application

8.3.7.4.Italy

8.3.7.4.1.Market size and forecast, by type
8.3.7.4.2.Market size and forecast, by technology
8.3.7.4.3.Market size and forecast, by power consumption
8.3.7.4.4.Market size and forecast, by application

8.3.7.5.Rest of Europe

8.3.7.5.1.Market size and forecast, by type
8.3.7.5.2.Market size and forecast, by technology
8.3.7.5.3.Market size and forecast, by power consumption
8.3.7.5.4.Market size and forecast, by application

8.4.Asia-Pacific

8.4.1.Key market trends, growth factors, and opportunities
8.4.2.Market size and forecast, by type

8.4.2.1.Asia-Pacific market size and forecast, by type

8.4.3.Market size and forecast, by technology

8.4.3.1.Asia-Pacific market size and forecast, by technology

8.4.4.Market size and forecast, by power consumption
8.4.5.Market size and forecast, by application
8.4.6.Market analysis, by country

8.4.6.1.China

8.4.6.1.1.Market size and forecast, by type
8.4.6.1.2.Market size and forecast, by technology
8.4.6.1.3.Market size and forecast, by power consumption
8.4.6.1.4.Market size and forecast, by application

8.4.6.2.Japan

8.4.6.2.1.Market size and forecast, by type
8.4.6.2.2.Market size and forecast, by technology
8.4.6.2.3.Market size and forecast, by power consumption
8.4.6.2.4.Market size and forecast, by application

8.4.6.3.India

8.4.6.3.1.Market size and forecast, by type
8.4.6.3.2.Market size and forecast, by technology
8.4.6.3.3.Market size and forecast, by power consumption
8.4.6.3.4.Market size and forecast, by application

8.4.6.4.Rest of Asia-Pacific

8.4.6.4.1.Market size and forecast, by type
8.4.6.4.2.Market size and forecast, by technology
8.4.6.4.3.Market size and forecast, by power consumption
8.4.6.4.4.Market size and forecast, by application

8.5.LAMEA

8.5.1.Key market trends, growth factors, and opportunities
8.5.2.Market size and forecast, by type

8.5.2.1.LAMEA market size and forecast, by type

8.5.3.Market size and forecast, by technology

8.5.3.1.LAMEA market size and forecast, by technology

8.5.4.Market size and forecast, by power consumption
8.5.5.Market size and forecast, by application
8.5.6.Market analysis, by country
8.5.7.Latin America

8.5.7.1.1.Market size and forecast, by type
8.5.7.1.2.Market size and forecast, by technology
8.5.7.1.3.Market size and forecast, by power consumption
8.5.7.1.4.Market size and forecast, by application

8.5.7.2.Middle East

8.5.7.2.1.Market size and forecast, by type
8.5.7.2.2.Market size and forecast, by technology
8.5.7.2.3.Market size and forecast, by power consumption
8.5.7.2.4.Market size and forecast, by application

8.5.7.3.Africa

8.5.7.3.1.Market size and forecast, by type
8.5.7.3.2.Market size and forecast, by technology
8.5.7.3.3.Market size and forecast, by power consumption
8.5.7.3.4.Market size and forecast, by application

CHAPTER 9:COMPANY PROFILES

9.1.Mabuchi Motor Co Ltd

9.1.1.Company overview
9.1.2.Key Executives
9.1.3.Company snapshot
9.1.4.Product portfolio
9.1.5.Business performance
9.1.6.Key strategic moves and developments

9.2.NIDEC CORPORATION

9.2.1.Company overview
9.2.2.Key Executives
9.2.3.Company snapshot
9.2.4.Operating business segments
9.2.5.Product portfolio
9.2.6.R&D Expenditure
9.2.7.Business performance
9.2.8.Key strategic moves and developments

9.3.BÜHLER MOTOR GmbH

9.3.1.Company overview
9.3.2.Key Executives
9.3.3.Company snapshot
9.3.4.Operating business segments
9.3.5.Product portfolio

9.4.JOHNSON ELECTRIC HOLDINGS LIMITED

9.4.1.Company overview
9.4.2.Key Executives
9.4.3.Company snapshot
9.4.4.Operating business segments
9.4.5.Product portfolio
9.4.6.R&D Expenditure
9.4.7.Business performance
9.4.8.Key strategic moves and developments

9.5.MAXON MOTORS AG

9.5.1.Company overview
9.5.2.Key Executives
9.5.3.Company snapshot
9.5.4.Operating business segments
9.5.5.Product portfolio
9.5.6.Key strategic moves and developments

9.6.ARC SYSTEMS INC.

9.6.1.Company overview
9.6.2.Key Executives
9.6.3.Company snapshot
9.6.4.Operating business segments
9.6.5.Product portfolio

9.7.ABB GROUP

9.7.1.Company overview
9.7.2.Key Executives
9.7.3.Company snapshot
9.7.4.Operating business segments
9.7.5.Product portfolio
9.7.6.R&D Expenditure
9.7.7.Business performance

9.8.Mitsuba Corporation

9.8.1.Company overview
9.8.2.Key Executives
9.8.3.Company snapshot
9.8.4.Operating business segments
9.8.5.Product portfolio
9.8.6.R&D Expenditure
9.8.7.Business performance

9.9.Constar Micromotor Co Ltd

9.9.1.Company overview
9.9.2.Key Executives
9.9.3.Company snapshot
9.9.4.Product portfolio

9.10.SIEMENS AG

9.10.1.Company overview
9.10.2.Key Executives
9.10.3.Company snapshot
9.10.4.Operating business segments
9.10.5.Product portfolio
9.10.6.R&D Expenditure
9.10.7.Business performance

LIST OF TABLES

TABLE 01.GLOBAL MICRO MOTOR MARKET REVENUE, BY TYPE, 2020-2030 ($MILLION)
TABLE 02.GLOBAL MICRO MOTOR MARKET REVENUE FOR AC, BY REGION 2020–2030 ($MILLION)
TABLE 03.MICRO MOTOR MARKET REVENUE FOR AC, BY TYPE, 2020–2030 ($MILLION)
TABLE 04.GLOBAL MICRO MOTOR MARKET REVENUE FOR DC, BY REGION 2020–2030 ($MILLION)
TABLE 05.MICRO MOTOR MARKET REVENUE FOR DC, BY TYPE, 2020–2030 ($MILLION)
TABLE 06.GLOBAL MICRO MOTOR MARKET REVENUE, BY TECHNOLOGY, 2020-2030 ($MILLION)
TABLE 07.MICRO MOTOR MARKET REVENUE FOR BRUSHED MOTOR, BY REGION 2020–2030 ($MILLION)
TABLE 08.MICRO MOTOR MARKET REVENUE FOR BRUSHED, BY TECHNOLOGY, 2020–2030 ($MILLION)
TABLE 09.MICRO MOTOR MARKET REVENUE FOR BRUSHLESS MOTOR, BY REGION 2020–2030 ($MILLION)
TABLE 10.MICRO MOTOR MARKET REVENUE FOR BRUSHLESS, BY TECHNOLOGY, 2020–2030 ($MILLION)
TABLE 11.GLOBAL MICRO MOTOR MARKET REVENUE, BY POWER CONSUMPTION, 2020-2030 ($MILLION)
TABLE 12.MICRO MOTOR MARKET REVENUE FOR LESS THAN 10V, BY REGION, 2020–2030 ($MILLION)
TABLE 13.MICRO MOTOR MARKET REVENUE FOR 10V-20V, BY REGION 2020–2030 ($MILLION)
TABLE 14.MICRO MOTOR MARKET REVENUE FOR MORE THAN 20V, BY REGION, 2020–2030 ($MILLION)
TABLE 15.GLOBAL MICRO MOTOR MARKET REVENUE, BY APPLICATION, 2020-2030 ($MILLION)
TABLE 16.MICRO MOTOR MARKET REVENUE FOR INDUSTRIAL, BY REGION, 2020–2030 ($MILLION)
TABLE 17.MICRO MOTOR MARKET REVENUE FOR AUTOMOTIVE & AEROSPACE, BY REGION, 2020–2030 ($MILLION)
TABLE 18.MICRO MOTOR MARKET REVENUE FOR HEALTHCARE, BY REGION, 2020–2030 ($MILLION)
TABLE 19.MICRO MOTOR MARKET REVENUE FOR OTHERS, BY REGION, 2020–2030 ($MILLION)
TABLE 20.MICROR MOTOR MARKET REVENUE, BY REGION 2020–2030 ($MILLION)
TABLE 21.NORTH AMERICA MICRO MOTOR MARKET REVENUE, BY TYPE, 2020–2030 ($MILLION)
TABLE 22.NORTH AMERICA MICRO MOTOR MARKET REVENUE FOR AC, BY TYPE, 2020–2030 ($MILLION)
TABLE 23.NORTH AMERICA MICRO MOTOR MARKET REVENUE FOR DC, BY TYPE, 2020–2030 ($MILLION)
TABLE 24.NORTH AMERICA MICRO MOTOR MARKET REVENUE, BY TECHNOLOGY, 2020–2030 ($MILLION)
TABLE 25.NORTH AMERICA MICRO MOTOR MARKET REVENUE FOR BRUSHED, BY TYPE, 2020–2030 ($MILLION)
TABLE 26.NORTH AMERICA MICRO MOTOR MARKET REVENUE FOR BRUSHLESS, BY TYPE, 2020–2030 ($MILLION)
TABLE 01.NORTH AMERICA MICRO MOTOR MARKET REVENUE, BY POWER CONSUMPTION, 2020-2030 ($MILLION)
TABLE 02.NORTH AMERICA MICRO MOTOR MARKET REVENUE, BY APPLICATION, 2020-2030 ($MILLION)
TABLE 03.NORTH AMERICA MICRO MOTOR MARKET REVENUE, BY COUNTRY, 2020–2030 ($MILLION)
TABLE 04.U.S. MICRO MOTOR MARKET REVENUE, BY TYPE, 2020–2030 ($MILLION)
TABLE 05.U.S. MICRO MOTOR MARKET REVENUE, BY TECHNOLOGY, 2020–2030 ($MILLION)
TABLE 06.U.S. MICRO MOTOR MARKET REVENUE, BY POWER CONSUMPTION, 2020–2030 ($MILLION)
TABLE 07.U.S. MICRO MOTOR MARKET REVENUE, BY APPLICATION, 2020–2030 ($MILLION)
TABLE 08.CANADA MICRO MOTOR MARKET REVENUE, BY TYPE, 2020–2030 ($MILLION)
TABLE 09.CANADA MICRO MOTOR MARKET REVENUE, BY TECHNOLOGY, 2020–2030 ($MILLION)
TABLE 10.CANADA MICRO MOTOR MARKET REVENUE, BY POWER CONSUMPTION, 2020–2030 ($MILLION)
TABLE 11.CANADA MICRO MOTOR MARKET REVENUE, BY APPLICATION, 2020–2030 ($MILLION)
TABLE 12.MEXICO MICRO MOTOR MARKET REVENUE, BY TYPE, 2020–2030 ($MILLION)
TABLE 13.MEXICO MICRO MOTOR MARKET REVENUE, BY TECHNOLOGY, 2020–2030 ($MILLION)
TABLE 14.MEXICO MICRO MOTOR MARKET REVENUE, BY POWER CONSUMPTION, 2020–2030 ($MILLION)
TABLE 15.MEXICO MICRO MOTOR MARKET REVENUE, BY APPLICATION, 2020–2030 ($MILLION)
TABLE 16.EUROPE MICRO MOTOR MARKET REVENUE, BY TYPE, 2020–2030 ($MILLION)
TABLE 17.EUROPE MICRO MOTOR MARKET REVENUE FOR AC, BY TYPE, 2020–2030 ($MILLION)
TABLE 18.EUROPE MICRO MOTOR MARKET REVENUE FOR DC, BY TYPE, 2020–2030 ($MILLION)
TABLE 19.EUROPE MICRO MOTOR MARKET REVENUE, BY TECHNOLOGY, 2020–2030 ($MILLION)
TABLE 20.EUROPE MICRO MOTOR MARKET REVENUE FOR BRUSHED, BY TYPE, 2020–2030 ($MILLION)
TABLE 21.EUROPE MICRO MOTOR MARKET REVENUE FOR BRUSHLESS, BY TYPE, 2020–2030 ($MILLION)
TABLE 22.EUROPE MICRO MOTOR MARKET REVENUE, BY POWER CONSUMPTION, 2020-2030 ($MILLION)
TABLE 23.EUROPE MICRO MOTOR MARKET REVENUE, BY APPLICATION, 2020-2030 ($MILLION)
TABLE 24.EUROPE MICRO MOTOR MARKET REVENUE, BY COUNTRY, 2020–2030 ($MILLION)
TABLE 25.GERMANY MICRO MOTOR MARKET REVENUE, BY TYPE, 2020–2030 ($MILLION)
TABLE 26.GERMANY MICRO MOTOR MARKET REVENUE, BY TECHNOLOGY, 2020–2030 ($MILLION)
TABLE 27.GERMANY MICRO MOTOR MARKET REVENUE, BY POWER CONSUMPTION, 2020–2030 ($MILLION)
TABLE 28.GERMANY MICRO MOTOR MARKET REVENUE, BY APPLICATION, 2020–2030 ($MILLION)
TABLE 29.FRANCE MICRO MOTOR MARKET REVENUE, BY TYPE, 2020–2030 ($MILLION)
TABLE 30.FRANCE MICRO MOTOR MARKET REVENUE, BY TECHNOLOGY, 2020–2030 ($MILLION)
TABLE 31.FRANCE MICRO MOTOR MARKET REVENUE, BY POWER CONSUMPTION, 2020–2030 ($MILLION)
TABLE 32.FRANCE MICRO MOTOR MARKET REVENUE, BY APPLICATION, 2020–2030 ($MILLION)
TABLE 33.UK MICRO MOTOR MARKET REVENUE, BY TYPE, 2020–2030 ($MILLION)
TABLE 34.UK MICRO MOTOR MARKET REVENUE, BY TECHNOLOGY, 2020–2030 ($MILLION)
TABLE 35.UK MICRO MOTOR MARKET REVENUE, BY POWER CONSUMPTION, 2020–2030 ($MILLION)
TABLE 36.UK MICRO MOTOR MARKET REVENUE, BY APPLICATION, 2020–2030 ($MILLION)
TABLE 37.ITALY MICRO MOTOR MARKET REVENUE, BY TYPE, 2020–2030 ($MILLION)
TABLE 38.ITALY MICRO MOTOR MARKET REVENUE, BY TECHNOLOGY, 2020–2030 ($MILLION)
TABLE 39.ITALY MICRO MOTOR MARKET REVENUE, BY POWER CONSUMPTION, 2020–2030 ($MILLION)
TABLE 40.ITALY MICRO MOTOR MARKET REVENUE, BY APPLICATION, 2020–2030 ($MILLION)
TABLE 41.REST OF EUROPE MICRO MOTOR MARKET REVENUE, BY TYPE, 2020–2030 ($MILLION)
TABLE 42.REST OF EUROPE MICRO MOTOR MARKET REVENUE, BY TECHNOLOGY, 2020–2030 ($MILLION)
TABLE 43.REST OF EUROPE MICRO MOTOR MARKET REVENUE, BY POWER CONSUMPTION, 2020–2030 ($MILLION)
TABLE 44.REST OF EUROPE MICRO MOTOR MARKET REVENUE, BY APPLICATION, 2020–2030 ($MILLION)
TABLE 45.ASIA-PACIFIC MICRO MOTOR MARKET REVENUE, BY TYPE, 2020–2030 ($MILLION)
TABLE 46.ASIA-PACIFIC MICRO MOTOR MARKET REVENUE FOR AC, BY TYPE, 2020–2030 ($MILLION)
TABLE 47.ASIA-PACIFIC MICRO MOTOR MARKET REVENUE FOR DC, BY TYPE, 2020–2030 ($MILLION)
TABLE 48.ASIA-PACIFIC MICRO MOTOR MARKET REVENUE, BY TECHNOLOGY, 2020–2030 ($MILLION)
TABLE 49.ASIA-PACIFIC MICRO MOTOR MARKET REVENUE FOR BRUSHED, BY TYPE, 2020–2030 ($MILLION)
TABLE 50.ASIA-PACIFIC MICRO MOTOR MARKET REVENUE FOR BRUSHLESS, BY TECHNOLOGY, 2020–2030 ($MILLION)
TABLE 51.ASIA-PACIFIC MICRO MOTOR MARKET REVENUE, BY POWER CONSUMPTION, 2020-2030 ($MILLION)
TABLE 52.ASIA-PACIFIC MICRO MOTOR MARKET REVENUE, BY APPLICATION, 2020-2030 ($MILLION)
TABLE 53.ASIA-PACIFIC MICRO MOTOR MARKET REVENUE, BY COUNTRY, 2020–2030 ($MILLION)
TABLE 54.CHINA MICRO MOTOR MARKET REVENUE, BY TYPE, 2020–2030 ($MILLION)
TABLE 55.CHINA MICRO MOTOR MARKET REVENUE, BY TECHNOLOGY, 2020–2030 ($MILLION)
TABLE 56.CHINA MICRO MOTOR MARKET REVENUE, BY POWER CONSUMPTION, 2020–2030 ($MILLION)
TABLE 57.CHINA MICRO MOTOR MARKET REVENUE, BY APPLICATION, 2020–2030 ($MILLION)
TABLE 58.JAPAN MICRO MOTOR MARKET REVENUE, BY TYPE, 2020–2030 ($MILLION)
TABLE 59.JAPAN MICRO MOTOR MARKET REVENUE, BY TECHNOLOGY, 2020–2030 ($MILLION)
TABLE 60.JAPAN MICRO MOTOR MARKET REVENUE, BY POWER CONSUMPTION, 2020–2030 ($MILLION)
TABLE 61.JAPAN MICRO MOTOR MARKET REVENUE, BY APPLICATION, 2020–2030 ($MILLION)
TABLE 62.INDIA MICRO MOTOR MARKET REVENUE, BY TYPE, 2020–2030 ($MILLION)
TABLE 63.INDIA MICRO MOTOR MARKET REVENUE, BY TECHNOLOGY, 2020–2030 ($MILLION)
TABLE 64.INDIA MICRO MOTOR MARKET REVENUE, BY POWER CONSUMPTION, 2020–2030 ($MILLION)
TABLE 65.INDIA MICRO MOTOR MARKET REVENUE, BY APPLICATION, 2020–2030 ($MILLION)
TABLE 66.REST OF ASIA-PACIFIC MICRO MOTOR MARKET REVENUE, BY TYPE, 2020–2030 ($MILLION)
TABLE 67.REST OF ASIA-PACIFIC MICRO MOTOR MARKET REVENUE, BY TECHNOLOGY, 2020–2030 ($MILLION)
TABLE 68.REST OF ASIA-PACIFIC MICRO MOTOR MARKET REVENUE, BY POWER CONSUMPTION, 2020–2030 ($MILLION)
TABLE 69.REST OF ASIA-PACIFIC MICRO MOTOR MARKET REVENUE, BY APPLICATION, 2020–2030 ($MILLION)
TABLE 70.LAMEA MICRO MOTOR MARKET REVENUE, BY TYPE, 2020–2030 ($MILLION)
TABLE 71.LAMEA MICRO MOTOR MARKET REVENUE FOR AC, BY TYPE, 2020–2030 ($MILLION)
TABLE 72.LAMEA MICRO MOTOR MARKET REVENUE FOR DC, BY TYPE, 2020–2030 ($MILLION)
TABLE 73.LAMEA MICRO MOTOR MARKET REVENUE, BY TECHNOLOGY, 2020–2030 ($MILLION)
TABLE 74.LAMEA MICRO MOTOR MARKET REVENUE FOR BRUSHED, BY TECHNOLOGY, 2020–2030 ($MILLION)
TABLE 75.LAMEA MICRO MOTOR MARKET REVENUE FOR BRUSHLESS, BY TECHNOLOGY, 2020–2030 ($MILLION)
TABLE 76.LAMEA MICRO MOTOR MARKET REVENUE, BY POWER CONSUMPTION, 2020-2030 ($MILLION)
TABLE 77.LAMEA MICRO MOTOR MARKET REVENUE, BY APPLICATION, 2020-2030 ($MILLION)
TABLE 78.LAMEA MICRO MOTOR MARKET REVENUE, BY COUNTRY, 2020–2030 ($MILLION)
TABLE 79.LATIN AMERICA MICRO MOTOR MARKET REVENUE, BY TYPE, 2020–2030 ($MILLION)
TABLE 80.LATIN AMERICA MICRO MOTOR MARKET REVENUE, BY TECHNOLOGY, 2020–2030 ($MILLION)
TABLE 81.LATIN AMERICA MICRO MOTOR MARKET REVENUE, BY POWER CONSUMPTION, 2020–2030 ($MILLION)
TABLE 82.LATIN AMERICA MICRO MOTOR MARKET REVENUE, BY APPLICATION, 2020–2030 ($MILLION)
TABLE 83.MIDDLE EAST MICRO MOTOR MARKET REVENUE, BY TYPE, 2020–2030 ($MILLION)
TABLE 84.MIDDLE EAST MICRO MOTOR MARKET REVENUE, BY TECHNOLOGY, 2020–2030 ($MILLION)
TABLE 85.MIDDLE EAST MICRO MOTOR MARKET REVENUE, BY POWER CONSUMPTION, 2020–2030 ($MILLION)
TABLE 86.MIDDLE EAST MICRO MOTOR MARKET REVENUE, BY APPLICATION, 2020–2030 ($MILLION)
TABLE 87.AFRICA MICRO MOTOR MARKET REVENUE, BY TYPE, 2020–2030 ($MILLION)
TABLE 88.AFRICA MICRO MOTOR MARKET REVENUE, BY TECHNOLOGY, 2020–2030 ($MILLION)
TABLE 89.AFRICA MICRO MOTOR MARKET REVENUE, BY POWER CONSUMPTION, 2020–2030 ($MILLION)
TABLE 90.AFRICA MICRO MOTOR MARKET REVENUE, BY APPLICATION, 2020–2030 ($MILLION)
TABLE 91.MABUCHI MOTOR CO LTD: KEY EXECUTIVES
TABLE 92.MABUCHI MOTOR CO LTD: COMPANY SNAPSHOT
TABLE 93.MABUCHI MOTOR CO LTD: PRODUCT PORTFOLIO
TABLE 94.NIDEC CORPORATION: KEY EXECUTIVES
TABLE 95.NIDEC CORPORATION: COMPANY SNAPSHOT
TABLE 96.NIDEC CORPORATION: OPERATING SEGMENTS
TABLE 97.NIDEC CORPORATION: PRODUCT PORTFOLIO
TABLE 98.BUHLER MOTOR GMBH: KEY EXECUTIVES
TABLE 99.BÜHLER MOTOR GMBH: COMPANY SNAPSHOT
TABLE 100.BÜHLER MOTOR GMBH: OPERATING SEGMENTS
TABLE 101.BÜHLER MOTOR GMBH: PRODUCT PORTFOLIO
TABLE 102.JOHNSON ELECTRIC HOLDINGS LIMITED: KEY EXECUTIVES
TABLE 103.JOHNSON ELECTRIC HOLDINGS LIMITED: COMPANY SNAPSHOT
TABLE 104.JOHNSON ELECTRIC HOLDINGS LIMITED: OPERATING SEGMENTS
TABLE 105.JOHNSON ELECTRIC HOLDINGS LIMITED: PRODUCT PORTFOLIO
TABLE 106.MAXON MOTORS AG: KEY EXECUTIVES
TABLE 107.MAXON MOTORS AG: COMPANY SNAPSHOT
TABLE 108.MAXON MOTORS AG: OPERATING SEGMENTS
TABLE 109.MAXON MOTORS AG: PRODUCT PORTFOLIO
TABLE 110.ARC SYSTEMS INC: KEY EXECUTIVES
TABLE 111.ARC SYSTEMS INC: COMPANY SNAPSHOT
TABLE 112.ARC SYSTEMS INC: OPERATING SEGMENTS
TABLE 113.ARC SYSTEMS INC: PRODUCT PORTFOLIO
TABLE 114.ABB GROUP: KEY EXECUTIVES
TABLE 115.ABB GROUP: COMPANY SNAPSHOT
TABLE 116.ABB GROUP: OPERATING SEGMENTS
TABLE 117.ABB GROUP: PRODUCT PORTFOLIO
TABLE 118.MITSUBA CORPORATION: KEY EXECUTIVES
TABLE 119.MITSUBA CORPORATION: COMPANY SNAPSHOT
TABLE 120.MITSUBA CORPORATION: OPERATING SEGMENTS
TABLE 121.MITSUBA CORPORATION: PRODUCT PORTFOLIO
TABLE 122.CONSTAR MICROMOTOR CO LTD: KEY EXECUTIVES
TABLE 123.CONSTAR MICROMOTOR CO LTD: COMPANY SNAPSHOT
TABLE 124.CONSTAR MICRORMOTOR CO LTD: PRODUCT PORTFOLIO
TABLE 125.KEY EXECUTIVES
TABLE 126.SIEMENS AG: COMPANY SNAPSHOT
TABLE 127.SIEMENS AG: OPERATING SEGMENTS
TABLE 128.SIEMENS AG: PRODUCT PORTFOLIO

LIST OF FIGURES

FIGURE 01.KEY MARKET SEGMENTS
FIGURE 02.EXECUTIVE SUMMARY
FIGURE 03.TOP INVESTMENT POCKETS
FIGURE 04.TOP WINNING STRATEGIES, BY YEAR, 2017–2021
FIGURE 05.TOP WINNING STRATEGIES, BY DEVELOPMENT, 2017–2021 (%)
FIGURE 06.TOP WINNING STRATEGIES, BY COMPANY, 2017–2021 (%)
FIGURE 07.LOW-TO-HIGH BARGAINING POWER OF SUPPLIERS
FIGURE 08.MODERATE-TO-LOW BARGAINING POWER OF BUYERS
FIGURE 09.MODERATE TO HIGH THREAT OF SUBSTITUTES
FIGURE 10.HIGH THREAT OF NEW ENTRANTS
FIGURE 11.MODERATE TO HIGH INTENSITY OF RIVALRY
FIGURE 12.MARKET PLAYER POSITIONING, 2020
FIGURE 13.GLOBAL MICRO MOTOR MARKET, BY TYPE, 2020-2030 (%)
FIGURE 14.GLOBAL MICRO MARKET FOR AC, BY COUNTRY, 2020 & 2030 (%)
FIGURE 15.GLOBAL MICRO MOTOR MARKET FOR DC, BY COUNTRY, 2020 & 2030 (%)
FIGURE 16.GLOBAL MICRO MOTOR MARKET, BY TECHNOLOGY, 2020-2030 (%)
FIGURE 17.MICRO MOTOR MARKET FOR BRUSHED MOTOR, BY COUNTRY, 2020 & 2030 (%)
FIGURE 18.MICRO MOTOR MARKET FOR BRUSHLESS MOTOR, BY COUNTRY, 2020 & 2030 (%)
FIGURE 19.GLOBAL MICRO MOTOR MARKET, BY POWER CONSUMPTION, 2020-2030 (%)
FIGURE 20.MICRO MOTOR MARKET FOR LESS THAN 10V, BY COUNTRY, 2020 & 2030 (%)
FIGURE 21.MICRO MOTOR MARKET FOR 10V-20V, BY COUNTRY, 2020 & 2030 (%)
FIGURE 22.MICRO MOTOR MARKET FOR MORE THAN 20V, BY COUNTRY, 2020 & 2030 (%)
FIGURE 23.GLOBAL MICRO MOTOR MARKET, BY APPLICATION, 2020-2030 (%)
FIGURE 24.MICRO MOTOR MARKET FOR INDUSTRIAL, BY COUNTRY, 2020 & 2030 (%)
FIGURE 25.MICRO MOTOR MARKET FOR AUTOMOTIVE & AEROSPACE, BY COUNTRY, 2020 & 2030 (%)
FIGURE 26.MICRO MOTOR MARKET FOR HEALTHCARE, BY COUNTRY, 2020 & 2030 (%)
FIGURE 27.MICRO MOTOR MARKET FOR OTHERS, BY COUNTRY, 2020 & 2030 (%)
FIGURE 28.GLOBAL MICRO MOTOR MARKET, BY REGION, 2020-2030
FIGURE 29.U.S. MICRO MOTOR MARKET REVENUE, 2020-2030 ($MILLION)
FIGURE 30.CANADA MICRO MOTOR MARKET REVENUE, 2020-2030 ($MILLION)
FIGURE 31.MEXICO MICRO MOTOR MARKET REVENUE, 2020-2030 ($MILLION)
FIGURE 32.GERMANY MICRO MOTOR MARKET REVENUE, 2020-2030 ($MILLION)
FIGURE 33.FRANCE MICRO MOTOR MARKET REVENUE, 2020-2030 ($MILLION)
FIGURE 34.UK MICRO MOTOR MARKET REVENUE, 2020-2030 ($MILLION)
FIGURE 35.ITALY MICRO MOTOR MARKET REVENUE, 2020-2030 ($MILLION)
FIGURE 36.REST OF EUROPE MICRO MOTOR MARKET REVENUE, 2020-2030 ($MILLION)
FIGURE 37.CHINA MICRO MOTOR MARKET REVENUE, 2020-2030 ($MILLION)
FIGURE 38.JAPAN MICRO MOTOR MARKET REVENUE, 2020-2030 ($MILLION)
FIGURE 39.INDIA MICRO MOTOR MARKET REVENUE, 2020-2030 ($MILLION)
FIGURE 40.REST OF ASIA-PACIFIC MICRO MOTOR MARKET REVENUE, 2020-2030 ($MILLION)
FIGURE 41.LATIN AMERICA MICRO MOTOR MARKET REVENUE, 2020-2030 ($MILLION)
FIGURE 42.MIDDLE EAST MICRO MOTOR MARKET REVENUE, 2020-2030 ($MILLION)
FIGURE 43.AFRICA MICRO MOTOR MARKET REVENUE, 2020-2030 ($MILLION)
FIGURE 44.MABUCHI MOTOR CO LTD: REVENUE, 2018–2020 ($MILLION)
FIGURE 45.MABUCHI MOTOR CO LTD: REVENUE SHARE BY REGION, 2020 (%)
FIGURE 46.NIDEC CORPORATION: R&D EXPENSES, 2019–2021 ($MILLION)
FIGURE 47.NIDEC CORPORATION: REVENUE, 2019–2021 ($MILLION)
FIGURE 48.NIDEC CORPORATION: REVENUE SHARE BY SEGMENT, 2021 (%)
FIGURE 49.NIDEC CORPORATION: REVENUE SHARE BY REGION, 2021 (%)
FIGURE 50.JOHNSON ELECTRIC HOLDINGS LIMITED: R&D EXPENSES, 2019–2021 ($MILLION)
FIGURE 51.JOHNSON ELECTRIC HOLDINGS LIMITED: REVENUE, 2019–2021 ($MILLION)
FIGURE 52.JOHNSON ELECTRIC HOLDINGS LIMITED: REVENUE SHARE BY SEGMENT, 2021 (%)
FIGURE 53.JOHNSON ELECTRIC HOLDINGS LIMITED: REVENUE SHARE BY REGION, 2021 (%)
FIGURE 54.ABB GROUP: R&D EXPENDITURE, 2018–2020 ($MILLION)
FIGURE 55.ABB GROUP: REVENUE, 2018–2020 ($MILLION)
FIGURE 56.ABB GROUP: REVENUE SHARE BY SEGMENT, 2020 (%)
FIGURE 57.ABB GROUP: REVENUE SHARE BY REGION, 2020 (%)
FIGURE 58.MITSUBA CORPORATION: R&D EXPENDITURE, 2018–2020 ($MILLION)
FIGURE 59.MITSUBA CORPORATION: REVENUE, 2018–2020 ($MILLION)
FIGURE 60.MITSUBA CORPORATION: REVENUE SHARE BY SEGMENT, 2020 (%)
FIGURE 61.MITSUBA CORPORATION: REVENUE SHARE BY REGION, 2020 (%)
FIGURE 62.R&D EXPENDITURE, 2018–2020 ($MILLION)
FIGURE 63.SIEMENS AG: REVENUE, 2018–2020 ($MILLION)
FIGURE 64.SIEMENS AG: REVENUE SHARE BY SEGMENT, 2020 (%)
FIGURE 65.SIEMENS AG: REVENUE SHARE BY REGION, 2020 (%)


The global micro motor has witnessed huge demand in Asia-Pacific followed by Europe & North America. The highest share of the Asia-Pacific market is attributed to increase in demand in micro motors in automotive and pharmaceutical sectors.

Micro motor is compact in sizes; hence, it is widely adopted in hand held devices, electric shavers, electric toothbrushes, vehicle cleaner accessories, and other equipment. The benefits associated with micro motors include high efficiency, high torque speed, small in size, and available in brushed as well as brushless technology. A rise in demand for micro motor in industrial and manufacturing sector globally fuels the growth of the micro motor market. In addition, huge demand for HVAC (heating, ventilation, and air conditioning) and automotive industries is expected to provide lucrative opportunities for the growth of the micro motors market.

Moreover, major players such as Mabuchi Motor Co Ltd, Simens AG, and others are adopting acquisition as a key developmental strategy to improve the product portfolio of micro motor product. For instance, in June 2021, Mabuchi Motor Co Ltd acquired Electromag SA that deals in providing motors for medical equipment. The acquisition aimed to improve the product portfolio of micro motors. All such instances drive the growth of the micro motor market.

PURCHASE OPTIONS

Call or Email us

U.S.-Canada Toll-free: +1-800-792-5285
Int'l : +1-503-894-6022
Europe : +44-845-528-1300
Email : help@alliedmarketresearch.com
 
FREQUENTLY ASKED QUESTIONS?

A. The Global micro motor market size was $36,477.9 million in 2020 and is projected to reach $56,066.2 million in 2030, growing at a CAGR of 4.1% from 2021 to 2030.

A. The forecast period considered for the Global micro motor market is 2021 to 2030, wherein, 2020 is the base year, 2021 is the estimated year, and 2030 is the forecast year.

A. The base year considered in the Global micro motor market is 2020.

A. The report for Global micro motor market doesn’t provides Value Chain Analysis, but if there is a requirement for the same, it could be added as an additional customization.

A. On the basis of rotor type, the Inner rotor brushless DC motors segment is expected to be the most influencing segment growing in the Global micro motor market report.

A. Based on type, AC segment generated the highest revenue, accounting for 77.51% of the market share, and is projected to grow at a CAGR of 4.3% from 2021 to 2030.

A. The report contains an exclusive company profile section, where the leading 10 companies in the market are profiled. These profiles typically cover company overview, geographical presence, and market dominance (in terms of revenue and volume sales).

A. Asia-Pacific is expected to provide more business opportunities for micro motor market in the future.

Looking for Customization?

 Customization Request

Have a Question?

 Speak with Analyst

Any Confusion?

 Inquire Before Buying

Have a glance of the Report

  Request Sample
RELATED TAGS

Purchase Full Report of
Micro Motor Market

Start reading instantly.
This Report and over 67,404+ more Reports, Available with Avenue Library. T&C*.

  • Online Only
  • $3,456
  • Online cloud access only
  • Restricted print, copy, paste & download
  • Read only
  • Free industry update
    (Within 180 days)
  • Free report update in next update cycle
    (Jul 2022 - Jul 2023)
  • Data Pack
  • $3,840
  • Restricted to one authorized user
  • One print only
  • Available in
    Excel
  • Free industry update
    (Within 180 days)
  •   Free report update in next update cycle
    (Jul 2022 - Jul 2023)
  • Single User
  • $5,769
  • Restricted to one authorized user
  • One print only
  • Available in
    PDF
  • Free industry update
    (Within 180 days)
  •   Free report update in next update cycle
    (Jul 2022 - Jul 2023)
  • Five Users
  • $6,450
  • Limited to five authorized users
  • Print upto five copies
  • Available in
    PDF
  • Free industry update
    (Within 180 days)
  •   Free report update in next update cycle
    (Jul 2022 - Jul 2023)
  • Enterprise
    License/PDF

  • $10,995
  • Unlimited
    within
    company/enterprise
  • Available in Excel & PDF
  • Free industry update
    (Within 180 days)
  •   Free report update in next update cycle
    (Jul 2022 - Jul 2023)
  • Library
    Membership

  • $999 $ 1,175
    Per User/ Per month/ Billed annually
  • Published Content
    E-access
  • Company Profiles
    E-access
  • Newly Added Content Access
  • 10 PDF
    Downloads
  • 5 Excel Data
    Pack Downloads
  • 250 Company Profiles PDF Downloads
  • Buy Now

*Taxes/Fees, if applicable will be added during checkout. All prices in USD

RELATED REPORTS
 

Why Allied Market Research?


Infallible Methodology

To ensure high-level data integrity, accurate analysis, and impeccable forecasts

Analyst Support

For complete satisfaction

Customization

On-demand customization of scope of the report to exactly meet your needs

TARGETED MARKET VIEW

Targeted market view to provide pertinent information and save time of readers

Get fresh content delivered

Get insights on topics that are crucial for your business. Stay abreast of your interest areas.

Get Industry Data Alerts

Why Allied Market Research?

Infallible Methodology

To ensure high-level data integrity, accurate analysis, and impeccable forecasts

Analyst Support

For complete satisfaction

Customization

On-demand customization of scope of the report to exactly meet your needs

TARGETED MARKET VIEW

Targeted market view to provide pertinent information and save time of readers