
Microgrid Market Research, 2030
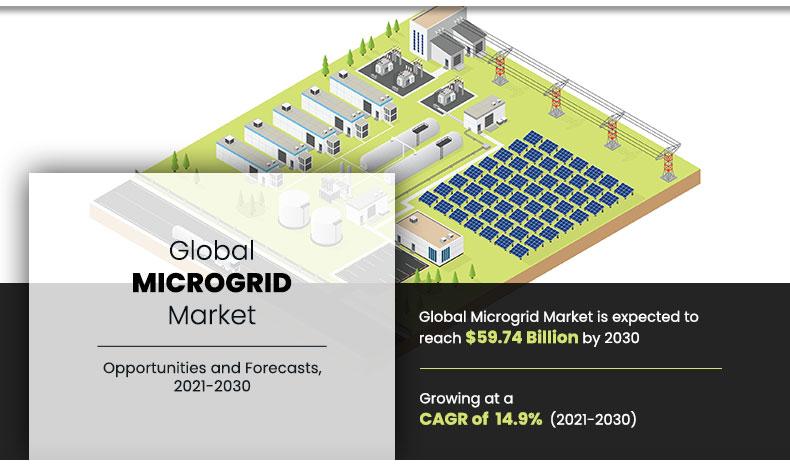
The Global Microgrid Market size was valued at $15.88 billion in 2020 and is projected to reach $59.74 billion by 2030, registering a CAGR of 14.9% from 2021 to 2030. A microgrid is a self-reliant, localized energy system that serves a specific area, including a hospital complex, college campus, and business centers. It can operate autonomously without any support from a centralized grid. A smart microgrid can also function when connected to the main grid, and even when it is not connected to the main grid, it acts as an electrical island. It helps in the reduction of harmful emissions, resulting in optimal use of renewable resources, improved efficiency, and long-term, predictable energy costs.
Growth in demand for reliable and secure power supply in commercial and industrial sectors across the globe, coupled with government initiatives taken to reduce carbon footprint, is expected to fuel the microgrid market growth. Moreover, the rapid adoption of software across various end-user segments, including commercial, industrial, government, and healthcare, to manage and control distributed energy resources with integrated weather and load forecasting is also expected to boost the market during the forecast period.
Factors such as growth in the development of smart cities, an increase in demand, growth of rugged lot, and rise in adoption of ruggedized computers are expected to drive the growth of the market in the future. However, the high production cost of rugged devices acts as a major barrier and hampers market growth. Furthermore, the rise in the need for hard and reliable electrical equipment for the military and aerospace industries is expected to offer lucrative opportunities for the microgrid market growth.
Key Takeaways
- The global microgrid market study covers 20 countries. The research includes a segment analysis of each country in terms of value for the projected period.
- More than 1,500 product literature, industry releases, annual reports, and other such documents of major microgrid market industry participants, along with authentic industry journals, trade associations' releases, and government websites, have been reviewed to generate high-value industry insights.
- The study integrated high-quality data, professional opinions, analysis, and critical independent perspectives. The research approach is intended to provide a balanced view of global microgrid markets and to assist stakeholders in making educated decisions to achieve their most ambitious growth objectives.
Segmentation Overview
The microgrid market share is analyzed on the basis of connectivity, type, end user, and region. By connectivity, the market is divided into grid-connected and off-grid-connected. By type, it is classified into AC microgrids, DC microgrids, and hybrid microgrids. By end user, it is categorized into commercial & industrial, government, healthcare, remote, utility, and others. By region, the microgrid market is analyzed across North America, Europe, Asia-Pacific, and LAMEA, along with their prominent countries.
By Connectivity
Grid Connected segment generated the highest revenue in 2020.
In the coming years, the microgrid industry is expected to generate moderate cash output with modest investments in development, research, and tests. However, the microgrid market is nearing the maturing stage, and is expected to generate modest revenue for key players in the coming years.
By Type
AC microgrids segment generated the highest revenue in 2020.
Key Market Dynamics
The microgrid market is driven by increasing demand for reliable, resilient energy systems, particularly in areas prone to grid instability and outages. Rising integration of renewable energy sources, such as solar and wind, also propels growth as microgrids offer localized power generation. Government policies and incentives promoting clean energy further boost adoption.
However, the market faces restraints such as high initial capital costs and complexity in system integration, especially for smaller, remote applications. Regulatory challenges related to grid interconnection and energy management may also hinder progress.
There are opportunities in developing regions with unreliable power infrastructure and urban centers seeking energy independence. Additionally, advancements in energy storage technologies and digitalization, such as IoT-based energy management, open doors for more efficient and scalable microgrid solutions.
Regional/Country Market Outlook
The global microgrid market share is experiencing substantial growth, with Asia-Pacific playing a pivotal role in this expansion. Asia-Pacific leads the market, propelled by rapid urbanization, rising energy demand, and government initiatives supporting renewable energy integration. Countries like China, India, and Japan invest heavily in microgrids to enhance grid reliability and energy access, driving regional growth. Then, North America follows its advanced energy infrastructure, growing adoption of renewable energy, and strong government support. The U.S. leads with military, industrial, and community microgrids, while investments in grid resilience and clean energy targets further drive microgrid deployment across the region.
- In September 2024, JFK International Airport in New York started constructing the largest airport solar array in the U.S., featuring 13,000 solar panels on the roof of its new Terminal One building. This project includes a novel microgrid that will use fuel cells, a battery energy storage system, and the largest solar array in New York City to power daily operations.
- In January 2024, Tencent launched a solar-powered microgrid at its Tianjin High-Tech Cloud Data Center. This microgrid, equipped with 10.54 MW of solar panels, generates enough electricity to power 6,000 households annually
- In July 2023, the U.S. Department of Energy announced a $14.7 million funding opportunity for microgrid technologies aimed at underserved and Indigenous communities. This initiative focuses on bringing reliable, resilient, and clean energy to remote, rural, and islanded regions.
By End User
Remote segment generated the highest revenue in 2020.
Top Impacting Factors
The significant factors that impact the global microgrid market growth include increasing demand in remote areas and backup for Military bases, and stringent government initiatives to reduce carbon footprints. In addition, High installation and maintenance costs for microgrids. Moreover, the growing demand for microgrids in Commercial and industrial sectors for reliable and uninterrupted power and electricity supply, rapid industrialization, and increasing demand for power have affected the market growth to a certain extent. Each of these factors is anticipated to have a definite impact on the global microgrid market during the forecast period. These factors are expected to offer lucrative opportunities for market growth in the coming years.
By Region
Asia-Pacific would exhibit the highest CAGR of 16.4% during 2020-2030
Report Coverage & Deliverables
This report delivers in-depth insights into the microgrid market, covering connectivity, types, end users, and key strategies employed by major players. It offers detailed market forecasts and emerging trends.
Connectivity Type Insights
Grid-connected microgrids operate in a branch with the main utility grid, enhancing stability and enabling energy sharing. They are preferred in urban and industrial areas. Off-grid microgrids function independently, providing power to remote locations with limited grid access, such as islands and rural communities. Off-grid systems are gaining traction due to their potential for renewable energy integration.
Type Insights
AC microgrids utilize alternating current for efficient integration with existing grid systems, making them ideal for urban areas. DC microgrids cater to renewable sources and electronic loads, enhancing energy efficiency. Hybrid microgrids combine AC and DC systems, offering flexibility and resilience, accommodating diverse energy sources, and optimizing overall performance.
End User Insights
Commercial and industrial sectors seek reliable energy solutions for efficiency, while government entities prioritize sustainability and resilience. Healthcare facilities require uninterrupted power for critical services. Remote areas benefit from enhanced energy access, and utilities focus on grid stability, with other users including educational and military applications, emphasizing energy independence.
Regional Insights
Asia-Pacific dominates the microgrid market due to rapid urbanization and renewable energy investments, especially in China and India. North America follows, driven by advancements in grid infrastructure and resilience initiatives.
Key Strategies and Developments
- In March 2022, Honeywell partnered with Duke Energy Sustainable Solutions to develop and deploy microgrid solutions across U.S. communities. This strategic alliance aims to improve energy resiliency by integrating distributed energy resources, such as solar photovoltaic (PV) systems and battery energy storage, with Honeywell’s Smart Cities Software.
Key Benefits for Stakeholders
- This study comprises an analytical depiction of the microgrid market size and opportunity, along with current trends and future estimations to depict imminent investment pockets.
- The overall market analysis is determined to understand profitable trends to gain a stronger foothold.
- The report presents information related to key drivers, restraints, size, and microgrid market opportunities with a detailed impact analysis.
- The microgrid market outlook forecast is quantitatively analyzed from 2020 to 2030 to benchmark the financial competency.
- Porter’s five forces analysis illustrates the potency of buyers and the microgrid market forecast of key vendors.
- The report includes the industry trends and the microgrid market share of key vendors.
Microgrid Market Report Highlights
| Aspects | Details |
| By Connectivity |
|
| By Type |
|
| By end user |
|
| By Region |
|
| Key Market Players | S&C ELECTRIC, HONEYWELL, Schneider Electric, EATON CORPORATION, EXELON CORPORATION, ABB Group, PARETO ENERGY, SIEMENS, GENERAL ELECTRIC, SPIRAE INC. |
Analyst Review
The microgrid market is highly competitive, owing to strong presence of existing vendors. Microgrid technology vendors, who have access to extensive technical and financial resources, are anticipated to gain a competitive edge over their rivals as they have the capacity to cater to the global market requirements. The competitive environment in this market is expected to further intensify with increase in technological innovations, product extensions, and different strategies adopted by key vendors.
The microgrid market exhibits high growth potential in commercial and industrial sectors. The current business scenario is witnessing an increase in demand for energy, particularly in developing regions such as China and India, owing to surge in population and rise in demand for energy. Companies in this industry are adopting various innovative techniques, such as mergers and acquisitions to strengthen their business position in the competitive matrix.
The market growth is supplemented by proactive industrialization efforts and surge in manufacturing output, owing to technological advancements. These factors have allowed emerging markets to evolve as largest markets during the forecast period, both from the demand as well as the supply side. Public & private organizations have substantially invested in R&D activities and fabrication techniques to develop cost-effective microgrids. Asia-Pacific is the major revenue contributor to the global market, followed by Europe. The market growth in Asia-Pacific and Europe is expected to significantly increase during the forecast period. The microgrid market provides numerous growth opportunities to market players such as ABB, General Electric, Siemens, Eaton Corporation, and Honeywell. These companies are engaged in the process of product innovation, collaboration, and acquisition to expand their services across various regions.
The key players profiled in the report include ABB, General Electric, Siemens, Eaton Corporation, Honeywell, Schneider Electric, S&C Electric, Spirae Inc., Exelon Corporation, and Pareto Energy .
The global microgrid market was valued at $15.88 billion in 2020 and is projected to reach $59.74 billion by 2030, growing at a CAGR of 14.9% from 2021 to 2030.
The microgrid market encompasses self-reliant, localized energy systems that serve specific areas such as hospital complexes, college campuses, and business centers. These systems can operate autonomously or in conjunction with the main power grid.
Prominent companies in the microgrid market include ABB, General Electric, Siemens, Eaton Corporation, Honeywell, Schneider Electric, S&C Electric, Spirae Inc., Exelon Corporation, and Pareto Energy.
In 2020, North America held the largest share of the microgrid market, driven by significant investments and developments in microgrid projects across the region.
The microgrid market is primarily driven by the increasing demand for reliable and secure power supply in commercial and industrial sectors, along with government initiatives aimed at reducing carbon footprints.
Challenges in the microgrid market include high production costs and complexities associated with integrating microgrids into existing power systems.
Loading Table Of Content...

