0
2018
Migraine Drugs Market

Migraine Drugs Market

by Type (Abortive Medicine and Preventive Medicine), Route of Administration (Oral, Injection, and Others), and Distribution Channel (Hospital-based Pharmacies, Retail Pharmacies and Online Pharmacies) - Global Opportunity Analysis and Industry Forecast, 2018-2025

Report Code: A02476
Jul 2018 | Pages: 225
Tables: 119
Charts: 46
  • Formats*:

  • pdf

    Single User License, Five User
    License & Enterprise User License

  • xls

    Data Pack Excel License

  • ppt

    It comes with the additional cost
    of $2500.00 contact sales.


COVID-19

Pandemic disrupted the entire world and affected many industries.

Get detailed COVID-19 impact analysis on the Migraine Drugs Market

Request Now !

Migraine Drugs Market Overview:

The global migraine drugs market was valued at $1,713 million in 2017, and is expected to reach $2,190 million by 2025, growing at a CAGR of 3.1% from 2018 to 2025. Migraine is a clinical condition associated with painful headaches and other symptoms such as nausea, sensitivity to smell, and others. These headaches generally occur on one side of the head and each episode of migraine has different duration and intensity. Migraine drugs are employed in the treatment of headaches associated with migraine.

Rise in prevalence of migraine drives the migraine drugs market. Moreover, increase in female population and surge in awareness among patients related to prevention and treatment of migraine are the key factors that augment the growth of the market. However, side effects associated with migraine drugs is a factor that hinders the market growth. On the contrary, the presence of growth opportunities in emerging nations is expected to provide new opportunities for the key players.

The report segments the migraine drugs market based on type, route of administration, distribution channel, and region. Based on type, the market is bifurcated into abortive medicine and preventive medicine. Depending on route of administration, it is fragmented into oral, injection, and others. By distribution channel, it is categorized into hospital-based pharmacies, retail pharmacies, and online pharmacies. Based on region, it is analyzed across North America (U.S., Canada, and Mexico), Europe (Germany, France, UK, Italy, Spain, and rest of Europe), Asia-Pacific (China, Japan, Australia, India, South Korea, and rest of Asia-Pacific), and LAMEA (Brazil, South Africa, Saudi Arabia, and rest of LAMEA).

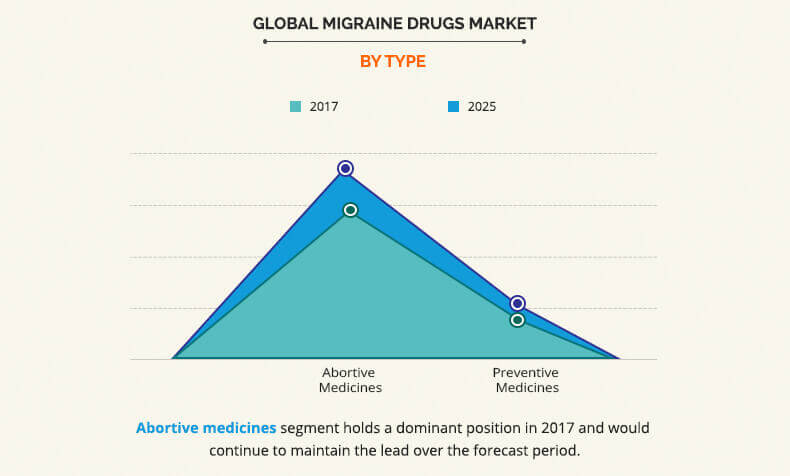
Abortive Medicines dominated the migraine drugs market in 2017, owing to the ease of self-administration in case of patients with symptoms of nausea and vomiting along with migraine.

Female Population are Mostly Affected

Migraine pain is commonly prevalent in women as compared to men. According to the Migraine Association of Ireland, the ratio of female migraineurs to male migraineurs was found to be 3:1 in the global population in 2018. This is attributed to the changes in estrogen levels in females, especially during menstruation. Moreover, hormonal medications, such as oral contraceptives and hormone replacement therapy may further worsen migraine in women. Therefore, increase in the global female population is anticipated to propel the growth of migraine drugs market

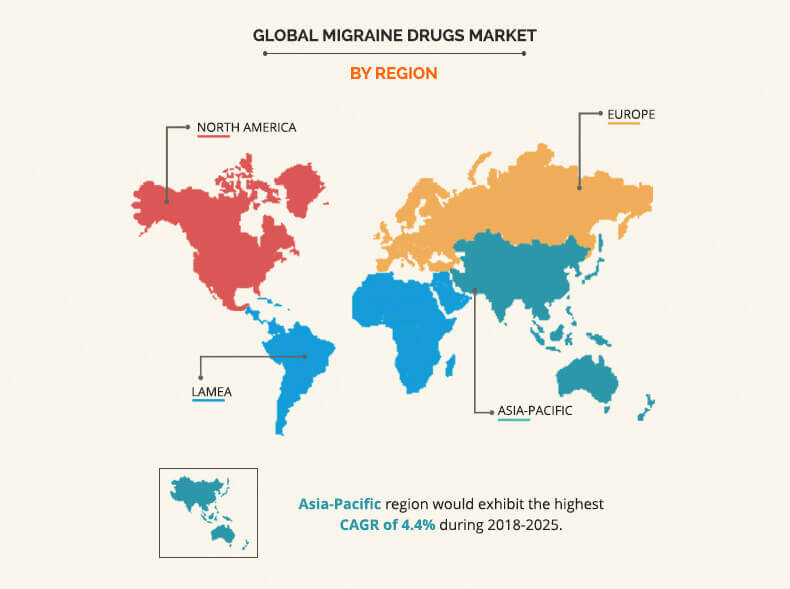
Rise in focus of vendors on the emerging markets, such as Asia-Pacific and LAMEA, is expected to boost the market growth. Asia-Pacific is projected to witness significant growth in future, owing to rise in demand for better healthcare facilities and improvements in healthcare infrastructure. Furthermore, this region presents remarkable opportunities for the venture capitalists and investors, as the developed markets are comparatively saturated.

The report provides an extensive competitive analysis and profiles of the key market players in the migraine drugs industry such as Abbott Laboratories, Allergan Plc., AstraZeneca, Eisai Co., Ltd., Endo International Plc., GlaxoSmithKline Plc., Impax Laboratories, Johnson & Johnson, Merck & Co., and Pfizer Inc. The other players in the value chain (not included in the report) include Novartis International AG, Teva Pharmaceutical Industries Limited, and Sanofi SA.

Key Benefits

  • This report entails a detailed quantitative analysis of the current market trends from 2017 to 2025 to identify the prevailing opportunities along with strategic assessment of the global migraine drugs market.
  • Migraine drugs market size and estimations are based on comprehensive analysis of the applications and developments in the industry.
  • A qualitative analysis based on innovative products and devices facilitate the strategic business planning.
  • The development strategies adopted by the key market players are enlisted to understand the competitive scenario of the migraine drugs industry.

Migraine Drugs Market Key Segments:

By Type

  • Abortive Medicine
    • Triptans (Serotonin Receptor Agonists)
    • Ergotamine Derivative
    • Others
  • Preventive Medicine
    • Anticonvulsant
    • Antidepressant
    • Beta Blocker
    • Others

By Route of Administration

  • Oral
  • Injection
  • Others

By Distribution Channel

  • Hospital-based Pharmacies
  • Retail Pharmacies
  • Online Pharmacies

By Region

  • North America
    • U.S.
    • Canada
    • Mexico
  • Europe
    • Germany
    • France
    • UK
    • Italy
    • Spain
    • Rest of Europe
  • Asia-Pacific
    • Japan
    • China
    • India
    • Australia
    • South Korea
    • Rest of Asia-Pacific
  • LAMEA
    • Brazil
    • Saudi Arabia
    • South Africa
    • Rest of LAMEA

Migraine Drugs Market Report Highlights

Aspects Details
By TYPE
  • Abortive medicines
    • Triptans
    • Ergotamine derivatives
    • Other abortive medicines
  • Preventive medicines
    • Anticonvulsants
    • Antidepressants
    • Beta blockers
    • Other preventive medicines
By ROUTE OF ADMINISTRATION
  • Oral
  • Injection
  • Other routes
By DISTRIBUTION CHANNEL
  • Retail pharmacies
  • Hospital pharmacies
  • Online pharmacies
By Region
  • North America  (U.S., Canada, Mexico)
  • Europe  (France, Germany, Italy, Spain, UK, Russia, Rest of Europe)
  • Asia-Pacific  (China, Japan, India, South Korea, Australia, Thailand, Malaysia, Indonesia, Rest of Asia-Pacific)
  • LAMEA  (Brazil, South Africa, Saudi Arabia, UAE, Argentina, Rest of LAMEA)
Key Market Players Endo International Plc., AstraZeneca PLC, Pfizer Inc., Allergan Plc., Abbott Laboratories, Johnson & Johnson, AbbVie Inc., GlaxoSmithKline Plc., Eisai Co., Ltd., Merck & Co., Inc.
 

CHAPTER 1: INTRODUCTION

1.1. REPORT DESCRIPTION
1.2. KEY BENEFITS FOR STAKEHOLDERS
1.3. KEY MARKET SEGMENTS

1.3.1. List of players profiled in the report

1.4. RESEARCH METHODOLOGY

1.4.1. Secondary research
1.4.2. Primary research
1.4.3. Analyst tools and models

CHAPTER 2: EXECUTIVE SUMMARY

2.1. KEY FINDINGS OF THE STUDY
2.2. CXO perspective

CHAPTER 3: MARKET OVERVIEW

3.1. MARKET DEFINITION AND SCOPE
3.2. Key findings

3.2.1. Top investment pockets
3.2.2. Top winning strategies, 2016-2018
3.2.3. Market share analysis, 2017

3.3. MARKET DYNAMICS

3.3.1. Drivers

3.3.1.1. Increase in prevalence of migraine
3.3.1.2. Growth in female population
3.3.1.3. Rise in awareness among patients towards migraine treatment & prevention

3.3.2. Restraints

3.3.2.1. Side effects of migraine drugs

3.3.3. Opportunities

3.3.3.1. Emerging migraine therapies
3.3.3.2. Growth opportunities in the emerging economies

3.3.4. Impact analyses

CHAPTER 4: MIGRAINE DRUGS MARKET, BY TYPE

4.1. Overview
4.2. Abortive medicines

4.2.1. Key market trends, growth factors, and opportunities
4.2.2. Market size and forecast, by type

4.2.2.1. Triptans

4.2.2.1.1. Market size and forecast

4.2.2.2. Ergotamine derivatives

4.2.2.2.1. Market size and forecast

4.2.2.3. Other abortive medicines

4.2.2.3.1. Market size and forecast

4.2.3. Market size and forecast, by region
4.2.4. Market analysis, by country

4.3. Preventive medicines

4.3.1. Key market trends, growth factors, and opportunities
4.3.2. Market size and forecast, by type

4.3.2.1. Anticonvulsants

4.3.2.1.1. Market size and forecast

4.3.2.2. Antidepressants

4.3.2.2.1. Market size and forecast

4.3.2.3. Beta blockers

4.3.2.3.1. Market size and forecast

4.3.2.4. Other preventive medicines

4.3.2.4.1. Market size and forecast

4.3.3. Market size and forecast, by region
4.3.4. Market analysis, by country

CHAPTER 5: MIGRAINE DRUGS MARKET, BY ROUTE OF ADMINISTRATION

5.1. Overview

5.1.1. Market size and forecast

5.2. Oral

5.2.1. Market size and forecast, by region
5.2.2. Market analysis, by country

5.3. Injection

5.3.1. Market size and forecast, region
5.3.2. Market analysis, by country

5.4. Other routes

5.4.1. Market size and forecast, by region
5.4.2. Market analysis, by country

CHAPTER 6: MIGRAINE DRUGS MARKET, BY DISTRIBUTION CHANNEL

6.1. Overview

6.1.1. Market size and forecast

6.2. Retail pharmacies

6.2.1. Market size and forecast, by region
6.2.2. Market analysis, by country

6.3. Hospital pharmacies

6.3.1. Market size and forecast, by region
6.3.2. Market analysis, by country

6.4. Online pharmacies

6.4.1. Market size and forecast, by region
6.4.2. Market analysis, by country

CHAPTER 7: MIGRAINE DRUGS MARKET, BY REGION

7.1. Overview

7.1.1. Market size and forecast

7.2. North America

7.2.1. Key market trends, growth factors, and opportunities
7.2.2. Market size and forecast, by country

7.2.2.1. U.S.

7.2.2.1.1. U.S. migraine drugs market, by type
7.2.2.1.2. U.S. migraine drugs market, by route of administration
7.2.2.1.3. U.S. migraine drugs market, by distribution channel

7.2.2.2. Canada

7.2.2.2.1. Canada migraine drugs market, by type
7.2.2.2.2. Canada migraine drugs market, by route of administration
7.2.2.2.3. Canada migraine drugs market, by distribution channel

7.2.2.3. Mexico

7.2.2.3.1. Mexico migraine drugs market, by type
7.2.2.3.2. Mexico migraine drugs market, by route of administration
7.2.2.3.3. Mexico migraine drugs market, by distribution channel

7.2.3. North America migraine drugs market, by type
7.2.4. North America migraine drugs market, by route of administration
7.2.5. North America migraine drugs market, by distribution channel

7.3. Europe

7.3.1. Key market trends, growth factors, and opportunities
7.3.2. Market size and forecast, by country

7.3.2.1. Germany

7.3.2.1.1. Germany migraine drugs market, by type
7.3.2.1.2. Germany migraine drugs market, by route of administration
7.3.2.1.3. Germany migraine drugs market, by distribution channel

7.3.2.2. France

7.3.2.2.1. France migraine drugs market, by type
7.3.2.2.2. France migraine drugs market, by route of administration
7.3.2.2.3. France migraine drugs market, by distribution channel

7.3.2.3. UK

7.3.2.3.1. UK migraine drugs market, by type
7.3.2.3.2. UK migraine drugs market, by route of administration
7.3.2.3.3. UK migraine drugs market, by distribution channel

7.3.2.4. Italy

7.3.2.4.1. Italy migraine drugs market, by type
7.3.2.4.2. Italy migraine drugs market, by route of administration
7.3.2.4.3. Italy migraine drugs market, by distribution channel

7.3.2.5. Spain

7.3.2.5.1. Spain migraine drugs market, by type
7.3.2.5.2. Spain migraine drugs market, by route of administration
7.3.2.5.3. Spain migraine drugs market, by distribution channel

7.3.2.6. Rest of Europe

7.3.2.6.1. Rest of Europe migraine drugs market, by type
7.3.2.6.2. Rest of Europe migraine drugs market, by route of administration
7.3.2.6.3. Rest of Europe migraine drugs market, by distribution channel

7.3.3. Europe migraine drugs market, by type
7.3.4. Europe migraine drugs market, by route of administration
7.3.5. Europe migraine drugs market, by distribution channel

7.4. Asia-Pacific

7.4.1. Key market trends, growth factors, and opportunities
7.4.2. Market size and forecast, by country

7.4.2.1. Japan

7.4.2.1.1. Japan migraine drugs market, by type
7.4.2.1.2. Japan migraine drugs market, by route of administration
7.4.2.1.3. Japan migraine drugs market, by distribution channel

7.4.2.2. China

7.4.2.2.1. China migraine drugs market, by type
7.4.2.2.2. China migraine drugs market, by route of administration
7.4.2.2.3. China migraine drugs market, by distribution channel

7.4.2.3. India

7.4.2.3.1. India migraine drugs market, by type
7.4.2.3.2. India migraine drugs market, by route of administration
7.4.2.3.3. India migraine drugs market, by distribution channel

7.4.2.4. Australia

7.4.2.4.1. Australia migraine drugs market, by type
7.4.2.4.2. Australia migraine drugs market, by route of administration
7.4.2.4.3. Australia migraine drugs market, by distribution channel

7.4.2.5. South Korea

7.4.2.5.1. South Korea migraine drugs market, by type
7.4.2.5.2. South Korea migraine drugs market, by route of administration
7.4.2.5.3. South Korea migraine drugs market, by distribution channel

7.4.2.6. Rest of Asia-Pacific

7.4.2.6.1. Rest of Asia-Pacific migraine drugs market, by type
7.4.2.6.2. Rest of Asia-Pacific migraine drugs market, by route of administration
7.4.2.6.3. Rest of Asia-Pacific migraine drugs market, by distribution channel

7.4.3. Asia-Pacific migraine drugs market, by type
7.4.4. Asia-Pacific migraine drugs market, by route of administration
7.4.5. Asia-Pacific migraine drugs market, by distribution channel

7.5. LAMEA

7.5.1. Key market trends, growth factors, and opportunities
7.5.2. Market size and forecast, by country

7.5.2.1. Brazil

7.5.2.1.1. Brazil migraine drugs market, by type
7.5.2.1.2. Brazil migraine drugs market, by route of administration
7.5.2.1.3. Brazil migraine drugs market, by distribution channel

7.5.2.2. Saudi Arabia

7.5.2.2.1. Saudi Arabia migraine drugs market, by type
7.5.2.2.2. Saudi Arabia migraine drugs market, by route of administration
7.5.2.2.3. Saudi Arabia migraine drugs market, by distribution channel

7.5.2.3. South Africa

7.5.2.3.1. South Africa migraine drugs market, by type
7.5.2.3.2. South Africa migraine drugs market, by route of administration
7.5.2.3.3. South Africa migraine drugs market, by distribution channel

7.5.2.4. Rest of LAMEA

7.5.2.4.1. Rest of LAMEA migraine drugs market, by type
7.5.2.4.2. Rest of LAMEA migraine drugs market, by route of administration
7.5.2.4.3. Rest of LAMEA migraine drugs market, by distribution channel

7.5.3. LAMEA migraine drugs market, by type
7.5.4. LAMEA migraine drugs market, by route of administration
7.5.5. LAMEA migraine drugs market, by distribution channel

CHAPTER 8: COMPANY PROFILES

8.1. Abbott Laboratories

8.1.1. Company overview
8.1.2. Company snapshot
8.1.3. Operating business segments
8.1.4. Product Portfolio
8.1.5. Business performance

8.2. AbbVie Inc.

8.2.1. Company overview
8.2.2. Company snapshot
8.2.3. Operating business segments
8.2.4. Product Portfolio
8.2.5. Business performance

8.3. Allergan Plc.

8.3.1. Company overview
8.3.2. Company snapshot
8.3.3. Operating business segments
8.3.4. Product Portfolio
8.3.5. Business performance
8.3.6. Key strategic moves and developments

8.4. AstraZeneca PLC

8.4.1. Company overview
8.4.2. Company snapshot
8.4.3. Operating business segments
8.4.4. Product Portfolio
8.4.5. Business performance

8.5. Eisai Co., Ltd.

8.5.1. Company overview
8.5.2. Company snapshot
8.5.3. Operating business segments
8.5.4. Product portfolio
8.5.5. Business performance

8.6. Endo International Plc.

8.6.1. Company overview
8.6.2. Company snapshot
8.6.3. Operating business segments
8.6.4. Product Portfolio
8.6.5. Business performance

8.7. GlaxoSmithKline Plc.

8.7.1. Company overview
8.7.2. Company snapshot
8.7.3. Operating business segments
8.7.4. Product Portfolio
8.7.5. Business performance

8.8. Johnson & Johnson

8.8.1. Company overview
8.8.2. Company snapshot
8.8.3. Operating business segments
8.8.4. Product Portfolio
8.8.5. Business performance

8.9. Merck & Co., Inc.

8.9.1. Company overview
8.9.2. Company snapshot
8.9.3. Operating business segments
8.9.4. Product Portfolio
8.9.5. Business performance

8.10. Pfizer Inc.

8.10.1. Company overview
8.10.2. Company snapshot
8.10.3. Operating business segments
8.10.4. Product Portfolio
8.10.5. Business performance

 LIST OF TABLES

TABLE 01. EXPECTED UPCOMING FDA DECISIONS FOR MIGRAINE DRUGS IN 2018
TABLE 02. GLOBAL MIGRAINE DRUGS MARKET, BY TYPE, 2017-2025 ($MILLION)
TABLE 03. COMMONLY USED ABORTIVE DRUGS FOR MIGRAINE TREATMENT
TABLE 04. ABORTIVE MIGRAINE DRUGS MARKET, BY TYPE, 2017-2025 ($MILLION)
TABLE 05. ABORTIVE MIGRAINE DRUGS MARKET, BY REGION, 2017-2025 ($MILLION)
TABLE 06. PREVENTIVE MIGRAINE DRUGS MARKET, BY TYPE, 2017-2025 ($MILLION)
TABLE 07. PREVENTIVE MIGRAINE DRUGS MARKET, BY REGION, 2017-2025 ($MILLION)
TABLE 08. GLOBAL MIGRAINE DRUGS MARKET, BY ROUTE OF ADMINISTRATION, 2017-2025 ($MILLION)
TABLE 09. ORAL MIGRAINE DRUGS MARKET, BY REGION, 2017-2025 ($MILLION)
TABLE 10. INJECTABLE MIGRAINE DRUGS MARKET, BY REGION, 2017-2025 ($MILLION)
TABLE 11. MIGRAINE DRUGS MARKET FOR OTHER ROUTES OF ADMINISTRATION, BY REGION, 2017-2025 ($MILLION)
TABLE 12. GLOBAL MIGRAINE DRUGS MARKET, BY DISTRIBUTION CHANNEL, 2017-2025 ($MILLION)
TABLE 13. MIGRAINE DRUGS MARKET FOR RETAIL PHARMACIES, BY REGION, 2017-2025 ($MILLION)
TABLE 14. MIGRAINE DRUGS MARKET FOR HOSPITAL PHARMACIES, BY REGION, 2017-2025 ($MILLION)
TABLE 15. MIGRAINE DRUGS MARKET FOR ONLINE PHARMACIES, BY REGION, 2017-2025 ($MILLION)
TABLE 16. MIGRAINE DRUGS MARKET, BY REGION, 2017-2025 ($MILLION)
TABLE 17. NORTH AMERICA MIGRAINE DRUGS MARKET, BY COUNTRY, 2017-2025 ($MILLION)
TABLE 18. U.S. MIGRAINE DRUGS MARKET, BY TYPE, 2017-2025 ($MILLION)
TABLE 19. U.S. MIGRAINE DRUGS MARKET, BY ROUTE OF ADMINISTRATION, 2017-2025 ($MILLION)
TABLE 20. U.S. MIGRAINE DRUGS MARKET, BY DISTRIBUTION CHANNEL, 2017-2025 ($MILLION)
TABLE 21. CANADA MIGRAINE DRUGS MARKET, BY TYPE, 2017-2025 ($MILLION)
TABLE 22. CANADA MIGRAINE DRUGS MARKET, BY ROUTE OF ADMINISTRATION, 2017-2025 ($MILLION)
TABLE 23. CANADA MIGRAINE DRUGS MARKET, BY DISTRIBUTION CHANNEL, 2017-2025 ($MILLION)
TABLE 24. MEXICO MIGRAINE DRUGS MARKET, BY TYPE, 2017-2025 ($MILLION)
TABLE 25. MEXICO MIGRAINE DRUGS MARKET, BY ROUTE OF ADMINISTRATION, 2017-2025 ($MILLION)
TABLE 26. MEXICO MIGRAINE DRUGS MARKET, BY DISTRIBUTION CHANNEL, 2017-2025 ($MILLION)
TABLE 27. NORTH AMERICA MIGRAINE DRUGS MARKET, BY TYPE, 2017-2025 ($MILLION)
TABLE 28. NORTH AMERICA MIGRAINE DRUGS MARKET, BY ROUTE OF ADMINISTRATION, 2017-2025 ($MILLION)
TABLE 29. NORTH AMERICA MIGRAINE DRUGS MARKET, BY DISTRIBUTION CHANNEL, 2017-2025 ($MILLION)
TABLE 30. EUROPE MIGRAINE DRUGS MARKET, BY COUNTRY, 2017-2025 ($MILLION)
TABLE 31. GERMANY MIGRAINE DRUGS MARKET, BY TYPE, 2017-2025 ($MILLION)
TABLE 32. GERMANY MIGRAINE DRUGS MARKET, BY ROUTE OF ADMINISTRATION, 2017-2025 ($MILLION)
TABLE 33. GERMANY MIGRAINE DRUGS MARKET, BY DISTRIBUTION CHANNEL, 2017-2025 ($MILLION)
TABLE 34. FRANCE MIGRAINE DRUGS MARKET, BY TYPE, 2017-2025 ($MILLION)
TABLE 35. FRANCE MIGRAINE DRUGS MARKET, BY ROUTE OF ADMINISTRATION, 2017-2025 ($MILLION)
TABLE 36. FRANCE MIGRAINE DRUGS MARKET, BY DISTRIBUTION CHANNEL, 2017-2025 ($MILLION)
TABLE 37. UK MIGRAINE DRUGS MARKET, BY TYPE, 2017-2025 ($MILLION)
TABLE 38. UK MIGRAINE DRUGS MARKET, BY ROUTE OF ADMINISTRATION, 2017-2025 ($MILLION)
TABLE 39. UK MIGRAINE DRUGS MARKET, BY DISTRIBUTION CHANNEL, 2017-2025 ($MILLION)
TABLE 40. ITALY MIGRAINE DRUGS MARKET, BY TYPE, 2017-2025 ($MILLION)
TABLE 41. ITALY MIGRAINE DRUGS MARKET, BY ROUTE OF ADMINISTRATION, 2017-2025 ($MILLION)
TABLE 42. ITALY MIGRAINE DRUGS MARKET, BY DISTRIBUTION CHANNEL, 2017-2025 ($MILLION)
TABLE 43. SPAIN MIGRAINE DRUGS MARKET, BY TYPE, 2017-2025 ($MILLION)
TABLE 44. SPAIN MIGRAINE DRUGS MARKET, BY ROUTE OF ADMINISTRATION, 2017-2025 ($MILLION)
TABLE 45. SPAIN MIGRAINE DRUGS MARKET, BY DISTRIBUTION CHANNEL, 2017-2025 ($MILLION)
TABLE 46. REST OF EUROPE MIGRAINE DRUGS MARKET, BY TYPE, 2017-2025 ($MILLION)
TABLE 47. REST OF EUROPE MIGRAINE DRUGS MARKET, BY ROUTE OF ADMINISTRATION, 2017-2025 ($MILLION)
TABLE 48. REST OF EUROPE MIGRAINE DRUGS MARKET, BY DISTRIBUTION CHANNEL, 2017-2025 ($MILLION)
TABLE 49. EUROPE MIGRAINE DRUGS MARKET, BY TYPE, 2017-2025 ($MILLION)
TABLE 50. EUROPE MIGRAINE DRUGS MARKET, BY ROUTE OF ADMINISTRATION, 2017-2025 ($MILLION)
TABLE 51. EUROPE MIGRAINE DRUGS MARKET, BY DISTRIBUTION CHANNEL, 2017-2025 ($MILLION)
TABLE 52. ASIA-PACIFIC MIGRAINE DRUGS MARKET, BY COUNTRY, 2017-2025 ($MILLION)
TABLE 53. JAPAN MIGRAINE DRUGS MARKET, BY TYPE, 2017-2025 ($MILLION)
TABLE 54. JAPAN MIGRAINE DRUGS MARKET, BY ROUTE OF ADMINISTRATION, 2017-2025 ($MILLION)
TABLE 55. JAPAN MIGRAINE DRUGS MARKET, BY DISTRIBUTION CHANNEL, 2017-2025 ($MILLION)
TABLE 56. CHINA MIGRAINE DRUGS MARKET, BY TYPE, 2017-2025 ($MILLION)
TABLE 57. CHINA MIGRAINE DRUGS MARKET, BY ROUTE OF ADMINISTRATION, 2017-2025 ($MILLION)
TABLE 58. CHINA MIGRAINE DRUGS MARKET, BY DISTRIBUTION CHANNEL, 2017-2025 ($MILLION)
TABLE 59. INDIA MIGRAINE DRUGS MARKET, BY TYPE, 2017-2025 ($MILLION)
TABLE 60. INDIA MIGRAINE DRUGS MARKET, BY ROUTE OF ADMINISTRATION, 2017-2025 ($MILLION)
TABLE 61. INDIA MIGRAINE DRUGS MARKET, BY DISTRIBUTION CHANNEL, 2017-2025 ($MILLION)
TABLE 62. ITALY MIGRAINE DRUGS MARKET, BY TYPE, 2017-2025 ($MILLION)
TABLE 63. AUSTRALIA MIGRAINE DRUGS MARKET, BY ROUTE OF ADMINISTRATION, 2017-2025 ($MILLION)
TABLE 64. AUSTRALIA MIGRAINE DRUGS MARKET, BY DISTRIBUTION CHANNEL, 2017-2025 ($MILLION)
TABLE 65. SOUTH KOREA MIGRAINE DRUGS MARKET, BY TYPE, 2017-2025 ($MILLION)
TABLE 66. SOUTH KOREA MIGRAINE DRUGS MARKET, BY ROUTE OF ADMINISTRATION, 2017-2025 ($MILLION)
TABLE 67. SOUTH KOREA MIGRAINE DRUGS MARKET, BY DISTRIBUTION CHANNEL, 2017-2025 ($MILLION)
TABLE 68. REST OF ASIA-PACIFIC MIGRAINE DRUGS MARKET, BY TYPE, 2017-2025 ($MILLION)
TABLE 69. REST OF ASIA-PACIFIC MIGRAINE DRUGS MARKET, BY ROUTE OF ADMINISTRATION, 2017-2025 ($MILLION)
TABLE 70. REST OF ASIA-PACIFIC MIGRAINE DRUGS MARKET, BY DISTRIBUTION CHANNEL, 2017-2025 ($MILLION)
TABLE 71. ASIA-PACIFIC MIGRAINE DRUGS MARKET, BY TYPE, 2017-2025 ($MILLION)
TABLE 72. ASIA-PACIFIC MIGRAINE DRUGS MARKET, BY ROUTE OF ADMINISTRATION, 2017-2025 ($MILLION)
TABLE 73. ASIA-PACIFIC MIGRAINE DRUGS MARKET, BY DISTRIBUTION CHANNEL, 2017-2025 ($MILLION)
TABLE 74. LAMEA MIGRAINE DRUGS MARKET, BY COUNTRY, 2017-2025 ($MILLION)
TABLE 75. BRAZIL MIGRAINE DRUGS MARKET, BY TYPE, 2017-2025 ($MILLION)
TABLE 76. BRAZIL MIGRAINE DRUGS MARKET, BY ROUTE OF ADMINISTRATION, 2017-2025 ($MILLION)
TABLE 77. BRAZIL MIGRAINE DRUGS MARKET, BY DISTRIBUTION CHANNEL, 2017-2025 ($MILLION)
TABLE 78. SAUDI ARABIA MIGRAINE DRUGS MARKET, BY TYPE, 2017-2025 ($MILLION)
TABLE 79. SAUDI ARABIA MIGRAINE DRUGS MARKET, BY ROUTE OF ADMINISTRATION, 2017-2025 ($MILLION)
TABLE 80. SAUDI ARABIA MIGRAINE DRUGS MARKET, BY DISTRIBUTION CHANNEL, 2017-2025 ($MILLION)
TABLE 81. SOUTH AFRICA MIGRAINE DRUGS MARKET, BY TYPE, 2017-2025 ($MILLION)
TABLE 82. SOUTH AFRICA MIGRAINE DRUGS MARKET, BY ROUTE OF ADMINISTRATION, 2017-2025 ($MILLION)
TABLE 83. SOUTH AFRICA MIGRAINE DRUGS MARKET, BY DISTRIBUTION CHANNEL, 2017-2025 ($MILLION)
TABLE 84. REST OF LAMEA MIGRAINE DRUGS MARKET, BY TYPE, 2017-2025 ($MILLION)
TABLE 85. REST OF LAMEA MIGRAINE DRUGS MARKET, BY ROUTE OF ADMINISTRATION, 2017-2025 ($MILLION)
TABLE 86. REST OF LAMEA MIGRAINE DRUGS MARKET, BY DISTRIBUTION CHANNEL, 2017-2025 ($MILLION)
TABLE 87. LAMEA MIGRAINE DRUGS MARKET, BY TYPE, 2017-2025 ($MILLION)
TABLE 88. LAMEA MIGRAINE DRUGS MARKET, BY ROUTE OF ADMINISTRATION, 2017-2025 ($MILLION)
TABLE 89. LAMEA MIGRAINE DRUGS MARKET, BY DISTRIBUTION CHANNEL, 2017-2025 ($MILLION)
TABLE 90. ABBOTT: COMPANY SNAPSHOT
TABLE 91. ABBOTT: OPERATING SEGMENTS
TABLE 92. ABBOTT: PRODUCT PORTFOLIO
TABLE 93. ABBVIE: COMPANY SNAPSHOT
TABLE 94. ABBVIE: OPERATING SEGMENTS
TABLE 95. ABBOTT: PRODUCT PORTFOLIO
TABLE 96. ALLERGAN: COMPANY SNAPSHOT
TABLE 97. ALLERGAN: OPERATING SEGMENTS
TABLE 98. ALLERGAN: PRODUCT PORTFOLIO
TABLE 99. ASTRAZENECA: COMPANY SNAPSHOT
TABLE 100. ASTRAZENECA: OPERATING SEGMENTS
TABLE 101. ASTRAZENECA: PRODUCT PORTFOLIO
TABLE 102. EISAI: COMPANY SNAPSHOT
TABLE 103. EISAI: OPERATING SEGMENTS
TABLE 104. EISAI: PRODUCT PORTFOLIO
TABLE 105. ENDO: COMPANY SNAPSHOT
TABLE 106. ENDO: OPERATING SEGMENTS
TABLE 107. ENDO: PRODUCT PORTFOLIO
TABLE 108. GSK: COMPANY SNAPSHOT
TABLE 109. GSK: OPERATING SEGMENTS
TABLE 110. GSK: PRODUCT PORTFOLIO
TABLE 111. J&J: COMPANY SNAPSHOT
TABLE 112. J&J: OPERATING SEGMENTS
TABLE 113. J&J: PRODUCT PORTFOLIO
TABLE 114. MERCK: COMPANY SNAPSHOT
TABLE 115. MERCK: OPERATING SEGMENTS
TABLE 116. MERCK: PRODUCT PORTFOLIO
TABLE 117. PFIZER: COMPANY SNAPSHOT
TABLE 118. PFIZER: OPERATING SEGMENTS
TABLE 119. PFIZER: PRODUCT PORTFOLIO

 LIST OF FIGURES

FIGURE 01. MIGRAINE DRUGS MARKET SEGMENTATION
FIGURE 02. TOP INVESTMENT POCKETS
FIGURE 03. MARKET SHARE ANALYSIS, 2017
FIGURE 04. IMPACT ANALYSES
FIGURE 05. TRIPTANS MARKET, 2017-2025 ($MILLION)
FIGURE 06. ERGOTAMINE DERIVATIVES MARKET, 2017-2025 ($MILLION)
FIGURE 07. OTHER ABORTIVE MIGRAINE DRUGS MARKET, 2017-2025 ($MILLION)
FIGURE 08. COMPARATIVE ANALYSIS OF ABORTIVE MIGRAINE DRUGS MARKET, BY COUNTRY, 2017 & 2025 (%)
FIGURE 09. MIGRAINE DRUGS MARKET FOR ANTICONVULSANTS, 2017-2025 ($MILLION)
FIGURE 10. MIGRAINE DRUGS MARKET FOR ANTIDEPRESSANTS, 2017-2025 ($MILLION)
FIGURE 11. MIGRAINE DRUGS MARKET FOR BETA BLOCKERS, 2017-2025 ($MILLION)
FIGURE 12. MIGRAINE DRUGS MARKET FOR OTHER PREVENTIVE MEDICINES, 2017-2025 ($MILLION)
FIGURE 13. COMPARATIVE ANALYSIS OF PREVENTIVE MIGRAINE DRUGS MARKET, BY COUNTRY, 2017 & 2025 (%)
FIGURE 14. COMPARATIVE ANALYSIS OF ORAL MIGRAINE DRUGS MARKET, BY COUNTRY, 2017 & 2025 (%)
FIGURE 15. COMPARATIVE ANALYSIS OF INJECTABLE MIGRAINE DRUGS MARKET, BY COUNTRY, 2017 & 2025 (%)
FIGURE 16. COMPARATIVE ANALYSIS OF MIGRAINE DRUGS MARKET FOR OTHER ROUTES OF ADMINISTRATION, BY COUNTRY, 2017 & 2025 (%)
FIGURE 17. COMPARATIVE ANALYSIS OF MIGRAINE DRUGS MARKET FOR RETAIL PHARMACIES, BY COUNTRY, 2017 & 2025 (%)
FIGURE 18. COMPARATIVE ANALYSIS OF MIGRAINE DRUGS MARKET FOR HOSPITAL PHARMACIES, BY COUNTRY, 2017 & 2025 (%)
FIGURE 19. COMPARATIVE ANALYSIS OF MIGRAINE DRUGS MARKET FOR ONLINE PHARMACIES, BY COUNTRY, 2017 & 2025 (%)
FIGURE 20. FREQUENCY OF ADULTS SUFFERING FROM HEADACHES IN U.S., 2017, BY GENDER
FIGURE 21. ABBOTT: NET SALES, 2015-2017 ($MILLION)
FIGURE 22. ABBOTT: NET SALES SHARE BY OPERATING SEGMENT, 2017 (%)
FIGURE 23. ABBOTT: NET SALES SHARE BY GEOGRAPHY, 2017 (%)
FIGURE 24. ABBVIE: NET SALES, 2015-2017 ($MILLION)
FIGURE 25. ABBVIE: REVENUE SHARE BY SEGMENT, 2017 (%)
FIGURE 26. ABBVIE: REVENUE SHARE BY GEOGRAPHY, 2017 (%)
FIGURE 27. ALLERGAN: REVENUE, 2015-2017 ($MILLION)
FIGURE 28. ALLERGAN: REVENUE SHARE BY SEGMENT, 2017 (%)
FIGURE 29. ASTRAZENECA: REVENUE, 2015-2017 ($MILLION)
FIGURE 30. ASTRAZENECA: REVENUE SHARE BY GEOGRAPHY, 2017 (%)
FIGURE 31. EISAI: REVENUE, 2015-2017 ($MILLION)
FIGURE 32. EISAI: REVENUE BY SEGMENT, 2017 (%)
FIGURE 33. REVENUE, 2015-2017 ($MILLION)
FIGURE 34. ENDO: REVENUE SHARE BY SEGMENT, 2017 (%)
FIGURE 35. GSK: REVENUE, 2015-2017 ($MILLION)
FIGURE 36. GSK: REVENUE SHARE BY SEGMENT, 2017 (%)
FIGURE 37. GSK: REVENUE SHARE BY GEOGRAPHY, 2017 (%)
FIGURE 38. J&J: REVENUE, 2015-2017 ($MILLION)
FIGURE 39. J&J: REVENUE SHARE BY SEGMENT, 2017 (%)
FIGURE 40. J&J: REVENUE SHARE BY GEOGRAPHY, 2017 (%)
FIGURE 41. MERCK: NET SALES, 2015-2017 ($MILLION)
FIGURE 42. MERCK: NET SALES BY SEGMENT, 2017 (%)
FIGURE 43. MERCK: NET SALES BY GEOGRAPHY, 2017 (%)
FIGURE 44. PFIZER: REVENUE, 2015-2017 ($MILLION)
FIGURE 45. PFIZER: REVENUE SHARE BY SEGMENT, 2017 (%)
FIGURE 46. PFIZER: REVENUE SHARE BY GEOGRAPHY, 2017 (%)


Migraines are severe, periodic, and painful headaches preceded or accompanied by sensory warning signs such as sensitivity to sound, light, and other visual disturbances. Migraine drugs are the medicines employed for the treatment of pain and other symptoms associated with migraines. The growth of migraine drugs market is propelled by rise in prevalence of migraine and increase in the awareness associated with treatment of migraine among patients. Furthermore, development of new therapies for the treatment of migraine is anticipated to boost the market growth during the forecast period.

The use of migraine drugs is highest in North America, attributed to the government reforms for awareness toward migraine and rise in prevalence of migraine. North America is followed by Europe and Asia-Pacific. In addition, migraine drugs manufacturing companies have focused on expanding their presence in the emerging economies, which is anticipated to drive the market growth.

PURCHASE OPTIONS

Call or Email us

U.S.-Canada Toll-free: +1-800-792-5285
Int'l : +1-503-894-6022
Europe : +44-845-528-1300
Email : help@alliedmarketresearch.com

Looking for Customization?

 Customization Request

Have a Question?

 Speak with Analyst

Any Confusion?

 Inquire Before Buying

Have a glance of the Report

  Request Sample

Purchase Full Report of
Migraine Drugs Market

Start reading instantly.
This Report and over 66,782+ more Reports, Available with Avenue Library. T&C*.

  • Online Only
  • $3,456
  • Online cloud access only
  • Restricted print, copy, paste & download
  • Read only
  • Free industry update
    (Within 180 days)
  • Free report update in next update cycle
    (Jul 2019 - Jul 2020)
  • Data Pack
  • $3,840
  • Restricted to one authorized user
  • One print only
  • Available in
    Excel
  • Free industry update
    (Within 180 days)
  •   Free report update in next update cycle
    (Jul 2019 - Jul 2020)
  • Single User
  • $5,769
  • Restricted to one authorized user
  • One print only
  • Available in
    PDF
  • Free industry update
    (Within 180 days)
  •   Free report update in next update cycle
    (Jul 2019 - Jul 2020)
  • Five Users
  • $6,450
  • Limited to five authorized users
  • Print upto five copies
  • Available in
    PDF
  • Free industry update
    (Within 180 days)
  •   Free report update in next update cycle
    (Jul 2019 - Jul 2020)
  • Enterprise
    License/PDF

  • $10,995
  • Unlimited
    within
    company/enterprise
  • Available in Excel & PDF
  • Free industry update
    (Within 180 days)
  •   Free report update in next update cycle
    (Jul 2019 - Jul 2020)
  • Library
    Membership

  • $999 $ 1,175
    Per User/ Per month/ Billed annually
  • Published Content
    E-access
  • Company Profiles
    E-access
  • Newly Added Content Access
  • 10 PDF
    Downloads
  • 5 Excel Data
    Pack Downloads
  • 250 Company Profiles PDF Downloads
  • Buy Now

*Taxes/Fees, if applicable will be added during checkout. All prices in USD

RELATED REPORTS
 

Why Allied Market Research?


Infallible Methodology

To ensure high-level data integrity, accurate analysis, and impeccable forecasts

Analyst Support

For complete satisfaction

Customization

On-demand customization of scope of the report to exactly meet your needs

TARGETED MARKET VIEW

Targeted market view to provide pertinent information and save time of readers

Get fresh content delivered

Get insights on topics that are crucial for your business. Stay abreast of your interest areas.

Get Industry Data Alerts

Why Allied Market Research?

Infallible Methodology

To ensure high-level data integrity, accurate analysis, and impeccable forecasts

Analyst Support

For complete satisfaction

Customization

On-demand customization of scope of the report to exactly meet your needs

TARGETED MARKET VIEW

Targeted market view to provide pertinent information and save time of readers