Report Code: A13133 | Aug 2021 | Pages: 350 | ||
Tables: 125 | Charts: 93 |
|
Pandemic disrupted the entire world and affected many industries.
Get detailed COVID-19 impact analysis on the Mobile Artificial Intelligence (ai) Market
Request Now !
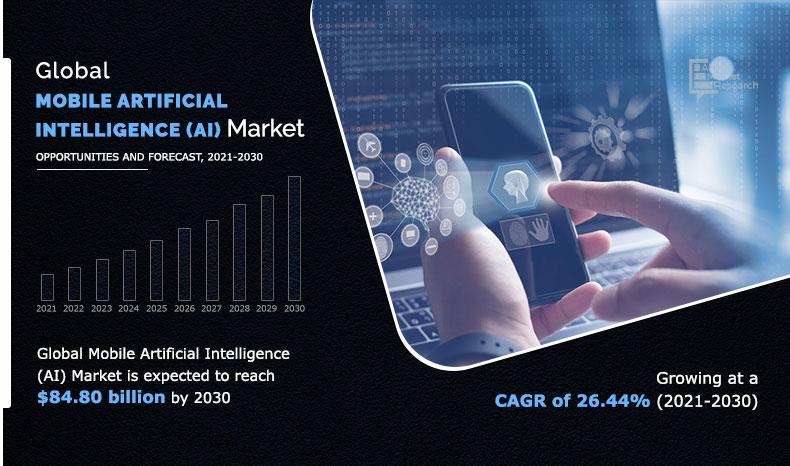
The global mobile artificial intelligence (AI) market size is expected to reach $84.80 billion by 2030 from $8.56 billion in 2020, growing at a CAGR of 26.44% from 2021 to 2030.
The automotive industry impacted negatively, due to COVID-19 Pandemic.
Artificial Intelligence (AI) is playing an increasingly prominent role in day to day lives and it has abilities to transform the technological landscape as it continues to develop. Complex algorithms and processes, such as machine learning and deep learning, are driving the transformation boosting the need for more powerful on-device AI solutions. From the camera to smart assistants, AI can be found in almost every smartphone feature. By simulating human intelligence, AI enables devices to acquire information and rules automatically, and even reach conclusion and take actions independently. These capabilities enable mobile devices to offer more enriching and secure experiences. As the technology continues to advance, fast and power efficient on-device AI solutions will be the key to unlock future innovations, such as virtual reality and autonomous driving, and reduce the reliance on cloud AI operations.
Smartphones devices are equipped with GPS tracking, as well as microphone and camera features, making mobile the ideal platform for AI applications. Further, Apple revealed that the iPhone XS, XS Max and XR will include an A12 Bionic chip featuring a neural engine built to utilize AI hardware in previously impossible ways. Combining AI technology with these built-in features makes apps more relevant and personalized. Using AI to contextualize user behavior will make each app session more valuable than the last. As the smartphone market shifts from selling technology products to delivering compelling and personalized experiences, AI solutions running on the smartphone will become an essential part of vendor roadmaps over the next two years.
The global mobile artificial intelligence (AI) market size is anticipated to witness significant growth during the forecast period. Factors, such as high demand for Artificial Intelligence in smartphones, rise in demand for AI-capable processors, and rising investment in artificial intelligence (AI) technologies drive the mobile artificial intelligence (AI) market growth. Artificial intelligence technology is widely used in many groundbreaking applications in industrial, automotive and video gaming. Now, smartphones industry also started using AI technology, and it goes far beyond applications such as digital assistants. Several mobile manufacturing companies are competing to develop AI features for smartphones according to the needs of the users. However, high pricing of artificial processors is a major restraint to the global mobile artificial intelligence (AI) market growth.
In addition, the emergence of edge computing is expected to create opportunities for the mobile artificial intelligence (AI) industry. In the last few years, the AI implementations in various companies have changed around the world. As more enterprise-wide efforts dominate, the cloud computing became an essential component of the AI evolution. As customers spend more time on their devices, businesses increasingly realize the need to bring essential computation onto the device to serve more customers. This is the reason that edge computing will continue to accelerate in the next few years.
The global mobile artificial intelligence (AI) market share is segmented on the basis of technology node, component, application, and region. By technology node, the market is classified into 20–28nm, 10nm, 7nm, and others. By component, it is divided into hardware, software, and services. On the basis of hardware, the market is sub-segmented into processor, memory, sensor, others. Depending on application, it is separated into smartphones, cameras, drones, automotive, robotics, AR/VR, and others.
Region-wise, the mobile artificial intelligence (AI) market trends are analyzed across North America (U.S., Canada, and Mexico), Europe (Germany, UK, France, Italy, and Rest of Europe), Asia-Pacific (China, Japan, India, South Korea, Taiwan, and Rest of Asia-Pacific), and LAMEA (Latin America, the Middle East, and Africa). North America region is projected to have the most significant increase in demand, as it provides a suitable environment for startups and SMEs, in terms of government regulations and compliance.
The prominent factors that impact the mobile artificial intelligence (AI) market growth are high demand for artificial intelligence in smartphones, growing demand for AI-capable processors, and rising investment in Artificial Intelligence (AI) technologies. However, high pricing of artificial processors restricts the market growth. On the contrary, the emergence of edge computing is expected to create lucrative opportunities for the market. Therefore, these factors are expected to definitely affect mobile artificial intelligence (AI) industry during the forecast period.
Competitive analysis and profiles of the major mobile artificial intelligence (AI) market players, such as NVIDIA Corporation (U.S.), Intel Corporation (U.S.), Microsoft Corporation (U.S.), IBM Corporation (U.S.), Qualcomm Inc. (U.S.), Apple Inc. (U.S.), Google (U.S.), Samsung Electronics (South Korea), MediaTek Inc. (Taiwan), and Huawei Technologies (China) are focusing their investment on technologically advanced, cost-effective, and more secure products and solutions for various applications.
COVID-19 IMPACT ANALYSIS
Key Benefits For Stakeholders
Key Market Segments
By Technology Node
By Component
By Application
By Region
Key Players
Mobile Artificial Intelligence (AI) Market Report Highlights
Aspects | Details |
---|---|
By Technology Node |
|
By Component |
|
By Application |
|
By Region |
|
Key Market Players | Apple Inc., Google LLC (Alphabet Inc.), Qualcomm Technologies, Inc., INTEL CORPORATION, MEDIATEK, INC., NVIDIA CORPORATION., Huawei Technologies Co., Ltd. (Huawei), Samsung Electronics, MICROSOFT CORPORATION, International Business Machines Corporation (IBM) |
CHAPTER 1:INTRODUCTION'
1.1.Report description
1.2.Key benefits for stakeholders
1.3.Key market segments
1.4.Research methodology
1.4.1.Primary research
1.4.2.Secondary research
1.4.3.Analyst tools and models
CHAPTER 2:EXECUTIVE SUMMARY
2.1.Key findings
2.1.1.Top impacting factors
2.1.2.Top investment pockets
2.2.CXO perspective
CHAPTER 3:MARKET OVERVIEW
3.1.Market definition and scope
3.2.Key forces shaping the Mobile AI
3.3.Patent analysis
3.3.1.By region, 2012–2020
3.3.2.By applicant, 2012–2020
3.4.Covid-19 impact analysis
3.4.1.COVID-19 outbreak
3.4.2.Impact on market size
3.4.3.End user trends, preferences, and budget impact
3.5.Market dynamics
3.5.1.Drivers
3.5.1.1.High demand for Artificial Intelligence in smartphones
3.6.3.1.Growing demand for AI-capable processors
3.5.1.2.Rising investment in Artificial Intelligence (AI) technologies
3.5.2.Restraint
3.5.2.1.High pricing of artificial processors
3.5.3.Opportunity
3.5.3.1.The emergence of edge computing
CHAPTER 4:MOBILE ARTIFICIAL INTELLIGENCE (AI) MARKET , BY TECHNOLOGY NODE
4.1.Overview
4.2.20–28nm
4.2.1.Key market trends, growth factors, and opportunities
4.2.2.Market size and forecast, by region
4.2.3.Market analysis, by country
4.3.10nm
4.3.1.Key market trends, growth factors, and opportunities
4.3.2.Market size and forecast, by region
4.3.3.Market analysis, by country
4.4.7nm
4.4.1.Key market trends, growth factors, and opportunities
4.4.2.Market size and forecast, by region
4.4.3.Market analysis, by country
4.5.Others
4.5.1.Key market trends, growth factors, and opportunities
4.5.2.Market size and forecast, by region
4.5.3.Market analysis, by country
CHAPTER 5:MOBILE ARTIFICIAL INTELLIGENCE (AI) MARKET, BY COMPONENT
5.1.Overview
5.2.Hardware
5.2.1.Processors
5.2.1.1.Central processing unit (CPU)
5.2.1.2.Graphics processing unit (GPU)
5.2.1.3.Field-programmable gate array (FPGA)
5.2.1.4.Application-specific integrated circuit (ASIC)
5.2.1.5.Tensor processing unit (TPU)
5.2.2.Memory
5.2.3.Sensors
5.2.4.Others
5.2.5.Key market trends, growth factors, and opportunities
5.2.6.Market size and forecast, by region
5.2.7.Market analysis, by country
5.3.Software
5.3.1.Key market trends, growth factors, and opportunities
5.3.2.Market size and forecast, by region
5.3.3.Market analysis, by country
5.4.Services
5.4.1.Key market trends, growth factors, and opportunities
5.4.2.Market size and forecast, by region
5.4.3.Market analysis, by country
CHAPTER 6:MOBILE ARTIFICIAL INTELLIGENCE (AI) MARKET, BY APPLICATION
6.1.Overview
6.2.Smartphones
6.2.1.Key market trends, growth factors, and opportunities
6.2.2.Market size and forecast, by region
6.2.3.Market analysis, by country
6.3.Cameras
6.3.1.Key market trends, growth factors, and opportunities
6.3.2.Market size and forecast, by region
6.3.3.Market analysis, by country
6.4.Drones
6.4.1.Key market trends, growth factors, and opportunities
6.4.2.Market size and forecast, by region
6.4.3.Market analysis, by country
6.5.Automotive
6.5.1.Key market trends, growth factors, and opportunities
6.5.2.Market size and forecast, by region
6.5.3.Market analysis, by country
6.6.Robotics
6.6.1.Key market trends, growth factors, and opportunities
6.6.2.Market size and forecast, by region
6.6.3.Market analysis, by country
6.7.AR/ VR
6.7.1.Key market trends, growth factors, and opportunities
6.7.2.Market size and forecast, by region
6.7.3.Market analysis, by country
6.8.Others
6.8.1.Key market trends, growth factors, and opportunities
6.8.2.Market size and forecast, by region
6.8.3.Market analysis, by country
CHAPTER 7:MOBILE ARTIFICIAL INTELLIGENCE (AI) MARKET, BY REGION
7.1.Overview
7.2.North America
7.2.1.Key market trends, growth factors, and opportunities
7.2.2.Market size and forecast, by technology node
7.2.3.Market size and forecast, by component
7.2.4.Market size and forecast, by application
7.2.5.Market analysis, by country
7.2.5.1.U.S.
7.2.5.1.1.Market size and forecast, by technology node
7.2.5.1.2.Market size and forecast, by Component
7.2.5.1.3.Market size and forecast, by application
7.2.5.2.Canada
7.2.5.2.1.Market size and forecast, by technology node
7.2.5.2.2.Market size and forecast, by Component
7.2.5.2.3.Market size and forecast, by application
7.2.5.3.Mexico
7.2.5.3.1.Market size and forecast, by technology node
7.2.5.3.2.Market size and forecast, by Component
7.2.5.3.3.Market size and forecast, by application
7.3.Europe
7.3.1.Key market trends, growth factors, and opportunities
7.3.2.Market size and forecast, by technology node
7.3.3.Market size and forecast, by component
7.3.4.Market size and forecast, by application
7.3.5.Market analysis, by country
7.3.5.1.UK
7.3.5.1.1.Market size and forecast, by technology node
7.3.5.1.2.Market size and forecast, by Component
7.3.5.1.3.Market size and forecast, by application
7.3.5.2.Germany
7.3.5.2.1.Market size and forecast, by technology node
7.3.5.2.2.Market size and forecast, by Component
7.3.5.2.3.Market size and forecast, by application
7.3.5.3.France
7.3.5.3.1.Market size and forecast, by technology node
7.3.5.3.2.Market size and forecast, by Component
7.3.5.3.3.Market size and forecast, by application
7.3.5.4.Italy
7.3.5.4.1.Market size and forecast, by technology node
7.3.5.4.2.Market size and forecast, by Component
7.3.5.4.3.Market size and forecast, by application
7.3.5.5.Rest of Europe
7.3.5.5.1.Market size and forecast, by technology node
7.3.5.5.2.Market size and forecast, by Component
7.3.5.5.3.Market size and forecast, by application
7.4.Asia-Pacific
7.4.1.Key market trends, growth factors, and opportunities
7.4.2.Market size and forecast, by technology node
7.4.3.Market size and forecast, by component
7.4.4.Market size and forecast, by application
7.4.5.Market analysis, by country
7.4.5.1.China
7.4.5.1.1.Market size and forecast, by technology node
7.4.5.1.2.Market size and forecast, by Component
7.4.5.1.3.Market size and forecast, by application
7.4.5.2.Japan
7.4.5.2.1.Market size and forecast, by technology node
7.4.5.2.2.Market size and forecast, by Component
7.4.5.2.3.Market size and forecast, by application
7.4.5.3.India
7.4.5.3.1.Market size and forecast, by technology node
7.4.5.3.2.Market size and forecast, by Component
7.4.5.3.3.Market size and forecast, by application
7.4.5.4.South Korea
7.4.5.4.1.Market size and forecast, by technology node
7.4.5.4.2.Market size and forecast, by Component
7.4.5.4.3.Market size and forecast, by application
7.4.5.5.Taiwan
7.4.5.5.1.Market size and forecast, by technology node
7.4.5.5.2.Market size and forecast, by Component
7.4.5.5.3.Market size and forecast, by application
7.4.5.6.Rest of Asia-Pacific
7.4.5.6.1.Market size and forecast, by technology node
7.4.5.6.2.Market size and forecast, by Component
7.4.5.6.3.Market size and forecast, by application
7.5.LAMEA
7.5.1.Key market trends, growth factors, and opportunities
7.5.2.Market size and forecast, by technology node
7.5.3.Market size and forecast, by component
7.5.4.Market size and forecast, by application
7.5.5.Market analysis, by country
7.5.5.1.Latin America
7.5.5.1.1.Market size and forecast, by technology node
7.5.5.1.2.Market size and forecast, by Component
7.5.5.1.3.Market size and forecast, by application
7.5.5.2.Middle East
7.5.5.2.1.Market size and forecast, by technology node
7.5.5.2.2.Market size and forecast, by Component
7.5.5.2.3.Market size and forecast, by application
7.5.5.3.Africa
7.5.5.3.1.Market size and forecast, by technology node
7.5.5.3.2.Market size and forecast, by Component
7.5.5.3.3.Market size and forecast, by application
CHAPTER 8:COMPETITIVE LANDSCAPE
8.1.Introduction
8.1.1.Market player positioning, 2020
8.2.Top winning strategies
CHAPTER 9:COMPANY PROFILES
9.1.Apple Inc.
9.1.1.Company overview
9.1.2.Key executives
9.1.3.Company snapshot
9.1.4.Operating business segments
9.1.5.Product portfolio
9.1.6.R&D expenditure
9.1.7.Business performance
9.1.8.Key strategic moves and developments
9.2.MICROSOFT CORPORATION
9.2.1.Company overview
9.2.2.Key executives
9.2.3.Company snapshot
9.2.4.Operating business segments
9.2.5.Product portfolio
9.2.6.R&D expenditure
9.2.7.Business performance
9.2.8.Key strategic moves and developments
9.3.INTEL CORPORATION
9.3.1.Company overview
9.3.2.Key executives
9.3.3.Company snapshot
9.3.4.Operating business segments
9.3.5.Product portfolio
9.3.6.R&D expenditure
9.3.7.Business performance
9.3.8.Key strategic moves and developments
9.4.Google LLC (Alphabet Inc.)
9.4.1.Company overview
9.4.2.Key executives
9.4.3.Company snapshot
9.4.4.Operating business segments
9.4.5.Product portfolio
9.4.6.R&D expenditure
9.4.7.Business performance
9.4.8.Key strategic moves and developments
9.5.Huawei Technologies Co., Ltd. (Huawei)
9.5.1.Company overview
9.5.2.Key executives
9.5.3.Company snapshot
9.5.4.Operating business segments
9.5.5.Product portfolio
9.5.6.R&D Expenditure
9.5.7.Business performance
9.5.8.Key strategic moves and developments
9.6.International Business Machines Corporation (IBM)
9.6.1.Company overview
9.6.2.Key executives
9.6.3.Company snapshot
9.6.4.Operating business segments
9.6.5.Product portfolio
9.6.6.R&D expenditure
9.6.7.Business performance
9.6.8.Key strategic moves and developments
9.7.Samsung Electronics
9.7.1.Company overview
9.7.2.Key executives
9.7.3.Company snapshot
9.7.4.Operating business segments
9.7.5.Product portfolio
9.7.6.R&D expenditure
9.7.7.Business performance
9.7.8.Key strategic moves and developments
9.8.Qualcomm Technologies, Inc.
9.8.1.Company overview
9.8.2.Key Executives
9.8.3.Company snapshot
9.8.4.Operating business segments
9.8.5.Product portfolio
9.8.6.R&D expenditure
9.8.7.Business performance
9.8.8.Key strategic moves and developments
9.9.MEDIATEK, INC.
9.9.1.Company overview
9.9.2.Company snapshot
9.9.3.Product portfolio
9.9.4.Business performance
9.9.5.Key strategic moves and developments
9.10.NVIDIA CORPORATION.
9.10.1.Company overview
9.10.2.Company snapshot
9.10.3.Operating business segments
9.10.4.Product portfolio
9.10.5.R&D expenditure
9.10.6.Business performance
9.10.7.Key strategic moves and developments
DISCLAIMER
LIST OF TABLES
TABLE 01.MOBILE ARTIFICIAL INTELLIGENCE (AI) MARKET, BY TECHNOLOGY NODE, 2020–2030 ($MILLION)
TABLE 02.MOBILE ARTIFICIAL INTELLIGENCE (AI) MARKET FOR 20–28NM, BY REGION, 2020–2030 ($MILLION)
TABLE 03.MOBILE ARTIFICIAL INTELLIGENCE (AI) MARKET FOR 10NM, BY REGION, 2020–2030 ($MILLION)
TABLE 04.MOBILE ARTIFICIAL INTELLIGENCE (AI) MARKET FOR 7NM, BY REGION, 2020–2030 ($MILLION)
TABLE 05.MOBILE ARTIFICIAL INTELLIGENCE (AI) MARKET FOR OTHERS, BY REGION, 2020–2030 ($MILLION)
TABLE 06.MOBILE ARTIFICIAL INTELLIGENCE (AI) MARKET, BY COMPONENT, 2020–2030 ($MILLION)
TABLE 07.MOBILE ARTIFICIAL INTELLIGENCE (AI) MARKET FOR HARDWARE, BY REGION, 2020–2030 ($MILLION)
TABLE 08.MOBILE ARTIFICIAL INTELLIGENCE (AI) MARKET FOR SOFTWARE, BY REGION, 2020–2030($MILLION)
TABLE 09.MOBILE ARTIFICIAL INTELLIGENCE (AI) MARKET FOR SERVICES, BY REGION, 2020–2030($MILLION)
TABLE 10.GLOBAL MOBILE ARTIFICIAL INTELLIGENCE (AI) MARKET, BY APPLICATION, 2020–2030 ($MILLION)
TABLE 11.MOBILE ARTIFICIAL INTELLIGENCE (AI) MARKET FOR SMARTPHONES, BY REGION, 2020–2030 ($MILLION)
TABLE 12.MOBILE ARTIFICIAL INTELLIGENCE (AI) MARKET FOR CAMERAS, BY REGION, 2020–2030 ($MILLION)
TABLE 13.MOBILE ARTIFICIAL INTELLIGENCE (AI) MARKET FOR DRONES, BY REGION, 2020–2030 ($MILLION)
TABLE 14.MOBILE ARTIFICIAL INTELLIGENCE (AI) MARKET FOR AUTOMOTIVE, BY REGION, 2020–2030 ($MILLION)
TABLE 15.MOBILE ARTIFICIAL INTELLIGENCE (AI) MARKET FOR ROBOTICS, BY REGION, 2020–2030 ($MILLION)
TABLE 16.MOBILE ARTIFICIAL INTELLIGENCE (AI) MARKET FOR AR/ VR, BY REGION, 2020–2030 ($MILLION)
TABLE 17.MOBILE ARTIFICIAL INTELLIGENCE (AI) MARKET FOR OTHERS, BY REGION, 2020–2030 ($MILLION)
TABLE 18.MOBILE ARTIFICIAL INTELLIGENCE (AI) MARKET REVENUE, BY REGION, 2020–2030 ($MILLION)
TABLE 19.NORTH AMERICA MOBILE ARTIFICIAL INTELLIGENCE (AI) MARKET, BY TECHNOLOGY NODE, 2020–2030 ($MILLION)
TABLE 20.NORTH AMERICA MOBILE ARTIFICIAL INTELLIGENCE (AI) MARKET, BY COMPONENT, 2020–2030 ($MILLION)
TABLE 21.NORTH AMERICA MOBILE ARTIFICIAL INTELLIGENCE (AI) MARKET, BY APPLICATION, 2020–2030 ($MILLION)
TABLE 22.U.S. MOBILE ARTIFICIAL INTELLIGENCE (AI) MARKET, BY TECHNOLOGY NODE, 2020–2030 ($MILLION)
TABLE 23.U.S. MOBILE ARTIFICIAL INTELLIGENCE (AI) MARKET, BY COMPONENT, 2020–2030 ($MILLION)
TABLE 24.U.S. MOBILE ARTIFICIAL INTELLIGENCE (AI) MARKET, BY APPLICATION, 2020–2030 ($MILLION)
TABLE 25.CANADA MOBILE ARTIFICIAL INTELLIGENCE (AI) MARKET, BY TECHNOLOGY NODE, 2020–2030 ($MILLION)
TABLE 26.CANADA MOBILE ARTIFICIAL INTELLIGENCE (AI) MARKET, BY COMPONENT, 2020–2030 ($MILLION)
TABLE 27.CANADA MOBILE ARTIFICIAL INTELLIGENCE (AI) MARKET, BY APPLICATION, 2020–2030 ($MILLION)
TABLE 28.MEXICO MOBILE ARTIFICIAL INTELLIGENCE (AI) MARKET, BY TECHNOLOGY NODE, 2020–2030 ($MILLION)
TABLE 29.MEXICO MOBILE ARTIFICIAL INTELLIGENCE (AI) MARKET, BY COMPONENT, 2020–2030 ($MILLION)
TABLE 30.MEXICO MOBILE ARTIFICIAL INTELLIGENCE (AI) MARKET, BY APPLICATION, 2020–2030 ($MILLION)
TABLE 31.EUROPE MOBILE ARTIFICIAL INTELLIGENCE (AI) MARKET, BY TECHNOLOGY NODE, 2020–2030 ($MILLION)
TABLE 32.EUROPE MOBILE ARTIFICIAL INTELLIGENCE (AI) MARKET, BY COMPONENT, 2020–2030 ($MILLION)
TABLE 33.EUROPE MOBILE ARTIFICIAL INTELLIGENCE (AI) MARKET, BY APPLICATION, 2020–2030 ($MILLION)
TABLE 34.UK MOBILE ARTIFICIAL INTELLIGENCE (AI) MARKET, BY TECHNOLOGY NODE, 2020–2030 ($MILLION)
TABLE 35.UK MOBILE ARTIFICIAL INTELLIGENCE (AI) MARKET, BY COMPONENT, 2020–2030 ($MILLION)
TABLE 36.UK MOBILE ARTIFICIAL INTELLIGENCE (AI) MARKET, BY APPLICATION, 2020–2030 ($MILLION)
TABLE 37.GERMANY MOBILE ARTIFICIAL INTELLIGENCE (AI) MARKET, BY TECHNOLOGY NODE, 2020–2030 ($MILLION)
TABLE 38.GERMANY MOBILE ARTIFICIAL INTELLIGENCE (AI) MARKET, BY COMPONENT, 2020–2030 ($MILLION)
TABLE 39.GERMANY MOBILE ARTIFICIAL INTELLIGENCE (AI) MARKET, BY APPLICATION, 2020–2030 ($MILLION)
TABLE 40.FRANCE MOBILE ARTIFICIAL INTELLIGENCE (AI) MARKET, BY TECHNOLOGY NODE, 2020–2030 ($MILLION)
TABLE 41.FRANCE MOBILE ARTIFICIAL INTELLIGENCE (AI) MARKET, BY COMPONENT, 2020–2030 ($MILLION)
TABLE 42.FRANCE MOBILE ARTIFICIAL INTELLIGENCE (AI) MARKET, BY APPLICATION, 2020–2030 ($MILLION)
TABLE 43.ITALY MOBILE ARTIFICIAL INTELLIGENCE (AI) MARKET, BY TECHNOLOGY NODE, 2020–2030 ($MILLION)
TABLE 44.ITALY MOBILE ARTIFICIAL INTELLIGENCE (AI) MARKET, BY COMPONENT, 2020–2030 ($MILLION)
TABLE 45.ITALY MOBILE ARTIFICIAL INTELLIGENCE (AI) MARKET, BY APPLICATION, 2020–2030 ($MILLION)
TABLE 46.REST OF EUROPE MOBILE ARTIFICIAL INTELLIGENCE (AI) MARKET, BY TECHNOLOGY NODE, 2020–2030 ($MILLION)
TABLE 47.REST OF EUROPE MOBILE ARTIFICIAL INTELLIGENCE (AI) MARKET, BY COMPONENT, 2020–2030 ($MILLION)
TABLE 48.REST OF EUROPE MOBILE ARTIFICIAL INTELLIGENCE (AI) MARKET, BY APPLICATION, 2020–2030 ($MILLION)
TABLE 49.ASIA-PACIFIC MOBILE ARTIFICIAL INTELLIGENCE (AI) MARKET, BY TECHNOLOGY NODE, 2020–2030 ($MILLION)
TABLE 50.ASIA-PACIFIC MOBILE ARTIFICIAL INTELLIGENCE (AI) MARKET, BY COMPONENT, 2020–2030 ($MILLION)
TABLE 51.ASIA-PACIFIC MOBILE ARTIFICIAL INTELLIGENCE (AI) MARKET, BY APPLICATION, 2020–2030 ($MILLION)
TABLE 52.CHINA MOBILE ARTIFICIAL INTELLIGENCE (AI) MARKET, BY TECHNOLOGY NODE, 2020–2030 ($MILLION)
TABLE 53.CHINA MOBILE ARTIFICIAL INTELLIGENCE (AI) MARKET, BY COMPONENT, 2020–2030 ($MILLION)
TABLE 54.CHINA MOBILE ARTIFICIAL INTELLIGENCE (AI) MARKET, BY APPLICATION, 2020–2030 ($MILLION)
TABLE 55.JAPAN MOBILE ARTIFICIAL INTELLIGENCE (AI) MARKET, BY TECHNOLOGY NODE, 2020–2030 ($MILLION)
TABLE 56.JAPAN MOBILE ARTIFICIAL INTELLIGENCE (AI) MARKET, BY COMPONENT, 2020–2030 ($MILLION)
TABLE 57.JAPAN MOBILE ARTIFICIAL INTELLIGENCE (AI) MARKET, BY APPLICATION, 2020–2030 ($MILLION)
TABLE 58.INDIA MOBILE ARTIFICIAL INTELLIGENCE (AI) MARKET, BY TECHNOLOGY NODE, 2020–2030 ($MILLION)
TABLE 59.INDIA MOBILE ARTIFICIAL INTELLIGENCE (AI) MARKET, BY COMPONENT, 2020–2030 ($MILLION)
TABLE 60.INDIA MOBILE ARTIFICIAL INTELLIGENCE (AI) MARKET, BY APPLICATION, 2020–2030 ($MILLION)
TABLE 61.SOUTH KOREA MOBILE ARTIFICIAL INTELLIGENCE (AI) MARKET, BY TECHNOLOGY NODE, 2020–2030 ($MILLION)
TABLE 62.SOUTH KOREA MOBILE ARTIFICIAL INTELLIGENCE (AI) MARKET, BY COMPONENT, 2020–2030 ($MILLION)
TABLE 63.SOUTH KOREA MOBILE ARTIFICIAL INTELLIGENCE (AI) MARKET, BY APPLICATION, 2020–2030 ($MILLION)
TABLE 64.TAIWAN MOBILE ARTIFICIAL INTELLIGENCE (AI) MARKET, BY TECHNOLOGY NODE, 2020–2030 ($MILLION)
TABLE 65.TAIWAN MOBILE ARTIFICIAL INTELLIGENCE (AI) MARKET, BY COMPONENT, 2020–2030 ($MILLION)
TABLE 66.TAIWAN MOBILE ARTIFICIAL INTELLIGENCE (AI) MARKET, BY APPLICATION, 2020–2030 ($MILLION)
TABLE 67.REST OF ASIA-PACIFIC MOBILE ARTIFICIAL INTELLIGENCE (AI) MARKET, BY TECHNOLOGY NODE, 2020–2030 ($MILLION)
TABLE 68.REST OF ASIA-PACIFIC MOBILE ARTIFICIAL INTELLIGENCE (AI) MARKET, BY COMPONENT, 2020–2030 ($MILLION)
TABLE 69.REST OF ASIA-PACIFIC MOBILE ARTIFICIAL INTELLIGENCE (AI) MARKET, BY APPLICATION, 2020–2030 ($MILLION)
TABLE 70.LAMEA MOBILE ARTIFICIAL INTELLIGENCE (AI) MARKET, BY TECHNOLOGY NODE, 2020–2030 ($MILLION)
TABLE 71.LAMEA MOBILE ARTIFICIAL INTELLIGENCE (AI) MARKET, BY COMPONENT, 2020–2030 ($MILLION)
TABLE 72.LAMEA MOBILE ARTIFICIAL INTELLIGENCE (AI) MARKET, BY APPLICATION, 2020–2030 ($MILLION)
TABLE 73.LATIN AMERICA MOBILE ARTIFICIAL INTELLIGENCE (AI) MARKET, BY TECHNOLOGY NODE, 2020–2030 ($MILLION)
TABLE 74.LATIN AMERICA MOBILE ARTIFICIAL INTELLIGENCE (AI) MARKET, BY COMPONENT, 2020–2030 ($MILLION)
TABLE 75.LATIN AMERICA MOBILE ARTIFICIAL INTELLIGENCE (AI) MARKET, BY APPLICATION, 2020–2030 ($MILLION)
TABLE 76.MIDDLE EAST MOBILE ARTIFICIAL INTELLIGENCE (AI) MARKET, BY TECHNOLOGY NODE, 2020–2030 ($MILLION)
TABLE 77.MIDDLE EAST MOBILE ARTIFICIAL INTELLIGENCE (AI) MARKET, BY COMPONENT, 2020–2030 ($MILLION)
TABLE 78.MIDDLE EAST MOBILE ARTIFICIAL INTELLIGENCE (AI) MARKET, BY APPLICATION, 2020–2030 ($MILLION)
TABLE 79.AFRICA MOBILE ARTIFICIAL INTELLIGENCE (AI) MARKET, BY TECHNOLOGY NODE, 2020–2030 ($MILLION)
TABLE 80.AFRICA MOBILE ARTIFICIAL INTELLIGENCE (AI) MARKET, BY COMPONENT, 2020–2030 ($MILLION)
TABLE 81.AFRICA MOBILE ARTIFICIAL INTELLIGENCE (AI) MARKET, BY APPLICATION, 2020–2030 ($MILLION)
TABLE 82.APPLE INC.:KEY EXECUTIVES
TABLE 83.APPLE INC.: COMPANY SNAPSHOT
TABLE 84.APPLE INC.: OPERATING SEGMENTS
TABLE 85.APPLE INC.: PRODUCT PORTFOLIO
TABLE 86.APPLE INC.: KEY STRATEGIC MOVES AND DEVELOPMENTS
TABLE 87.MICROSOFT CORPORATION: KEY EXECUTIVES
TABLE 88.MICROSOFT CORPORATION: COMPANY SNAPSHOT
TABLE 89.MICROSOFT CORPORATION: OPERATING SEGMENTS
TABLE 90.MICROSOFT CORPORATION: PRODUCT PORTFOLIO
TABLE 91.INTEL CORPORATION: KEY EXECUTIVES
TABLE 92.INTEL CORPORATION: COMPANY SNAPSHOT
TABLE 93.INTEL CORPORATION: OPERATING SEGMENTS
TABLE 94.INTEL CORPORATION: PRODUCT PORTFOLIO
TABLE 95.INTEL CORPORATION: KEY STRATEGIC MOVES AND DEVELOPMENTS
TABLE 96.GOOGLE LLC (ALPHABET INC.):KEY EXECUTIVES
TABLE 97.GOOGLE LLC (ALPHABET INC.): COMPANY SNAPSHOT
TABLE 98.GOOGLE LLC (ALPHABET INC.): OPERATING SEGMENTS
TABLE 99.GOOGLE LLC (ALPHABET INC.): PRODUCT PORTFOLIO
TABLE 100.GOOGLE LLC (ALPHABET INC.): KEY STRATEGIC MOVES AND DEVELOPMENTS
TABLE 101.HUAWEI TECHNOLOGIES CO., LTD.:KEY EXECUTIVES
TABLE 102.HUAWEI TECHNOLOGIES CO., LTD.: COMPANY SNAPSHOT
TABLE 103.HUAWEI TECHNOLOGIES CO., LTD.: OPERATING SEGMENTS
TABLE 104.HUAWEI TECHNOLOGIES CO., LTD.: PRODUCT PORTFOLIO
TABLE 105.HUAWEI TECHNOLOGIES CO., LTD.: KEY STRATEGIC MOVES AND DEVELOPMENTS
TABLE 106.INTERNATIONAL BUSINESS MANAGEMENT CORPORATION (IBM): KEY EXECUTIVES
TABLE 107.INTERNATIONAL BUSINESS MACHINES CORPORATION (IBM): COMPANY SNAPSHOT
TABLE 108.INTERNATIONAL BUSINESS MACHINES CORPORATION (IBM): OPERATING SEGMENTS
TABLE 109.INTERNATIONAL BUSINESS MACHINES CORPORATION (IBM): PRODUCT PORTFOLIO
TABLE 110.INTERNATIONAL BUSINESS MACHINES CORPORATION (IBM): KEY STRATEGIC MOVES AND DEVELOPMENTS
TABLE 111.SAMSUNG ELECTRONICS:KEY EXECUTIVES
TABLE 112.SAMSUNG ELECTRONICS: COMPANY SNAPSHOT
TABLE 113.SAMSUNG ELECTRONICS: OPERATING SEGMENTS
TABLE 114.SAMSUNG ELECTRONICS: PRODUCT PORTFOLIO
TABLE 115.SAMSUNG ELECTRONICS: KEY STRATEGIC MOVES AND DEVELOPMENTS
TABLE 116.QUALCOMM TECHNOLOGIES, INC.:KEY EXECUTIVES
TABLE 117.QUALCOMM TECHNOLOGIES, INC.: COMPANY SNAPSHOT
TABLE 118.QUALCOMM TECHNOLOGIES, INC.: OPERATING SEGMENTS
TABLE 119.QUALCOMM TECHNOLOGIES, INC.: PRODUCT PORTFOLIO
TABLE 120.QUALCOMM TECHNOLOGIES, INC.: KEY STRATEGIC MOVES AND DEVELOPMENTS
TABLE 121.MEDIATEK: COMPANY SNAPSHOT
TABLE 122.MEDIATEK: PRODUCT PORTFOLIO
TABLE 123.NVIDIA CORPORATION: COMPANY SNAPSHOT
TABLE 124.NVIDIA CORPORATION.: OPERATING SEGMENTS
TABLE 125.NVIDIA CORPORATION: PRODUCT PORTFOLIO
LIST OF FIGURES
FIGURE 01.SEGMENT INFORMATION
FIGURE 02.EXECUTIVE SUMMARY
FIGURE 03.EXECUTIVE SUMMARY
FIGURE 04.TOP IMPACTING FACTORS
FIGURE 05.TOP INVESTMENT POCKETS
FIGURE 06.MODERATE TO HIGH BARGAINING POWER OF SUPPLIERS
FIGURE 07.MODERATE TO HIGH THREAT OF NEW ENTRANTS
FIGURE 08.MODERATE TO HIGH THREAT OF SUBSTITUTES
FIGURE 09.MODERATE INTENSITY OF RIVALRY
FIGURE 10.MODERATE TO HIGH BARGAINING POWER OF BUYERS
FIGURE 11.PATENT ANALYSIS, BY COUNTRY
FIGURE 12.PATENT ANALYSIS, BY APPLICANT
FIGURE 13.MOBILE ARTIFICIAL INTELLIGENCE (AI) MARKET, BY TECHNOLOGY NODE, 2020–2030
FIGURE 14.COMPARATIVE SHARE ANALYSIS OF MOBILE ARTIFICIAL INTELLIGENCE (AI) MARKET FOR 20–28NM, BY COUNTRY, 2020 & 2030 (%)
FIGURE 15.COMPARATIVE SHARE ANALYSIS OF MOBILE ARTIFICIAL INTELLIGENCE (AI) MARKET FOR 10NM, BY COUNTRY, 2020 & 2030 (%)
FIGURE 16.COMPARATIVE SHARE ANALYSIS OF MOBILE ARTIFICIAL INTELLIGENCE (AI) MARKET FOR 7NM, BY COUNTRY, 2020 & 2030 (%)
FIGURE 17.COMPARATIVE SHARE ANALYSIS OF MOBILE ARTIFICIAL INTELLIGENCE (AI) MARKET FOR OTHERS, BY COUNTRY, 2020 & 2030 (%)
FIGURE 18.MOBILE ARTIFICIAL INTELLIGENCE (AI) MARKET, BY COMPONENT, 2020–2030
FIGURE 19.COMPARATIVE SHARE ANALYSIS OF MOBILE ARTIFICIAL INTELLIGENCE (AI) MARKET FOR HARDWARE, BY COUNTRY, 2020 & 2030 (%)
FIGURE 20.COMPARATIVE SHARE ANALYSIS OF MOBILE ARTIFICIAL INTELLIGENCE (AI) MARKET FOR SOFTWARE, BY COUNTRY, 2020 & 2030 (%)
FIGURE 21.COMPARATIVE SHARE ANALYSIS OF MOBILE ARTIFICIAL INTELLIGENCE (AI) MARKET FOR SERVICES, BY COUNTRY, 2020 & 2030 (%)
FIGURE 22.GLOBAL MOBILE ARTIFICIAL INTELLIGENCE (AI) MARKET, BY APPLICATION, 2020–2030
FIGURE 23.COMPARATIVE SHARE ANALYSIS OF MOBILE ARTIFICIAL INTELLIGENCE (AI) MARKET FOR SMARTPHONES, BY COUNTRY, 2020 & 2030 (%)
FIGURE 24.COMPARATIVE SHARE ANALYSIS OF MOBILE ARTIFICIAL INTELLIGENCE (AI) MARKET FOR CAMERAS, BY COUNTRY, 2020 & 2030 (%)
FIGURE 25.COMPARATIVE SHARE ANALYSIS OF MOBILE ARTIFICIAL INTELLIGENCE (AI) MARKET FOR DRONES, BY COUNTRY, 2020 & 2030 (%)
FIGURE 26.COMPARATIVE SHARE ANALYSIS OF MOBILE ARTIFICIAL INTELLIGENCE (AI) MARKET FOR AUTOMOTIVE, BY COUNTRY, 2020 & 2030 (%)
FIGURE 27.COMPARATIVE SHARE ANALYSIS OF MOBILE ARTIFICIAL INTELLIGENCE (AI) MARKET FOR ROBOTICS, BY COUNTRY, 2020 & 2030 (%)
FIGURE 28.COMPARATIVE SHARE ANALYSIS OF MOBILE ARTIFICIAL INTELLIGENCE (AI) MARKET FOR AR/ VR, BY COUNTRY, 2020 & 2030 (%)
FIGURE 29.COMPARATIVE SHARE ANALYSIS OF MOBILE ARTIFICIAL INTELLIGENCE (AI) MARKET FOR OTHERS, BY COUNTRY, 2020 & 2030 (%)
FIGURE 30.MOBILE ARTIFICIAL INTELLIGENCE (AI) MARKET, BY REGION, 2020-2030 (%)
FIGURE 31.COMPARATIVE SHARE ANALYSIS OF NORTH AMERICA MOBILE ARTIFICIAL INTELLIGENCE (AI) MARKET, BY COUNTRY, 2020–2030 (%)
FIGURE 32.U.S. MOBILE ARTIFICIAL INTELLIGENCE (AI) MARKET, 2020–2030 ($MILLION)
FIGURE 33.CANADA MOBILE ARTIFICIAL INTELLIGENCE (AI) MARKET, 2020–2030 ($MILLION)
FIGURE 34.MEXICO MOBILE ARTIFICIAL INTELLIGENCE (AI) MARKET, 2020–2030 ($MILLION)
FIGURE 35.COMPARATIVE SHARE ANALYSIS OF EUROPE MOBILE ARTIFICIAL INTELLIGENCE (AI) MARKET, BY COUNTRY, 2020–2030 (%)
FIGURE 36.UK MOBILE ARTIFICIAL INTELLIGENCE (AI) MARKET, 2020–2030 ($MILLION)
FIGURE 37.GERMANY MOBILE ARTIFICIAL INTELLIGENCE (AI) MARKET, 2020–2030 ($MILLION)
FIGURE 38.FRANCE MOBILE ARTIFICIAL INTELLIGENCE (AI) MARKET, 2020–2030 ($MILLION)
FIGURE 39.ITALY MOBILE ARTIFICIAL INTELLIGENCE (AI) MARKET, 2020–2030 ($MILLION)
FIGURE 40.REST OF EUROPE MOBILE ARTIFICIAL INTELLIGENCE (AI) MARKET, 2020–2030 ($MILLION)
FIGURE 41.COMPARATIVE SHARE ANALYSIS OF ASIA-PACIFIC MOBILE ARTIFICIAL INTELLIGENCE (AI) MARKET, BY COUNTRY, 2020–2030 (%)
FIGURE 42.CHINA MOBILE ARTIFICIAL INTELLIGENCE (AI) MARKET, 2020–2030 ($MILLION)
FIGURE 43.JAPAN MOBILE ARTIFICIAL INTELLIGENCE (AI) MARKET, 2020–2030 ($MILLION)
FIGURE 44.INDIA MOBILE ARTIFICIAL INTELLIGENCE (AI) MARKET, 2020–2030 ($MILLION)
FIGURE 45.SOUTH KOREA MOBILE ARTIFICIAL INTELLIGENCE (AI) MARKET, 2020–2030 ($MILLION)
FIGURE 46.TAIWAN MOBILE ARTIFICIAL INTELLIGENCE (AI) MARKET, 2020–2030 ($MILLION)
FIGURE 47.REST OF ASIA-PACIFIC MOBILE ARTIFICIAL INTELLIGENCE (AI) MARKET, 2020–2030 ($MILLION)
FIGURE 48.COMPARATIVE SHARE ANALYSIS OF LAMEA MOBILE ARTIFICIAL INTELLIGENCE (AI) MARKET, BY COUNTRY, 2020–2030 (%)
FIGURE 49.LATIN AMERICA MOBILE ARTIFICIAL INTELLIGENCE (AI) MARKET, 2020–2030 ($MILLION)
FIGURE 50.MIDDLE EAST MOBILE ARTIFICIAL INTELLIGENCE (AI) MARKET, 2020–2030 ($MILLION)
FIGURE 51.AFRICA MOBILE ARTIFICIAL INTELLIGENCE (AI) MARKET, 2020–2030 ($MILLION)
FIGURE 52.MARKET PLAYER POSITIONING, 2020
FIGURE 53.TOP WINNING STRATEGIES, BY YEAR, 2018–2021
FIGURE 54.TOP WINNING STRATEGIES, BY YEAR, 2018–2021
FIGURE 55.TOP WINNING STRATEGIES, BY COMPANY, 2018–2021
FIGURE 56.APPLE INC.: R&D EXPENDITURE, 2018–2020 ($MILLION)
FIGURE 57.APPLE INC.: REVENUE, 2018–2020 ($MILLION)
FIGURE 58.APPLE INC.: REVENUE SHARE, BY SEGMENT, 2020 (%)
FIGURE 59.APPLE INC.: REVENUE SHARE, BY REGION, 2020 (%)
FIGURE 60.R&D EXPENDITURE, 2018–2020 ($MILLION)
FIGURE 61.MICROSOFT CORPORATION: REVENUE, 2018–2020 ($MILLION)
FIGURE 62.MICROSOFT CORPORATION: REVENUE SHARE BY SEGMENT, 2020 (%)
FIGURE 63.MICROSOFT CORPORATION: REVENUE SHARE BY REGION, 2020 (%)
FIGURE 64.INTEL CORPORATION: R&D EXPENDITURE, 2018–2020 ($MILLION)
FIGURE 65.INTEL CORPORATION: REVENUE, 2018–2020 ($MILLION)
FIGURE 66.INTEL CORPORATION: REVENUE SHARE, BY SEGMENT, 2020 (%)
FIGURE 67.INTEL CORPORATION: REVENUE SHARE, BY REGION, 2020 (%)
FIGURE 68.GOOGLE LLC (ALPHABET INC.): R&D EXPENDITURE, 2018–2020 ($MILLION)
FIGURE 69.GOOGLE LLC (ALPHABET INC.): NET SALES, 2018–2020 ($MILLION)
FIGURE 70.GOOGLE LLC (ALPHABET INC.): REVENUE SHARE BY SEGMENT, 2020 (%)
FIGURE 71.GOOGLE LLC (ALPHABET INC.): REVENUE SHARE, BY REGION, 2020 (%)
FIGURE 72.HUAWEI TECHNOLOGIES CO., LTD.: R&D EXPENDITURE, 2018–2020 ($MILLION)
FIGURE 73.HUAWEI TECHNOLOGIES CO., LTD.: REVENUE, 2018–2020 ($MILLION)
FIGURE 74.HUAWEI TECHNOLOGIES CO., LTD.: REVENUE SHARE, BY SEGMENT, 2020 (%)
FIGURE 75.HUAWEI TECHNOLOGIES CO., LTD.: REVENUE SHARE, BY REGION, 2020 (%)
FIGURE 76.INTERNATIONAL BUSINESS MACHINES CORPORATION (IBM): R&D EXPENDITURE, 2018–2020 ($MILLION)
FIGURE 77.INTERNATIONAL BUSINESS MACHINES CORPORATION (IBM): REVENUE, 2018–2020 ($MILLION)
FIGURE 78.INTERNATIONAL BUSINESS MACHINES CORPORATION (IBM): REVENUE SHARE, BY SEGMENT, 2020 (%)
FIGURE 79.INTERNATIONAL BUSINESS MACHINES CORPORATION (IBM): REVENUE SHARE, BY REGION, 2020 (%)
FIGURE 80.SAMSUNG ELECTRONICS: R&D EXPENDITURE, 2018–2020 ($MILLION)
FIGURE 81.SAMSUNG ELECTRONICS: NET SALES, 2018–2020 ($MILLION)
FIGURE 82.SAMSUNG ELECTRONICS: REVENUE SHARE, BY SEGMENT, 2020 (%)
FIGURE 83.SAMSUNG ELECTRONICS: REVENUE SHARE, BY REGION, 2020 (%)
FIGURE 84.QUALCOMM TECHNOLOGIES, INC.: R&D EXPENDITURE, 2018–2020 ($MILLION)
FIGURE 85.QUALCOMM TECHNOLOGIES, INC.: REVENUE, 2018–2020 ($MILLION)
FIGURE 86.QUALCOMM TECHNOLOGIES, INC.: REVENUE SHARE, BY SEGMENT, 2020 (%)
FIGURE 87.QUALCOMM TECHNOLOGIES, INC.: REVENUE SHARE, BY REGION, 2020 (%)
FIGURE 88.MEDIATEK: NET SALES, 2017–2019 ($MILLION)
FIGURE 89.MEDIATEK: REVENUE SHARE BY REGION, 2019 (%)
FIGURE 90.INTERNATIONAL BUSINESS MACHINES CORPORATION (IBM): R&D EXPENDITURE, 2018–2020 ($MILLION)
FIGURE 91.NVIDIA CORPORATION: NET SALES, 2018–2020 ($MILLION)
FIGURE 92.NVIDIA: REVENUE SHARE BY SEGMENT, 2020 (%)
FIGURE 93.NVIDIA: REVENUE SHARE BY REGION,2020 (%)
According to the insights of the CXOs of leading companies, the mobile artificial intelligence (AI) market holds high potential in smartphone industry. The current business scenario experiences rapid development in artificial intelligence technology and mobile industry, particularly in the developed and developing regions such as North America, Asia-Pacific, and Europe. Companies in this industry adopt various innovative techniques to provide customers with advanced and innovative features.
The mobile artificial intelligence (AI) market trends have been analyzed across North America, Europe, Asia-Pacific, and LAMEA. The analysis had identified that North America contributed maximum revenue in 2020. The report focuses on the growth prospects, restraints, and trends of the mobile artificial intelligence (AI) market analysis. The study provides Porter’s five forces analysis to understand the impact of various factors, such as bargaining power of suppliers, competitive intensity of competitors, threat of new entrants, threat of substitutes, and bargaining power of buyers, in the mobile artificial intelligence (AI) market.
The key players of the market such as Google, Apple Inc., IBM Corporation, and Intel Corporation, focus on introducing technologically advanced products to remain competitive in the market. Product launch, agreement, collaboration, and partnership are expected to be the prominent strategies adopted by the market players.
Start reading instantly.
This Report and over 67,132+ more Reports, Available with Avenue Library. T&C*.
Enterprise
License/PDF
Library
Membership
*Taxes/Fees, if applicable will be added during checkout. All prices in USD
To ensure high-level data integrity, accurate analysis, and impeccable forecasts
For complete satisfaction
On-demand customization of scope of the report to exactly meet your needs
Targeted market view to provide pertinent information and save time of readers
Get insights on topics that are crucial for your business. Stay abreast of your interest areas.
Get Industry Data AlertsTo ensure high-level data integrity, accurate analysis, and impeccable forecasts
For complete satisfaction
On-demand customization of scope of the report to exactly meet your needs
Targeted market view to provide pertinent information and save time of readers