0
2022
Mobile Crane Market

Mobile Crane Market

by Boom Type (Lattice Boom, Telescopic Boom), by Carrrier Type (Wheel mounted, Track mounted), by Terrain Type (On road, Rough terrain, All terrain), by End User Industry (Construction, Manufacturing, Utilities): Global Opportunity Analysis and Industry Forecast, 2021-2031

Report Code: A02954
Jun 2022 | Pages: 285
Tables: 160
Charts: 58
  • Formats*:

  • pdf

    Single User License, Five User
    License & Enterprise User License

  • xls

    Data Pack Excel License

  • ppt

    It comes with the additional cost
    of $2500.00 contact sales.


Mobile Crane Market Research, 2031

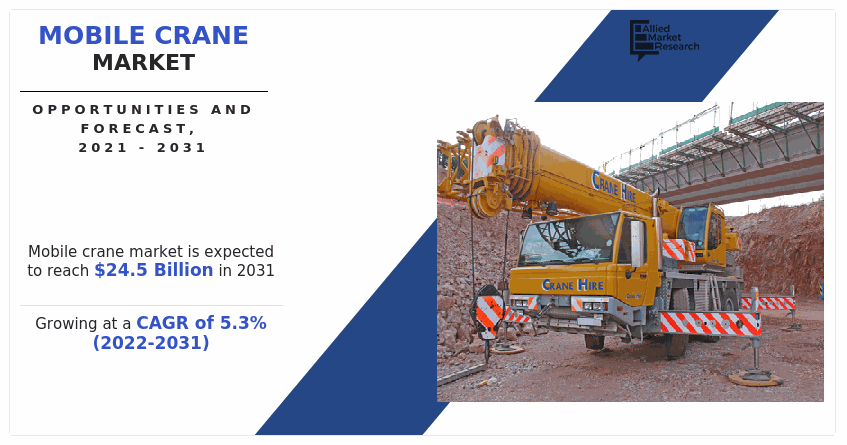
The global mobile crane market size was valued at $14.4 billion in 2021, and is projected to reach $24.5 billion by 2031, growing at a CAGR of 5.3% from 2022 to 2031. A crane is a heavy machine used for handling, lifting, and moving light and heavy loads. A mobile crane performs all the tasks of a crane, with an added feature of horizontal mobility. With different types of carriers, mobile crane can mobilize itself on any type of terrain. In addition, mobile cranes are equipped with different types of booms that enable it to perform various material lifting tasks.

The mobile crane market was hampered during the outbreak of COVID-19 pandemic, owing to restrictions on construction and manufacturing activities. In addition, mobile cranes could not be effectively manufactured during the lockdown period.

Mobile Crane Market, Mobile Crane Industry, Mobile Crane Market Size, Mobile Crane Market Share, Mobile Crane Market Growth, Mobile Crane Market Trends, Mobile Crane Market Analysis, Mobile Crane Market Forecast, Mobile Crane Market Opportunities

North America and Asia-Pacific regions spend heavily on infrastructure projects, such as roads, tunnels, railways, bridges, and metros, owing to increase in demand for efficient public transport. The manufacturing sector, which uses compact mobile cranes for material handling, is also witnessing a notable growth. In other regions, such as Africa, Europe, Middle East, and Latin America, the building and infrastructure construction sectors are witnessing a significant boom. Mobile cranes are extensively used on construction sites for lifting heavy loads, therefore; growth of the construction industry is anticipated to positively impact the mobile cranes market. Furthermore, mobile cranes have mobility in various types of terrains, such as mountainous, lose soil, and dense forests. This, increasing the usage of mobile cranes for various activities. In addition, various public-private partnerships (PPP) are being formed in countries globally, such as Mexico, India, China, Canada, and Japan for speeding up construction projects. This has led to significant inflow of money and resources towards the infrastructural development. Therefore, it is anticipated to positively influence the mobile crane market growth.

Moreover, various market players now offer cranes with longer telescopic booms that can operate at a considerably higher speed. Furthermore, incorporation of hybrid power mode technology, enables the mobile cranes to operate on oil as well as electricity.. This, is anticipated to enhance the usability of mobile cranes, thereby, positively influencing the market.

Major players in the industry have focused on development of high-performance and heavy lifting mobile cranes. For instance, in February 2021, Manitex Valla, an Italy-based manufacturer of mobile cranes, launched V110 R Electric Mobile Crane, which is a battery-operated and remote-controlled mobile crane. This equipment features a front wheel drive and a lifting capacity of up to 11 tones to a service height of 10.4 meters. Furthermore, in December 2021, XCMG, a Chinese manufacturer of mobile cranes, launched XCMG XCT25 EV, the world’s first truck crane with hybrid technology. It is a 25-ton capacity hybrid crane, which can easily switch to different operating modes that are, hybrid, pure electricity, pure oil, and plug-in.

Mobile Crane Market

The novel coronavirus rapidly spread across various countries and regions, causing an enormous impact on the lives of people and the overall community. It began as a human health condition and later became a significant threat to global trade, economy, and finance. The COVID-19 pandemic halted the production of many components of mobile cranes due to lockdown. The economic slowdown initially resulted in reduced spending on mobile cranes by the construction sector. However, owing to the introduction of various vaccines, the severity of COVID-19 pandemic has significantly reduced. As of mid-2022, the number of COVID-19 cases have diminished significantly. This has led to the full-fledged reopening of mobile cranes manufacturing companies at their full-scale capacities. Furthermore, it has been more than two years since the outbreak of this pandemic, and many companies have already shown notable signs of recovery.

Furthermore, the aftermarket support for the mobile crane industry has advanced significantly. Various companies such as Manitowoc, Liebherr, and others are developing technologies for diagnosing and predicting issues in cranes systems and scheduling maintenance. In addition, companies such as VerveTronics offers various Internet of Things (IOT) solutions for preventive and predictive maintenance technology for the mobile cranes. These systems can be integrated or retrofitted in the existing cranes. Such advancement in aftermarket is expected to incredibly enhance the service life of mobile cranes. Thereby, driving the growth of the mobile crane market.

Mobile Crane Market

The mobile crane market is segmented into Terrain Type, End User Industry, Boom Type and Carrrier Type. By boom type, the mobile crane market is bifurcated into lattice boom and telescopic boom. According to carrier type, the market is categorized into wheel mounted and track mounted. By terrain type, the market is segmented into on-road, rough terrain, and all-terrain. By end-user industry, the market is classified into construction, manufacturing, and utilities. Region-wise, the market is analyzed across North America, Europe, Asia-Pacific, and LAMEA. Asia-Pacific dominated the market in 2021, accounting for the highest mobile crane market share, and is anticipated to maintain this trend during the forecast period. This is attributed to increase in spending on infrastructural development and investment in manufacturing industry from public and private entities.

Mobile Crane Market

Competition Analysis

Key companies profiled in the mobile crane market forecast report include, Altec Inc., Cargotec Corporation, Liebherr International AG, Manitowoc Company Inc., SANY Heavy Industry Co. Ltd., Tadano Ltd., Terex Corporation, Xuzhou Construction Machinery Group Co. Ltd. (XCMG), Zoomlion Heavy Industry Science and Technology Co. Ltd., and Kobelco Construction Machinery Co., Ltd.

Key Benefits For Stakeholders

  • This report provides a quantitative analysis of the market segments, current trends, estimations, and dynamics of the mobile crane market analysis from 2021 to 2031 to identify the prevailing mobile crane market opportunities.
  • The market research is offered along with information related to key drivers, restraints, and opportunities.
  • Porter's five forces analysis highlights the potency of buyers and suppliers to enable stakeholders make profit-oriented business decisions and strengthen their supplier-buyer network.
  • In-depth analysis of the mobile crane market segmentation assists to determine the prevailing market opportunities.
  • Major countries in each region are mapped according to their revenue contribution to the global market.
  • Market player positioning facilitates benchmarking and provides a clear understanding of the present position of the market players.
  • The report includes the analysis of the regional as well as global mobile crane market trends, key players, market segments, application areas, and market growth strategies.

Mobile Crane Market Report Highlights

Aspects Details
By Terrain Type
  • On road
  • Rough terrain
  • All terrain
By End User Industry
  • Construction
  • Manufacturing
  • Utilities
By Boom Type
  • Lattice Boom
  • Telescopic Boom
By Carrrier Type
  • Wheel mounted
  • Track mounted
By Region
  • North America  (U.S., Canada, Mexico)
  • Europe  (Germany, United Kingdom, France, Italy, Rest of Europe)
  • Asia-Pacific  (China, Japan, India, South Korea, Rest Of Asia Pacific)
  • LAMEA  (Latin America, Middle East, Africa)
Key Market Players Kobelco Construction Machinery Co., Ltd., Manitowoc Company, Inc., Tadano Ltd., Liebherr-International AG, Altec, Inc., Zoomlion Heavy Industry Science and Technology Co., Ltd., Terex Corporation, SANY Heavy Industry Co. Ltd., Xuzhou Construction Machinery Group Co., Ltd., cargotec corporation
 
  • CHAPTER 1:INTRODUCTION

    • 1.1.Report description

    • 1.2.Key market segments

    • 1.3.Key benefits to the stakeholders

    • 1.4.Research Methodology

      • 1.4.1.Secondary research

      • 1.4.2.Primary research

      • 1.4.3.Analyst tools and models

  • CHAPTER 2:EXECUTIVE SUMMARY

    • 2.1.Key findings of the study

    • 2.2.CXO Perspective

  • CHAPTER 3:MARKET OVERVIEW

    • 3.1.Market definition and scope

    • 3.2.Key findings

      • 3.2.1.Top investment pockets

    • 3.3.Porter’s five forces analysis

    • 3.4.Top player positioning

    • 3.5.Market dynamics

      • 3.5.1.Drivers

      • 3.5.2.Restraints

      • 3.5.3.Opportunities

    • 3.6.COVID-19 Impact Analysis on the market

  • CHAPTER 4: MOBILE CRANE MARKET, BY BOOM TYPE

    • 4.1 Overview

      • 4.1.1 Market size and forecast

    • 4.2 Lattice Boom

      • 4.2.1 Key market trends, growth factors and opportunities

      • 4.2.2 Market size and forecast, by region

      • 4.2.3 Market analysis by country

    • 4.3 Telescopic Boom

      • 4.3.1 Key market trends, growth factors and opportunities

      • 4.3.2 Market size and forecast, by region

      • 4.3.3 Market analysis by country

  • CHAPTER 5: MOBILE CRANE MARKET, BY CARRRIER TYPE

    • 5.1 Overview

      • 5.1.1 Market size and forecast

    • 5.2 Wheel mounted

      • 5.2.1 Key market trends, growth factors and opportunities

      • 5.2.2 Market size and forecast, by region

      • 5.2.3 Market analysis by country

    • 5.3 Track mounted

      • 5.3.1 Key market trends, growth factors and opportunities

      • 5.3.2 Market size and forecast, by region

      • 5.3.3 Market analysis by country

  • CHAPTER 6: MOBILE CRANE MARKET, BY TERRAIN TYPE

    • 6.1 Overview

      • 6.1.1 Market size and forecast

    • 6.2 On road

      • 6.2.1 Key market trends, growth factors and opportunities

      • 6.2.2 Market size and forecast, by region

      • 6.2.3 Market analysis by country

    • 6.3 Rough terrain

      • 6.3.1 Key market trends, growth factors and opportunities

      • 6.3.2 Market size and forecast, by region

      • 6.3.3 Market analysis by country

    • 6.4 All terrain

      • 6.4.1 Key market trends, growth factors and opportunities

      • 6.4.2 Market size and forecast, by region

      • 6.4.3 Market analysis by country

  • CHAPTER 7: MOBILE CRANE MARKET, BY END USER INDUSTRY

    • 7.1 Overview

      • 7.1.1 Market size and forecast

    • 7.2 Construction

      • 7.2.1 Key market trends, growth factors and opportunities

      • 7.2.2 Market size and forecast, by region

      • 7.2.3 Market analysis by country

    • 7.3 Manufacturing

      • 7.3.1 Key market trends, growth factors and opportunities

      • 7.3.2 Market size and forecast, by region

      • 7.3.3 Market analysis by country

    • 7.4 Utilities

      • 7.4.1 Key market trends, growth factors and opportunities

      • 7.4.2 Market size and forecast, by region

      • 7.4.3 Market analysis by country

  • CHAPTER 8: MOBILE CRANE MARKET, BY REGION

    • 8.1 Overview

      • 8.1.1 Market size and forecast

    • 8.2 North America

      • 8.2.1 Key trends and opportunities

      • 8.2.2 North America Market size and forecast, by Boom Type

      • 8.2.3 North America Market size and forecast, by Carrrier Type

      • 8.2.4 North America Market size and forecast, by Terrain Type

      • 8.2.5 North America Market size and forecast, by End User Industry

      • 8.2.6 North America Market size and forecast, by country

        • 8.2.6.1 U.S.
          • 8.2.6.1.1 Market size and forecast, by Boom Type
          • 8.2.6.1.2 Market size and forecast, by Carrrier Type
          • 8.2.6.1.3 Market size and forecast, by Terrain Type
          • 8.2.6.1.4 Market size and forecast, by End User Industry
        • 8.2.6.2 Canada
          • 8.2.6.2.1 Market size and forecast, by Boom Type
          • 8.2.6.2.2 Market size and forecast, by Carrrier Type
          • 8.2.6.2.3 Market size and forecast, by Terrain Type
          • 8.2.6.2.4 Market size and forecast, by End User Industry
        • 8.2.6.3 Mexico
          • 8.2.6.3.1 Market size and forecast, by Boom Type
          • 8.2.6.3.2 Market size and forecast, by Carrrier Type
          • 8.2.6.3.3 Market size and forecast, by Terrain Type
          • 8.2.6.3.4 Market size and forecast, by End User Industry
    • 8.3 Europe

      • 8.3.1 Key trends and opportunities

      • 8.3.2 Europe Market size and forecast, by Boom Type

      • 8.3.3 Europe Market size and forecast, by Carrrier Type

      • 8.3.4 Europe Market size and forecast, by Terrain Type

      • 8.3.5 Europe Market size and forecast, by End User Industry

      • 8.3.6 Europe Market size and forecast, by country

        • 8.3.6.1 Germany
          • 8.3.6.1.1 Market size and forecast, by Boom Type
          • 8.3.6.1.2 Market size and forecast, by Carrrier Type
          • 8.3.6.1.3 Market size and forecast, by Terrain Type
          • 8.3.6.1.4 Market size and forecast, by End User Industry
        • 8.3.6.2 United Kingdom
          • 8.3.6.2.1 Market size and forecast, by Boom Type
          • 8.3.6.2.2 Market size and forecast, by Carrrier Type
          • 8.3.6.2.3 Market size and forecast, by Terrain Type
          • 8.3.6.2.4 Market size and forecast, by End User Industry
        • 8.3.6.3 France
          • 8.3.6.3.1 Market size and forecast, by Boom Type
          • 8.3.6.3.2 Market size and forecast, by Carrrier Type
          • 8.3.6.3.3 Market size and forecast, by Terrain Type
          • 8.3.6.3.4 Market size and forecast, by End User Industry
        • 8.3.6.4 Italy
          • 8.3.6.4.1 Market size and forecast, by Boom Type
          • 8.3.6.4.2 Market size and forecast, by Carrrier Type
          • 8.3.6.4.3 Market size and forecast, by Terrain Type
          • 8.3.6.4.4 Market size and forecast, by End User Industry
        • 8.3.6.5 Rest of Europe
          • 8.3.6.5.1 Market size and forecast, by Boom Type
          • 8.3.6.5.2 Market size and forecast, by Carrrier Type
          • 8.3.6.5.3 Market size and forecast, by Terrain Type
          • 8.3.6.5.4 Market size and forecast, by End User Industry
    • 8.4 Asia-Pacific

      • 8.4.1 Key trends and opportunities

      • 8.4.2 Asia-Pacific Market size and forecast, by Boom Type

      • 8.4.3 Asia-Pacific Market size and forecast, by Carrrier Type

      • 8.4.4 Asia-Pacific Market size and forecast, by Terrain Type

      • 8.4.5 Asia-Pacific Market size and forecast, by End User Industry

      • 8.4.6 Asia-Pacific Market size and forecast, by country

        • 8.4.6.1 China
          • 8.4.6.1.1 Market size and forecast, by Boom Type
          • 8.4.6.1.2 Market size and forecast, by Carrrier Type
          • 8.4.6.1.3 Market size and forecast, by Terrain Type
          • 8.4.6.1.4 Market size and forecast, by End User Industry
        • 8.4.6.2 Japan
          • 8.4.6.2.1 Market size and forecast, by Boom Type
          • 8.4.6.2.2 Market size and forecast, by Carrrier Type
          • 8.4.6.2.3 Market size and forecast, by Terrain Type
          • 8.4.6.2.4 Market size and forecast, by End User Industry
        • 8.4.6.3 India
          • 8.4.6.3.1 Market size and forecast, by Boom Type
          • 8.4.6.3.2 Market size and forecast, by Carrrier Type
          • 8.4.6.3.3 Market size and forecast, by Terrain Type
          • 8.4.6.3.4 Market size and forecast, by End User Industry
        • 8.4.6.4 South Korea
          • 8.4.6.4.1 Market size and forecast, by Boom Type
          • 8.4.6.4.2 Market size and forecast, by Carrrier Type
          • 8.4.6.4.3 Market size and forecast, by Terrain Type
          • 8.4.6.4.4 Market size and forecast, by End User Industry
        • 8.4.6.5 Rest Of Asia Pacific
          • 8.4.6.5.1 Market size and forecast, by Boom Type
          • 8.4.6.5.2 Market size and forecast, by Carrrier Type
          • 8.4.6.5.3 Market size and forecast, by Terrain Type
          • 8.4.6.5.4 Market size and forecast, by End User Industry
    • 8.5 LAMEA

      • 8.5.1 Key trends and opportunities

      • 8.5.2 LAMEA Market size and forecast, by Boom Type

      • 8.5.3 LAMEA Market size and forecast, by Carrrier Type

      • 8.5.4 LAMEA Market size and forecast, by Terrain Type

      • 8.5.5 LAMEA Market size and forecast, by End User Industry

      • 8.5.6 LAMEA Market size and forecast, by country

        • 8.5.6.1 Latin America
          • 8.5.6.1.1 Market size and forecast, by Boom Type
          • 8.5.6.1.2 Market size and forecast, by Carrrier Type
          • 8.5.6.1.3 Market size and forecast, by Terrain Type
          • 8.5.6.1.4 Market size and forecast, by End User Industry
        • 8.5.6.2 Middle East
          • 8.5.6.2.1 Market size and forecast, by Boom Type
          • 8.5.6.2.2 Market size and forecast, by Carrrier Type
          • 8.5.6.2.3 Market size and forecast, by Terrain Type
          • 8.5.6.2.4 Market size and forecast, by End User Industry
        • 8.5.6.3 Africa
          • 8.5.6.3.1 Market size and forecast, by Boom Type
          • 8.5.6.3.2 Market size and forecast, by Carrrier Type
          • 8.5.6.3.3 Market size and forecast, by Terrain Type
          • 8.5.6.3.4 Market size and forecast, by End User Industry
  • CHAPTER 9: COMPANY LANDSCAPE

    • 9.1. Introduction

    • 9.2. Top winning strategies

    • 9.3. Product Mapping of Top 10 Player

    • 9.4. Competitive Dashboard

    • 9.5. Competitive Heatmap

    • 9.6. Key developments

  • CHAPTER 10: COMPANY PROFILES

    • 10.1 Altec, Inc.

      • 10.1.1 Company overview

      • 10.1.2 Company snapshot

      • 10.1.3 Operating business segments

      • 10.1.4 Product portfolio

      • 10.1.5 Business performance

      • 10.1.6 Key strategic moves and developments

    • 10.2 cargotec corporation

      • 10.2.1 Company overview

      • 10.2.2 Company snapshot

      • 10.2.3 Operating business segments

      • 10.2.4 Product portfolio

      • 10.2.5 Business performance

      • 10.2.6 Key strategic moves and developments

    • 10.3 Kobelco Construction Machinery Co., Ltd.

      • 10.3.1 Company overview

      • 10.3.2 Company snapshot

      • 10.3.3 Operating business segments

      • 10.3.4 Product portfolio

      • 10.3.5 Business performance

      • 10.3.6 Key strategic moves and developments

    • 10.4 Liebherr-International AG

      • 10.4.1 Company overview

      • 10.4.2 Company snapshot

      • 10.4.3 Operating business segments

      • 10.4.4 Product portfolio

      • 10.4.5 Business performance

      • 10.4.6 Key strategic moves and developments

    • 10.5 Manitowoc Company, Inc.

      • 10.5.1 Company overview

      • 10.5.2 Company snapshot

      • 10.5.3 Operating business segments

      • 10.5.4 Product portfolio

      • 10.5.5 Business performance

      • 10.5.6 Key strategic moves and developments

    • 10.6 SANY Heavy Industry Co. Ltd.

      • 10.6.1 Company overview

      • 10.6.2 Company snapshot

      • 10.6.3 Operating business segments

      • 10.6.4 Product portfolio

      • 10.6.5 Business performance

      • 10.6.6 Key strategic moves and developments

    • 10.7 Tadano Ltd.

      • 10.7.1 Company overview

      • 10.7.2 Company snapshot

      • 10.7.3 Operating business segments

      • 10.7.4 Product portfolio

      • 10.7.5 Business performance

      • 10.7.6 Key strategic moves and developments

    • 10.8 Terex Corporation

      • 10.8.1 Company overview

      • 10.8.2 Company snapshot

      • 10.8.3 Operating business segments

      • 10.8.4 Product portfolio

      • 10.8.5 Business performance

      • 10.8.6 Key strategic moves and developments

    • 10.9 Xuzhou Construction Machinery Group Co., Ltd.

      • 10.9.1 Company overview

      • 10.9.2 Company snapshot

      • 10.9.3 Operating business segments

      • 10.9.4 Product portfolio

      • 10.9.5 Business performance

      • 10.9.6 Key strategic moves and developments

    • 10.10 Zoomlion Heavy Industry Science and Technology Co., Ltd.

      • 10.10.1 Company overview

      • 10.10.2 Company snapshot

      • 10.10.3 Operating business segments

      • 10.10.4 Product portfolio

      • 10.10.5 Business performance

      • 10.10.6 Key strategic moves and developments

  • LIST OF TABLES

  • TABLE 1. GLOBAL MOBILE CRANE MARKET, BY BOOM TYPE, 2021-2031,($MILLION)
    TABLE 49. GERMANY MOBILE CRANE MARKET, BY CARRRIER TYPE, 2021-2031,($MILLION)
    TABLE 50. GERMANY MOBILE CRANE MARKET, BY TERRAIN TYPE, 2021-2031,($MILLION)
    TABLE 51. GERMANY MOBILE CRANE MARKET, BY END USER INDUSTRY, 2021-2031,($MILLION)
    TABLE 52. UNITED KINGDOM MOBILE CRANE MARKET, BY BOOM TYPE, 2021-2031,($MILLION)
    TABLE 2. MOBILE CRANE MARKET REVENUE, FOR LATTICE BOOM, BY REGION , 2021-2031,($MILLION)
    TABLE 3. MOBILE CRANE MARKET FOR LATTICE BOOM BY COUNTRY, 2021-2031,($MILLION)
    TABLE 4. MOBILE CRANE MARKET REVENUE, FOR TELESCOPIC BOOM, BY REGION , 2021-2031,($MILLION)
    TABLE 5. MOBILE CRANE MARKET FOR TELESCOPIC BOOM BY COUNTRY, 2021-2031,($MILLION)
    TABLE 6. GLOBAL MOBILE CRANE MARKET, BY CARRRIER TYPE, 2021-2031,($MILLION)
    TABLE 7. MOBILE CRANE MARKET REVENUE, FOR WHEEL MOUNTED, BY REGION , 2021-2031,($MILLION)
    TABLE 8. MOBILE CRANE MARKET FOR WHEEL MOUNTED BY COUNTRY, 2021-2031,($MILLION)
    TABLE 9. MOBILE CRANE MARKET REVENUE, FOR TRACK MOUNTED, BY REGION , 2021-2031,($MILLION)
    TABLE 10. MOBILE CRANE MARKET FOR TRACK MOUNTED BY COUNTRY, 2021-2031,($MILLION)
    TABLE 11. GLOBAL MOBILE CRANE MARKET, BY TERRAIN TYPE, 2021-2031,($MILLION)
    TABLE 12. MOBILE CRANE MARKET REVENUE, FOR ON ROAD, BY REGION , 2021-2031,($MILLION)
    TABLE 13. MOBILE CRANE MARKET FOR ON ROAD BY COUNTRY, 2021-2031,($MILLION)
    TABLE 14. MOBILE CRANE MARKET REVENUE, FOR ROUGH TERRAIN, BY REGION , 2021-2031,($MILLION)
    TABLE 15. MOBILE CRANE MARKET FOR ROUGH TERRAIN BY COUNTRY, 2021-2031,($MILLION)
    TABLE 16. MOBILE CRANE MARKET REVENUE, FOR ALL TERRAIN, BY REGION , 2021-2031,($MILLION)
    TABLE 17. MOBILE CRANE MARKET FOR ALL TERRAIN BY COUNTRY, 2021-2031,($MILLION)
    TABLE 18. GLOBAL MOBILE CRANE MARKET, BY END USER INDUSTRY, 2021-2031,($MILLION)
    TABLE 19. MOBILE CRANE MARKET REVENUE, FOR CONSTRUCTION, BY REGION , 2021-2031,($MILLION)
    TABLE 20. MOBILE CRANE MARKET FOR CONSTRUCTION BY COUNTRY, 2021-2031,($MILLION)
    TABLE 21. MOBILE CRANE MARKET REVENUE, FOR MANUFACTURING, BY REGION , 2021-2031,($MILLION)
    TABLE 22. MOBILE CRANE MARKET FOR MANUFACTURING BY COUNTRY, 2021-2031,($MILLION)
    TABLE 23. MOBILE CRANE MARKET REVENUE, FOR UTILITIES, BY REGION , 2021-2031,($MILLION)
    TABLE 24. MOBILE CRANE MARKET FOR UTILITIES BY COUNTRY, 2021-2031,($MILLION)
    TABLE 25. MOBILE CRANE MARKET, BY REGION, 2021-2031,($MILLION)
    TABLE 26. NORTH AMERICA MOBILE CRANE MARKET, BY BOOM TYPE, 2021-2031,($MILLION)
    TABLE 27. NORTH AMERICA MOBILE CRANE MARKET, BY CARRRIER TYPE, 2021-2031,($MILLION)
    TABLE 28. NORTH AMERICA MOBILE CRANE MARKET, BY TERRAIN TYPE, 2021-2031,($MILLION)
    TABLE 29. NORTH AMERICA MOBILE CRANE MARKET, BY END USER INDUSTRY, 2021-2031,($MILLION)
    TABLE 30. NORTH AMERICA MOBILE CRANE MARKET, BY COUNTRY, 2021-2031,($MILLION)
    TABLE 31. U.S. MOBILE CRANE MARKET, BY BOOM TYPE, 2021-2031,($MILLION)
    TABLE 32. U.S. MOBILE CRANE MARKET, BY CARRRIER TYPE, 2021-2031,($MILLION)
    TABLE 33. U.S. MOBILE CRANE MARKET, BY TERRAIN TYPE, 2021-2031,($MILLION)
    TABLE 34. U.S. MOBILE CRANE MARKET, BY END USER INDUSTRY, 2021-2031,($MILLION)
    TABLE 35. CANADA MOBILE CRANE MARKET, BY BOOM TYPE, 2021-2031,($MILLION)
    TABLE 36. CANADA MOBILE CRANE MARKET, BY CARRRIER TYPE, 2021-2031,($MILLION)
    TABLE 37. CANADA MOBILE CRANE MARKET, BY TERRAIN TYPE, 2021-2031,($MILLION)
    TABLE 38. CANADA MOBILE CRANE MARKET, BY END USER INDUSTRY, 2021-2031,($MILLION)
    TABLE 39. MEXICO MOBILE CRANE MARKET, BY BOOM TYPE, 2021-2031,($MILLION)
    TABLE 40. MEXICO MOBILE CRANE MARKET, BY CARRRIER TYPE, 2021-2031,($MILLION)
    TABLE 41. MEXICO MOBILE CRANE MARKET, BY TERRAIN TYPE, 2021-2031,($MILLION)
    TABLE 42. MEXICO MOBILE CRANE MARKET, BY END USER INDUSTRY, 2021-2031,($MILLION)
    TABLE 43. EUROPE MOBILE CRANE MARKET, BY BOOM TYPE, 2021-2031,($MILLION)
    TABLE 44. EUROPE MOBILE CRANE MARKET, BY CARRRIER TYPE, 2021-2031,($MILLION)
    TABLE 45. EUROPE MOBILE CRANE MARKET, BY TERRAIN TYPE, 2021-2031,($MILLION)
    TABLE 46. EUROPE MOBILE CRANE MARKET, BY END USER INDUSTRY, 2021-2031,($MILLION)
    TABLE 47. EUROPE MOBILE CRANE MARKET, BY COUNTRY, 2021-2031,($MILLION)
    TABLE 48. GERMANY MOBILE CRANE MARKET, BY BOOM TYPE, 2021-2031,($MILLION)
    TABLE 53. UNITED KINGDOM MOBILE CRANE MARKET, BY CARRRIER TYPE, 2021-2031,($MILLION)
    TABLE 54. UNITED KINGDOM MOBILE CRANE MARKET, BY TERRAIN TYPE, 2021-2031,($MILLION)
    TABLE 55. UNITED KINGDOM MOBILE CRANE MARKET, BY END USER INDUSTRY, 2021-2031,($MILLION)
    TABLE 56. FRANCE MOBILE CRANE MARKET, BY BOOM TYPE, 2021-2031,($MILLION)
    TABLE 57. FRANCE MOBILE CRANE MARKET, BY CARRRIER TYPE, 2021-2031,($MILLION)
    TABLE 58. FRANCE MOBILE CRANE MARKET, BY TERRAIN TYPE, 2021-2031,($MILLION)
    TABLE 59. FRANCE MOBILE CRANE MARKET, BY END USER INDUSTRY, 2021-2031,($MILLION)
    TABLE 60. ITALY MOBILE CRANE MARKET, BY BOOM TYPE, 2021-2031,($MILLION)
    TABLE 61. ITALY MOBILE CRANE MARKET, BY CARRRIER TYPE, 2021-2031,($MILLION)
    TABLE 62. ITALY MOBILE CRANE MARKET, BY TERRAIN TYPE, 2021-2031,($MILLION)
    TABLE 63. ITALY MOBILE CRANE MARKET, BY END USER INDUSTRY, 2021-2031,($MILLION)
    TABLE 64. REST OF EUROPE MOBILE CRANE MARKET, BY BOOM TYPE, 2021-2031,($MILLION)
    TABLE 65. REST OF EUROPE MOBILE CRANE MARKET, BY CARRRIER TYPE, 2021-2031,($MILLION)
    TABLE 66. REST OF EUROPE MOBILE CRANE MARKET, BY TERRAIN TYPE, 2021-2031,($MILLION)
    TABLE 67. REST OF EUROPE MOBILE CRANE MARKET, BY END USER INDUSTRY, 2021-2031,($MILLION)
    TABLE 68. ASIA-PACIFIC MOBILE CRANE MARKET, BY BOOM TYPE, 2021-2031,($MILLION)
    TABLE 69. ASIA-PACIFIC MOBILE CRANE MARKET, BY CARRRIER TYPE, 2021-2031,($MILLION)
    TABLE 70. ASIA-PACIFIC MOBILE CRANE MARKET, BY TERRAIN TYPE, 2021-2031,($MILLION)
    TABLE 71. ASIA-PACIFIC MOBILE CRANE MARKET, BY END USER INDUSTRY, 2021-2031,($MILLION)
    TABLE 72. ASIA-PACIFIC MOBILE CRANE MARKET, BY COUNTRY, 2021-2031,($MILLION)
    TABLE 73. CHINA MOBILE CRANE MARKET, BY BOOM TYPE, 2021-2031,($MILLION)
    TABLE 74. CHINA MOBILE CRANE MARKET, BY CARRRIER TYPE, 2021-2031,($MILLION)
    TABLE 75. CHINA MOBILE CRANE MARKET, BY TERRAIN TYPE, 2021-2031,($MILLION)
    TABLE 76. CHINA MOBILE CRANE MARKET, BY END USER INDUSTRY, 2021-2031,($MILLION)
    TABLE 77. JAPAN MOBILE CRANE MARKET, BY BOOM TYPE, 2021-2031,($MILLION)
    TABLE 78. JAPAN MOBILE CRANE MARKET, BY CARRRIER TYPE, 2021-2031,($MILLION)
    TABLE 79. JAPAN MOBILE CRANE MARKET, BY TERRAIN TYPE, 2021-2031,($MILLION)
    TABLE 80. JAPAN MOBILE CRANE MARKET, BY END USER INDUSTRY, 2021-2031,($MILLION)
    TABLE 81. INDIA MOBILE CRANE MARKET, BY BOOM TYPE, 2021-2031,($MILLION)
    TABLE 82. INDIA MOBILE CRANE MARKET, BY CARRRIER TYPE, 2021-2031,($MILLION)
    TABLE 83. INDIA MOBILE CRANE MARKET, BY TERRAIN TYPE, 2021-2031,($MILLION)
    TABLE 84. INDIA MOBILE CRANE MARKET, BY END USER INDUSTRY, 2021-2031,($MILLION)
    TABLE 85. SOUTH KOREA MOBILE CRANE MARKET, BY BOOM TYPE, 2021-2031,($MILLION)
    TABLE 86. SOUTH KOREA MOBILE CRANE MARKET, BY CARRRIER TYPE, 2021-2031,($MILLION)
    TABLE 87. SOUTH KOREA MOBILE CRANE MARKET, BY TERRAIN TYPE, 2021-2031,($MILLION)
    TABLE 88. SOUTH KOREA MOBILE CRANE MARKET, BY END USER INDUSTRY, 2021-2031,($MILLION)
    TABLE 89. REST OF ASIA PACIFIC MOBILE CRANE MARKET, BY BOOM TYPE, 2021-2031,($MILLION)
    TABLE 90. REST OF ASIA PACIFIC MOBILE CRANE MARKET, BY CARRRIER TYPE, 2021-2031,($MILLION)
    TABLE 91. REST OF ASIA PACIFIC MOBILE CRANE MARKET, BY TERRAIN TYPE, 2021-2031,($MILLION)
    TABLE 92. REST OF ASIA PACIFIC MOBILE CRANE MARKET, BY END USER INDUSTRY, 2021-2031,($MILLION)
    TABLE 93. LAMEA MOBILE CRANE MARKET, BY BOOM TYPE, 2021-2031,($MILLION)
    TABLE 94. LAMEA MOBILE CRANE MARKET, BY CARRRIER TYPE, 2021-2031,($MILLION)
    TABLE 95. LAMEA MOBILE CRANE MARKET, BY TERRAIN TYPE, 2021-2031,($MILLION)
    TABLE 96. LAMEA MOBILE CRANE MARKET, BY END USER INDUSTRY, 2021-2031,($MILLION)
    TABLE 97. LAMEA MOBILE CRANE MARKET, BY COUNTRY, 2021-2031,($MILLION)
    TABLE 98. LATIN AMERICA MOBILE CRANE MARKET, BY BOOM TYPE, 2021-2031,($MILLION)
    TABLE 99. LATIN AMERICA MOBILE CRANE MARKET, BY CARRRIER TYPE, 2021-2031,($MILLION)
    TABLE 100. LATIN AMERICA MOBILE CRANE MARKET, BY TERRAIN TYPE, 2021-2031,($MILLION)
    TABLE 101. LATIN AMERICA MOBILE CRANE MARKET, BY END USER INDUSTRY, 2021-2031,($MILLION)
    TABLE 102. MIDDLE EAST MOBILE CRANE MARKET, BY BOOM TYPE, 2021-2031,($MILLION)
    TABLE 103. MIDDLE EAST MOBILE CRANE MARKET, BY CARRRIER TYPE, 2021-2031,($MILLION)
    TABLE 104. MIDDLE EAST MOBILE CRANE MARKET, BY TERRAIN TYPE, 2021-2031,($MILLION)
    TABLE 105. MIDDLE EAST MOBILE CRANE MARKET, BY END USER INDUSTRY, 2021-2031,($MILLION)
    TABLE 106. AFRICA MOBILE CRANE MARKET, BY BOOM TYPE, 2021-2031,($MILLION)
    TABLE 107. AFRICA MOBILE CRANE MARKET, BY CARRRIER TYPE, 2021-2031,($MILLION)
    TABLE 108. AFRICA MOBILE CRANE MARKET, BY TERRAIN TYPE, 2021-2031,($MILLION)
    TABLE 109. AFRICA MOBILE CRANE MARKET, BY END USER INDUSTRY, 2021-2031,($MILLION)
    TABLE 110.ALTEC, INC.: COMPANY SNAPSHOT
    TABLE 111.ALTEC, INC.: OPERATING SEGMENTS
    TABLE 112.ALTEC, INC.: PRODUCT PORTFOLIO
    TABLE 113.ALTEC, INC.: NET SALES,
    TABLE 114.ALTEC, INC.: KEY STRATERGIES
    TABLE 115.CARGOTEC CORPORATION: COMPANY SNAPSHOT
    TABLE 116.CARGOTEC CORPORATION: OPERATING SEGMENTS
    TABLE 117.CARGOTEC CORPORATION: PRODUCT PORTFOLIO
    TABLE 118.CARGOTEC CORPORATION: NET SALES,
    TABLE 119.CARGOTEC CORPORATION: KEY STRATERGIES
    TABLE 120.KOBELCO CONSTRUCTION MACHINERY CO., LTD.: COMPANY SNAPSHOT
    TABLE 121.KOBELCO CONSTRUCTION MACHINERY CO., LTD.: OPERATING SEGMENTS
    TABLE 122.KOBELCO CONSTRUCTION MACHINERY CO., LTD.: PRODUCT PORTFOLIO
    TABLE 123.KOBELCO CONSTRUCTION MACHINERY CO., LTD.: NET SALES,
    TABLE 124.KOBELCO CONSTRUCTION MACHINERY CO., LTD.: KEY STRATERGIES
    TABLE 125.LIEBHERR-INTERNATIONAL AG: COMPANY SNAPSHOT
    TABLE 126.LIEBHERR-INTERNATIONAL AG: OPERATING SEGMENTS
    TABLE 127.LIEBHERR-INTERNATIONAL AG: PRODUCT PORTFOLIO
    TABLE 128.LIEBHERR-INTERNATIONAL AG: NET SALES,
    TABLE 129.LIEBHERR-INTERNATIONAL AG: KEY STRATERGIES
    TABLE 130.MANITOWOC COMPANY, INC.: COMPANY SNAPSHOT
    TABLE 131.MANITOWOC COMPANY, INC.: OPERATING SEGMENTS
    TABLE 132.MANITOWOC COMPANY, INC.: PRODUCT PORTFOLIO
    TABLE 133.MANITOWOC COMPANY, INC.: NET SALES,
    TABLE 134.MANITOWOC COMPANY, INC.: KEY STRATERGIES
    TABLE 135.SANY HEAVY INDUSTRY CO. LTD.: COMPANY SNAPSHOT
    TABLE 136.SANY HEAVY INDUSTRY CO. LTD.: OPERATING SEGMENTS
    TABLE 137.SANY HEAVY INDUSTRY CO. LTD.: PRODUCT PORTFOLIO
    TABLE 138.SANY HEAVY INDUSTRY CO. LTD.: NET SALES,
    TABLE 139.SANY HEAVY INDUSTRY CO. LTD.: KEY STRATERGIES
    TABLE 140.TADANO LTD.: COMPANY SNAPSHOT
    TABLE 141.TADANO LTD.: OPERATING SEGMENTS
    TABLE 142.TADANO LTD.: PRODUCT PORTFOLIO
    TABLE 143.TADANO LTD.: NET SALES,
    TABLE 144.TADANO LTD.: KEY STRATERGIES
    TABLE 145.TEREX CORPORATION: COMPANY SNAPSHOT
    TABLE 146.TEREX CORPORATION: OPERATING SEGMENTS
    TABLE 147.TEREX CORPORATION: PRODUCT PORTFOLIO
    TABLE 148.TEREX CORPORATION: NET SALES,
    TABLE 149.TEREX CORPORATION: KEY STRATERGIES
    TABLE 150.XUZHOU CONSTRUCTION MACHINERY GROUP CO., LTD.: COMPANY SNAPSHOT
    TABLE 151.XUZHOU CONSTRUCTION MACHINERY GROUP CO., LTD.: OPERATING SEGMENTS
    TABLE 152.XUZHOU CONSTRUCTION MACHINERY GROUP CO., LTD.: PRODUCT PORTFOLIO
    TABLE 153.XUZHOU CONSTRUCTION MACHINERY GROUP CO., LTD.: NET SALES,
    TABLE 154.XUZHOU CONSTRUCTION MACHINERY GROUP CO., LTD.: KEY STRATERGIES
    TABLE 155.ZOOMLION HEAVY INDUSTRY SCIENCE AND TECHNOLOGY CO., LTD.: COMPANY SNAPSHOT
    TABLE 156.ZOOMLION HEAVY INDUSTRY SCIENCE AND TECHNOLOGY CO., LTD.: OPERATING SEGMENTS
    TABLE 157.ZOOMLION HEAVY INDUSTRY SCIENCE AND TECHNOLOGY CO., LTD.: PRODUCT PORTFOLIO
    TABLE 158.ZOOMLION HEAVY INDUSTRY SCIENCE AND TECHNOLOGY CO., LTD.: NET SALES,
    TABLE 159.ZOOMLION HEAVY INDUSTRY SCIENCE AND TECHNOLOGY CO., LTD.: KEY STRATERGIES
  • LIST OF FIGURES

  • FIGURE 1.MOBILE CRANE MARKET SEGMENTATION
    FIGURE 2.MOBILE CRANE MARKET,2021-2031
    FIGURE 3.MOBILE CRANE MARKET,2021-2031
    FIGURE 4. TOP INVESTMENT POCKETS, BY REGION
    FIGURE 5.PORTER FIVE-1
    FIGURE 6.PORTER FIVE-2
    FIGURE 7.PORTER FIVE-3
    FIGURE 8.PORTER FIVE-4
    FIGURE 9.PORTER FIVE-5
    FIGURE 10.TOP PLAYER POSITIONING
    FIGURE 11.MOBILE CRANE MARKET:DRIVERS, RESTRAINTS AND OPPORTUNITIES
    FIGURE 12.MOBILE CRANE MARKET,BY BOOM TYPE,2021(%)
    FIGURE 13.COMPARATIVE SHARE ANALYSIS OF LATTICE BOOM MOBILE CRANE MARKET,2021-2031(%)
    FIGURE 14.COMPARATIVE SHARE ANALYSIS OF TELESCOPIC BOOM MOBILE CRANE MARKET,2021-2031(%)
    FIGURE 15.MOBILE CRANE MARKET,BY CARRRIER TYPE,2021(%)
    FIGURE 16.COMPARATIVE SHARE ANALYSIS OF WHEEL MOUNTED MOBILE CRANE MARKET,2021-2031(%)
    FIGURE 17.COMPARATIVE SHARE ANALYSIS OF TRACK MOUNTED MOBILE CRANE MARKET,2021-2031(%)
    FIGURE 18.MOBILE CRANE MARKET,BY TERRAIN TYPE,2021(%)
    FIGURE 19.COMPARATIVE SHARE ANALYSIS OF ON ROAD MOBILE CRANE MARKET,2021-2031(%)
    FIGURE 20.COMPARATIVE SHARE ANALYSIS OF ROUGH TERRAIN MOBILE CRANE MARKET,2021-2031(%)
    FIGURE 21.COMPARATIVE SHARE ANALYSIS OF ALL TERRAIN MOBILE CRANE MARKET,2021-2031(%)
    FIGURE 22.MOBILE CRANE MARKET,BY END USER INDUSTRY,2021(%)
    FIGURE 23.COMPARATIVE SHARE ANALYSIS OF CONSTRUCTION MOBILE CRANE MARKET,2021-2031(%)
    FIGURE 24.COMPARATIVE SHARE ANALYSIS OF MANUFACTURING MOBILE CRANE MARKET,2021-2031(%)
    FIGURE 25.COMPARATIVE SHARE ANALYSIS OF UTILITIES MOBILE CRANE MARKET,2021-2031(%)
    FIGURE 26.MOBILE CRANE MARKET BY REGION,2021
    FIGURE 27.U.S. MOBILE CRANE MARKET,2021-2031($MILLION)
    FIGURE 28.CANADA MOBILE CRANE MARKET,2021-2031($MILLION)
    FIGURE 29.MEXICO MOBILE CRANE MARKET,2021-2031($MILLION)
    FIGURE 30.GERMANY MOBILE CRANE MARKET,2021-2031($MILLION)
    FIGURE 31.UNITED KINGDOM MOBILE CRANE MARKET,2021-2031($MILLION)
    FIGURE 32.FRANCE MOBILE CRANE MARKET,2021-2031($MILLION)
    FIGURE 33.ITALY MOBILE CRANE MARKET,2021-2031($MILLION)
    FIGURE 34.REST OF EUROPE MOBILE CRANE MARKET,2021-2031($MILLION)
    FIGURE 35.CHINA MOBILE CRANE MARKET,2021-2031($MILLION)
    FIGURE 36.JAPAN MOBILE CRANE MARKET,2021-2031($MILLION)
    FIGURE 37.INDIA MOBILE CRANE MARKET,2021-2031($MILLION)
    FIGURE 38.SOUTH KOREA MOBILE CRANE MARKET,2021-2031($MILLION)
    FIGURE 39.REST OF ASIA PACIFIC MOBILE CRANE MARKET,2021-2031($MILLION)
    FIGURE 40.LATIN AMERICA MOBILE CRANE MARKET,2021-2031($MILLION)
    FIGURE 41.MIDDLE EAST MOBILE CRANE MARKET,2021-2031($MILLION)
    FIGURE 42.AFRICA MOBILE CRANE MARKET,2021-2031($MILLION)
    FIGURE 43. TOP WINNING STRATEGIES, BY YEAR
    FIGURE 44. TOP WINNING STRATEGIES, BY DEVELOPMENT
    FIGURE 45. TOP WINNING STRATEGIES, BY COMPANY
    FIGURE 46.PRODUCT MAPPING OF TOP 10 PLAYERS
    FIGURE 47.COMPETITIVE DASHBOARD
    FIGURE 48.COMPETITIVE HEATMAP OF TOP 10 KEY PLAYERS
    FIGURE 49.ALTEC, INC..: NET SALES ,($MILLION)
    FIGURE 50.CARGOTEC CORPORATION.: NET SALES ,($MILLION)
    FIGURE 51.KOBELCO CONSTRUCTION MACHINERY CO., LTD..: NET SALES ,($MILLION)
    FIGURE 52.LIEBHERR-INTERNATIONAL AG.: NET SALES ,($MILLION)
    FIGURE 53.MANITOWOC COMPANY, INC..: NET SALES ,($MILLION)
    FIGURE 54.SANY HEAVY INDUSTRY CO. LTD..: NET SALES ,($MILLION)
    FIGURE 55.TADANO LTD..: NET SALES ,($MILLION)
    FIGURE 56.TEREX CORPORATION.: NET SALES ,($MILLION)
    FIGURE 57.XUZHOU CONSTRUCTION MACHINERY GROUP CO., LTD..: NET SALES ,($MILLION)
    FIGURE 58.ZOOMLION HEAVY INDUSTRY SCIENCE AND TECHNOLOGY CO., LTD..: NET SALES ,($MILLION)


The mobile crane market has witnessed significant growth in past few years, owing to surge in investments on infrastructure and construction projects.

The rise in urbanization globally, especially in Asia-Pacific has fueled the demand for various infrastructure projects, such as, roads, bridges, railways, tunnels, and others. In addition, construction activities have also witnessed an up-trend. The medium income countries, such as India, China, Vietnam, South Korea, and others have fueled the demand for low- and high-rise buildings. Such factors are anticipated to drive the demand for mobile cranes during the forecast period. Furthermore, the manufacturing sector is witnessing a rise in Europe and Asia-Pacific regions. Mobile cranes are extensively used for heavy load handling in the manufacturing sector, especially, for the manufacturing of heavy objects such as, cars, industrial machineries, steel, and others.

In addition, incorporation of latest battery technology along with advanced telescopic booms is expected to play a pivotal role in the development of autonomous mobile and highly functional mobile cranes. Such advanced mobile cranes require minimal operator input, and are expected to complete the task at much less time. Thereby, providing saving high cost of operation. Such advancements are anticipated to provide lucrative opportunities for the growth for the market. 

PURCHASE OPTIONS

Call or Email us

U.S.-Canada Toll-free: +1-800-792-5285
Int'l : +1-503-894-6022
Europe : +44-845-528-1300
Email : help@alliedmarketresearch.com
 
FREQUENTLY ASKED QUESTIONS?

A. Development of more durable and efficient mobile cranes is a major upcoming trend in the market.

A. Mobile cranes are extensively used in construction, manufacturing and logistics sector for handling heavy loads.

A. Asia-Pacific is the largest regional market for Mobile Crane.

A. $14,357.7 Million is the estimated industry size of Mobile Crane.

A. Altec Inc., Cargotec Corporation, Liebherr International AG, Manitowoc Company Inc., Sany Heavy Industry Co. Ltd., Tadano Ltd. and Terex Corporation are some of the are the top companies to hold the market share in Mobile Crane.

A. Based on boom type, the telescopic boom holds the maximum market share of the Mobile Cranel market in 2021.

A. The company profile has been selected on factors such as geographical presence, market dominance (in terms of revenue and volume sales), various strategies and recent developments.

A. The product launch is key growth strategy of Mobile Crane industry players.

Looking for Customization?

 Customization Request

Have a Question?

 Speak with Analyst

Any Confusion?

 Inquire Before Buying

Have a glance of the Report

  Request Sample
RELATED TAGS

Purchase Full Report of
Mobile Crane Market

Start reading instantly.
This Report and over 66,804+ more Reports, Available with Avenue Library. T&C*.

  • Online Only
  • $3,456
  • Online cloud access only
  • Restricted print, copy, paste & download
  • Read only
  • Free industry update
    (Within 180 days)
  • Free report update in next update cycle
    (Jun 2023 - Jun 2024)
  • Data Pack
  • $3,840
  • Restricted to one authorized user
  • One print only
  • Available in
    Excel
  • Free industry update
    (Within 180 days)
  •   Free report update in next update cycle
    (Jun 2023 - Jun 2024)
  • Single User
  • $5,769
  • Restricted to one authorized user
  • One print only
  • Available in
    PDF
  • Free industry update
    (Within 180 days)
  •   Free report update in next update cycle
    (Jun 2023 - Jun 2024)
  • Five Users
  • $6,450
  • Limited to five authorized users
  • Print upto five copies
  • Available in
    PDF
  • Free industry update
    (Within 180 days)
  •   Free report update in next update cycle
    (Jun 2023 - Jun 2024)
  • Enterprise
    License/PDF

  • $10,995
  • Unlimited
    within
    company/enterprise
  • Available in Excel & PDF
  • Free industry update
    (Within 180 days)
  •   Free report update in next update cycle
    (Jun 2023 - Jun 2024)
  • Library
    Membership

  • $999 $ 1,175
    Per User/ Per month/ Billed annually
  • Published Content
    E-access
  • Company Profiles
    E-access
  • Newly Added Content Access
  • 10 PDF
    Downloads
  • 5 Excel Data
    Pack Downloads
  • 250 Company Profiles PDF Downloads
  • Buy Now

*Taxes/Fees, if applicable will be added during checkout. All prices in USD

RELATED REPORTS
 

Why Allied Market Research?


Infallible Methodology

To ensure high-level data integrity, accurate analysis, and impeccable forecasts

Analyst Support

For complete satisfaction

Customization

On-demand customization of scope of the report to exactly meet your needs

TARGETED MARKET VIEW

Targeted market view to provide pertinent information and save time of readers

Get fresh content delivered

Get insights on topics that are crucial for your business. Stay abreast of your interest areas.

Get Industry Data Alerts

Why Allied Market Research?

Infallible Methodology

To ensure high-level data integrity, accurate analysis, and impeccable forecasts

Analyst Support

For complete satisfaction

Customization

On-demand customization of scope of the report to exactly meet your needs

TARGETED MARKET VIEW

Targeted market view to provide pertinent information and save time of readers