0
2020
Mobile Wallet Market

Mobile Wallet Market

by Type (Proximity and Remote), Technology (Near Field Communication, QR Code, Text based/ Short message service, and Digital Only), End User (Personal and Business), and Industry Vertical (Hospitality & Transportation, Media & Entertainment, Retail, Healthcare, Energy & utilities, Telecommunication and Others): Global Opportunity Analysis and Industry Forecast, 2020-2027

Report Code: A00019
Apr 2020 | Pages: 316
Tables: 150
Charts: 91
  • Formats*:

  • pdf

    Single User License, Five User
    License & Enterprise User License

  • xls

    Data Pack Excel License

  • ppt

    It comes with the additional cost
    of $2500.00 contact sales.


COVID-19

Pandemic disrupted the entire world and affected many industries.

Get detailed COVID-19 impact analysis on the Mobile Wallet Market

Request Now !

Mobile Wallet Market: 2027

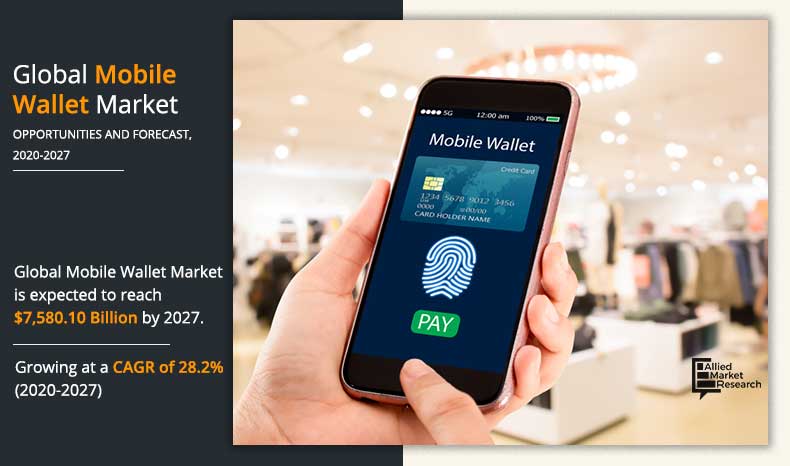
The mobile wallet market size was valued at $1,043.1 billion in 2019, and is projected to reach $7,580.1 billion by 2027, growing at a CAGR of 28.2% from 2020 to 2027. A mobile wallet allows consumers to make transactions even during travel, from any location, anytime. It not only provides transaction facilities at affordable prices but also facilitates consumers to manage their accounts easily. While all these aspects are boosting the growth of the mobile wallet industry, consumers’ concerns related to security and technology infancy, investment, and deployment issues are expected to impede the growth of the mobile wallet market. Although these restraints are prevalent, companies from the telecommunication industry are collaborating with each other to serve the needs of their customers with new and improved product / service innovation.

Mobile-Wallet-Market-2020-2027

Mobile wallet offers an entirely new dimension to retail sales to improve their business presence. While mobile devices provide consumers with an easy way to make payments, they act as a new channel for merchants and financial institutions to connect with their customers. Information can be easily sent and received via mobile devices; they also run specialty applications, and are location-aware. The mobile connection facilitates merchants and financial institutions to communicate information such as promotional offers with their customers in such a way that the information is targeted, useful, and more relevant to their interests. Businesses can also come up with new branded applications that are freely download able. As unique shopping preferences and needs of a person are tracked, this aspect can make customer communications highly personalized. Such a connected and real-time marketing offers a new opportunity and competitive challenge to marketers.   

Wide adoption of smartphones indicates the accessibility level for mobile wallet. Smartphone users are able to make the most of the mobile wallet functionalities, and it is expected that more such users will come up in the next few years owing to plenty of benefits that mobile wallet provides.

On the basis of mode of payment, the global mobile wallet market is categorized into remote and NFC payment. The NFC market is further sub-segmented into NFC handsets, NFC chips and tags, NFC readers, NFC Micro SD, and NFC SIM / UICC card. The global mobile wallet market stakeholders encompass mobile network operators (MNOs), handset manufacturers, OSS / BSS solution providers, software developers, content applications & aggregators, and other stakeholders. Increase in awareness regarding mobile wallets and their applications, rise in smartphone penetration, and high affordability are expected to drive the growth of the mobile wallet application market. Moreover, widespread smartphone adoption and implementation of multi-channel strategies by merchants due to increase in competition from Internet vendors is further expected to propel the mobile wallet market opportunities in the coming years.

Mobile Wallet Market
By Type

Your browser does not support the canvas element.

Remote is projected as one of the most lucrative segments.

Get more information on this report : Request Sample Pages

The report focuses on the growth prospects, restraints, and market analysis. The study provides Porter’s five forces analysis of the mobile wallet industry to understand the impact of various factors such as bargaining power of suppliers, competitive intensity of competitors, threat of new entrants, threat of substitutes, and bargaining power of buyers on the market.

Segment review

The global mobile wallet market is segmented into type, technology, end user, industry vertical, and region. Depending on type, the market is bifurcated into proximity and remote. On the basis of technology, it is classified into near field communication, QR code, text based/ short message service, and digital only. By end user, the market is categorized into personal and business. By industry vertical, the market is classified into hospitality & transportation, media & entertainment, retail, healthcare, energy & utilities, telecommunication, and others. Region wise, it is analyzed across North America, Europe, Asia-Pacific, and LAMEA.

Mobile Wallet Market
By Technology

Your browser does not support the canvas element.

QR code is projected as one of the most significant segments.

Get more information on this report : Request Sample Pages

The market players operating in the mobile wallet market analysis include Amazon Web Services Inc., American Express Banking Corp., Apple Inc., Alipay.com, AT&T Inc., Google Inc., Mastercard Incorporated, PayPal Holdings, Inc., Samsung Electronics Co., Ltd., and VISA Inc.

Mobile Wallet Market
By End User

Your browser does not support the canvas element.

Personal is projected as one of the most significant segments.

Get more information on this report : Request Sample Pages

Top impacting factors

Emergence of payment-enabled mobile phones, connected and real-time marketing, and the social media effect are some of the major factors impacting the market growth. The top markets with high revenue and growth rates are mobile commerce and mobile ticketing. The key market drivers for mobile wallet market forecast include rise in adoption of smart phones and companies’ efforts toward improvement in mobile commerce platforms, services, and apps owing to high usage. As for mobile ticketing, the growth is expected to be driven by anticipated extensive usage of NFC-based ticketing solutions for transit purposes. However, stiff competition in the market is expected to hamper the mobile wallet market growth.

Mobile Wallet Market
By Applications

Your browser does not support the canvas element.

Retail is projected as one of the most significant segments.

Get more information on this report : Request Sample Pages

Greater Convenience and Accessibility

The ability of mobile wallet to provide online bill payment options and other money transfer facilities easily and securely drives the growth of the market. In addition, the user-friendly interface of mobile wallets has increased the number of consumers that are opting for mobile wallet; where in they can receive and make regular payments at their convenience through mobile wallets. Also, the user-friendly interface facilitates ease of transaction during travel, which is a major factor estimated to boost the growth of the market. Even, financial institutions and banks get an opportunity to connect with consumers in rural areas via the mobile wallet module, which has helped the market to grow and reach its end user at less cost. Various modules of mobile wallet are being developed to enhance security and ease of use of such services, which is further expected to drive the mobile wallet market growth in the coming years.

Mobile Wallet Market
By Region

2027
Asia-pacific 
North America
Europe
LAMEA

Asia-Pacific would exhibit the highest CAGR of 30.5% during 2020-2027.

Get more information on this report : Request Sample Pages

Covid-19 Impacts on Mobile Wallet Market-

  • The growth of mobile wallet market is expected to grow significantly during Covid-19 pandemic as the consumers are now preferring mobile wallets such as Paytm and Google Pay for making financial
  • transactions to avoid physical contact with individuals to prevent transmission of corona virus.
  • According to Reserve Bank of India (RBI), in April 2020, transactions made using mobile wallet across the India has been to double to 87.0 million compared to March 2020. 

Key Benefits For Stakeholders

  • This study includes the mobile wallet market trends, opportunity, analysis, and future estimations to determine the imminent investment pockets.
  • The report presents information related to key drivers, restraints, and opportunities of the mobile wallet industry.
  • The mobile wallet market shareis quantitatively analyzed from 2019 to 2027 to highlight the financial competency of the industry.
  • Porter’s five forces analysis illustrates the potency of the buyers & suppliers in the mobile wallet market.

Mobile Wallet Market Report Highlights

Aspects Details
By Type
  • Proximity
  • Remote
By Technology
  • Near Field Communication
  • QR Code
  • Text based/Short message service
  • Digital Only
By Application
  • HOSPITALITY & TRANSPORTATION
  • .MEDIA & ENTERTAINMENT
  • RETAIL
  • HEALTHCARE
  • ENERGY & UTILITIES
  • TELECOMMUNICATION
  • OTHERS
By End User
  • PERSONAL
  • BUSINESS
By Region
  • North America  (U.S., Canada)
  • Europe  (Germany, France, UK, Spain, Italy, Rest of Europe)
  • Asia-Pacific  (Japan, China, Australia, India, South Korea, Rest of Asia-Pacific)
  • LAMEA  (Latin America, Middle East, Africa)
Key Market Players AMAZON.COM INC., VISA INC., AMERICAN EXPRESS COMPANY, MASTERCARD, GOOGLE LLC, AT&T INC., SAMSUNG ELECTRONICS CO., LTD., PAYPAL HOLDINGS, INC., ALIPAY.COM, APPLE INC.
 

CHAPTER 1:INTRODUCTION

1.1.REPORT DESCRIPTION
1.2.RESEARCH METHODOLOGY

1.2.1.Secondary research
1.2.2.Primary research
1.2.3.Analyst tools & models

CHAPTER 2:EXECUTIVE SUMMARY

2.1.KEY FINDINGS

2.1.1.Top impacting factors
2.1.2.Top investment pockets

2.2.CXO PERSPECTIVE

CHAPTER 3:MARKET OVERVIEW

3.1.MARKET DEFINITION AND SCOPE
3.2.PORTER’S FIVE FORCES ANALYSIS

3.2.1.Moderate -To-High bargaining power of suppliers
3.2.2.Low-To-High bargaining power of buyers
3.2.3.Low-To-High Threat of substitutes
3.2.4.Low threat of new entrants
3.2.5.Low-To-High competitive rivalry

3.3.MARKET DYNAMICS

3.3.1.Drivers

3.3.1.1.Soar in number of mobile subscribers across the globe
3.3.1.2.Increase in government initiatives to encourage cashless economy
3.3.1.3.Rise in the adoption of mobile wallet as a digital payment-based business models among digital applicationss

3.3.2.Restraint

3.3.2.1.Concerns associated with fraudulence transactions and data security

3.3.3.Opportunities

3.3.3.1.Increase in mobile point of sale (POS) devices and NFC-enabled handset
3.3.3.2.Mobile banking and inventive mobile payment application

3.4.MARKET EVOLUTION/ INDUSTRY ROADMAP

3.4.1.Online acceptance models
3.4.2.Reducing friction
3.4.3.Acceptance of mobile wallets

3.5.IMPACT OF GOVERNMENT REGULATIONS ON THE GLOBAL MOBILE WALLET MARKET

3.5.1.North America
3.5.2.Europe
3.5.3.Asia-Pacific
3.5.4.LAMEA

CHAPTER 4:MOBILE WALLET MARKET, BY TYPE

4.1.OVERVIEW
4.2.PROXIMITY

4.2.1.Key market trends, growth factors, and opportunities
4.2.2.Market size and forecast, by region
4.2.3.Market analysis, by country

4.3.REMOTE

4.3.1.Key market trends, growth factors, and opportunities
4.3.2.Market size and forecast, by region
4.3.3.Market analysis, by country

CHAPTER 5:MOBILE WALLET MARKET, BY TECHNOLOGY

5.1.OVERVIEW
5.2.NEAR FIELD COMMUNICATION

5.2.1.Key market trends, growth factors, and opportunities
5.2.2.Market size and forecast, by region
5.2.3.Market analysis, by country

5.3.QR CODE

5.3.1.Key market trends, growth factors, and opportunities
5.3.2.Market size and forecast, by region
5.3.3.Market analysis, by country

5.4.TEXT BASED/ SHORT MESSAGE SERVICE

5.4.1.Key market trends, growth factors, and opportunities
5.4.2.Market size and forecast, by region
5.4.3.Market analysis, by country

5.5.DIGITAL ONLY

5.5.1.Key market trends, growth factors, and opportunities
5.5.2.Market size and forecast, by region
5.5.3.Market analysis, by country

CHAPTER 6:MOBILE WALLET MARKET, BY APPLICATIONS

6.1.OVERVIEW
6.2.HOSPITALITY & TRANSPORTATION

6.2.1.Key market trends, growth factors, and opportunities
6.2.2.Market size and forecast, by region
6.2.3.Market analysis, by country

6.3.MEDIA & ENTERTAINMENT

6.3.1.Key market trends, growth factors, and opportunities
6.3.2.Market size and forecast, by region
6.3.3.Market analysis, by country

6.4.RETAIL

6.4.1.Key market trends, growth factors, and opportunities
6.4.2.Market size and forecast, by region
6.4.3.Market analysis, by country

6.5.HEALTHCARE

6.5.1.Key market trends, growth factors, and opportunities
6.5.2.Market size and forecast, by region
6.5.3.Market analysis, by country

6.6.ENERGY & UTILITIES

6.6.1.Key market trends, growth factors, and opportunities
6.6.2.Market size and forecast, by region
6.6.3.Market analysis, by country

6.7.TELECOMMUNICATION

6.7.1.Key market trends, growth factors, and opportunities
6.7.2.Market size and forecast, by region
6.7.3.Market analysis, by country

6.8.OTHERS

6.8.1.Key market trends, growth factors, and opportunities
6.8.2.Market size and forecast, by region
6.8.3.Market analysis, by country

CHAPTER 7:MOBILE WALLET MARKET, BY END USER

7.1.OVERVIEW
7.2.PERSONAL

7.2.1.Key market trends, growth factors, and opportunities
7.2.2.Market size and forecast, by region
7.2.3.Market analysis, by country

7.3.BUSINESS

7.3.1.Key market trends, growth factors, and opportunities
7.3.2.Market size and forecast, by region
7.3.3.Market analysis, by country

CHAPTER 8:MOBILE WALLET MARKET, BY REGION

8.1.OVERVIEW
8.2.NORTH AMERICA

8.2.1.Key market trends, growth factors and opportunities
8.2.2.Market size and forecast, by technology
8.2.3.Market size and forecast, by type
8.2.4.Market size and forecast, by applications
8.2.5.Market size and forecast, by end user
8.2.6.Market analysis by country

8.2.6.1.U.S.

8.2.6.1.1.Market size and forecast, by technology
8.2.6.1.2.Market size and forecast, by type
8.2.6.1.3.Market size and forecast, by applications
8.2.6.1.4.Market size and forecast, by end user

8.2.6.2.CANADA

8.2.6.2.1.Market size and forecast, by technology
8.2.6.2.2.Market size and forecast, by type
8.2.6.2.3.Market size and forecast, by applications
8.2.6.2.4.Market size and forecast, by end user

8.3.EUROPE

8.3.1.Key market trends, growth factors and opportunities
8.3.2.Market size and forecast, by technology
8.3.3.Market size and forecast, by type
8.3.4.Market size and forecast, by applications
8.3.5.Market size and forecast, by end user
8.3.6.Market analysis by country

8.3.6.1.GERMANY

8.3.6.1.1.Market size and forecast, by technology
8.3.6.1.2.Market size and forecast, by type
8.3.6.1.3.Market size and forecast, by applications
8.3.6.1.4.Market size and forecast, by end user

8.3.6.2.FRANCE

8.3.6.2.1.Market size and forecast, by technology
8.3.6.2.2.Market size and forecast, by type
8.3.6.2.3.Market size and forecast, by applications
8.3.6.2.4.Market size and forecast, by end user

8.3.6.3.UK

8.3.6.3.1.Market size and forecast, by technology
8.3.6.3.2.Market size and forecast, by type
8.3.6.3.3.Market size and forecast, by applications
8.3.6.3.4.Market size and forecast, by end user

8.3.6.4.SPAIN

8.3.6.4.1.Market size and forecast, by technology
8.3.6.4.2.Market size and forecast, by type
8.3.6.4.3.Market size and forecast, by applications
8.3.6.4.4.Market size and forecast, by end user

8.3.6.5.ITALY

8.3.6.5.1.Market size and forecast, by technology
8.3.6.5.2.Market size and forecast, by type
8.3.6.5.3.Market size and forecast, by applications
8.3.6.5.4.Market size and forecast, by end user

8.3.6.6.REST OF EUROPE

8.3.6.6.1.Market size and forecast, by technology
8.3.6.6.2.Market size and forecast, by type
8.3.6.6.3.Market size and forecast, by applications
8.3.6.6.4.Market size and forecast, by end user

8.4.ASIA-PACIFIC

8.4.1.Key market trends, growth factors and opportunities
8.4.2.Market size and forecast, by technology
8.4.3.Market size and forecast, by type
8.4.4.Market size and forecast, by applications
8.4.5.Market size and forecast, by end user
8.4.6.Market analysis by country

8.4.6.1.JAPAN

8.4.6.1.1.Market size and forecast, by technology
8.4.6.1.2.Market size and forecast, by type
8.4.6.1.3.Market size and forecast, by applications
8.4.6.1.4.Market size and forecast, by end user

8.4.6.2.CHINA

8.4.6.2.1.Market size and forecast, by technology
8.4.6.2.2.Market size and forecast, by type
8.4.6.2.3.Market size and forecast, by applications
8.4.6.2.4.Market size and forecast, by end user

8.4.6.3.AUSTRALIA

8.4.6.3.1.Market size and forecast, by technology
8.4.6.3.2.Market size and forecast, by type
8.4.6.3.3.Market size and forecast, by applications
8.4.6.3.4.Market size and forecast, by end user

8.4.6.4.INDIA

8.4.6.4.1.Market size and forecast, by technology
8.4.6.4.2.Market size and forecast, by type
8.4.6.4.3.Market size and forecast, by applications
8.4.6.4.4.Market size and forecast, by end user

8.4.6.5.SOUTH KOREA

8.4.6.5.1.Market size and forecast, by technology
8.4.6.5.2.Market size and forecast, by type
8.4.6.5.3.Market size and forecast, by applications
8.4.6.5.4.Market size and forecast, by end user

8.4.6.6.REST OF ASIA-PACIFIC

8.4.6.6.1.Market size and forecast, by technology
8.4.6.6.2.Market size and forecast, by type
8.4.6.6.3.Market size and forecast, by applications
8.4.6.6.4.Market size and forecast, by end user

8.5.LAMEA

8.5.1.Key market trends, growth factors and opportunities
8.5.2.Market size and forecast, by technology
8.5.3.Market size and forecast, by type
8.5.4.Market size and forecast, by applications
8.5.5.Market size and forecast, by end user
8.5.6.Market analysis by country

8.5.6.1.LATIN AMERICA

8.5.6.1.1.Market size and forecast, by technology
8.5.6.1.2.Market size and forecast, by type
8.5.6.1.3.Market size and forecast, by applications
8.5.6.1.4.Market size and forecast, by end user

8.5.6.2.MIDDLE EAST

8.5.6.2.1.Market size and forecast, by technology
8.5.6.2.2.Market size and forecast, by type
8.5.6.2.3.Market size and forecast, by applications
8.5.6.2.4.Market size and forecast, by end user

8.5.6.3.AFRICA

8.5.6.3.1.Market size and forecast, by technology
8.5.6.3.2.Market size and forecast, by type
8.5.6.3.3.Market size and forecast, by applications
8.5.6.3.4.Market size and forecast, by end user

CHAPTER 9:COMPETITIVE LANDSCAPE

9.1.KEY PLAYER POSITIONING ANALYSIS, 2019
9.2.TOP WINNING STRATEGIES
9.3.COMPETITIVE DASHBOARD
9.4.KEY DEVELOPMENTS

9.4.1.New Type launches
9.4.2.Product development
9.4.3.Collaboration
9.4.4.Acquisition
9.4.5.Partnership
9.4.6.Business Expansion

CHAPTER 10:COMPANY PROFILES

10.1.ALIPAY.COM

10.1.1.Company overview
10.1.2.Key executives
10.1.3.Company snapshot
10.1.4.Operating business segments
10.1.5.Product portfolio
10.1.6.Business performance
10.1.7.Key strategic moves and developments

10.2.AMAZON.COM INC.

10.2.1.Company overview
10.2.2.Key executives
10.2.3.Company snapshot
10.2.4.Operating business segments
10.2.5.Product portfolio
10.2.6.Business performance
10.2.7.Key strategic moves and developments

10.3.AMERICAN EXPRESS COMPANY

10.3.1.Company overview
10.3.2.Key executives
10.3.3.Company snapshot
10.3.4.Operating business segments
10.3.5.Product portfolio
10.3.6.Business performance
10.3.7.Key strategic moves and developments

10.4.APPLE INC.

10.4.1.Company overview
10.4.2.Key executives
10.4.3.Company snapshot
10.4.4.Operating business segments
10.4.5.Product portfolio
10.4.6.R&D expenditure
10.4.7.Business performance
10.4.8.Key strategic moves and developments

10.5.AT&T INC.

10.5.1.Company overview
10.5.2.Key executives
10.5.3.Company snapshot
10.5.4.Operating business segments
10.5.5.Product portfolio
10.5.6.R&D expenditure
10.5.7.Business performance
10.5.8.Key strategic moves and developments

10.6.GOOGLE LLC

10.6.1.Company overview
10.6.2.Key executives
10.6.3.Company snapshot
10.6.4.Operating business segments
10.6.5.Product portfolio
10.6.6.R&D expenditure
10.6.7.Business performance
10.6.8.Key strategic moves and developments

10.7.MASTERCARD

10.7.1.Company overview
10.7.2.Key executives
10.7.3.Company snapshot
10.7.4.Product portfolio
10.7.5.Business performance
10.7.6.Key strategic moves and developments

10.8.PAYPAL HOLDINGS, INC.

10.8.1.Company overview
10.8.2.Key executives
10.8.3.Company snapshot
10.8.4.Product portfolio
10.8.5.R&D expenditure
10.8.6.Business performance
10.8.7.Key strategic moves and developments

10.9.SAMSUNG ELECTRONICS CO., LTD.

10.9.1.Company overview
10.9.2.Key Executives
10.9.3.Company snapshot
10.9.4.Operating business segments
10.9.5.Product portfolio
10.9.6.R&D expenditure
10.9.7.Business performance
10.9.8.Key strategic moves and developments

10.10.VISA INC.

10.10.1.Company overview
10.10.2.Key executives
10.10.3.Company snapshot
10.10.4.Product portfolio
10.10.5.Business performance
10.10.6.Key strategic moves and developments

LIST OF TABLES

TABLE 01.MOBILE WALLET MARKET, BY TYPE 2019–2027 ($BILLION)
TABLE 02.MOBILE WALLET MARKET FOR PROXIMITY, BY REGION, 2019–2027 ($BILLION)
TABLE 03.MOBILE WALLET MARKET FOR  REMOTE, BY REGION, 2019–2027 ($BILLION)
TABLE 04.MOBILE WALLET MARKET, BY TECHNOLOGY 2019–2027 ($BILLION)
TABLE 05.MOBILE WALLET MARKET FOR NEAR FIELD COMMUNICATION, BY REGION, 2019–2027 ($BILLION)
TABLE 06.MOBILE WALLET MARKET FOR QR CODE, BY REGION, 2019–2027 ($BILLION)
TABLE 07.MOBILE WALLET MARKET FOR TEXT BASED/ SHORT MESSAGE SERVICE, BY REGION, 2019–2027 ($BILLION)
TABLE 08.MOBILE WALLET MARKET FOR DIGITAL ONLY, BY REGION, 2019–2027 ($BILLION)
TABLE 09.MOBILE WALLET MARKET, BY APPLICATIONS, 2019–2027 ($BILLION)
TABLE 10.MOBILE WALLET MARKET FOR HOSPITALITY & TRANSPORTATION, BY REGION, 2019–2027 ($BILLION)
TABLE 11.MOBILE WALLET MARKET FOR MEDIA & ENTERTAINMENT, BY REGION, 2019–2027 ($BILLION)
TABLE 12.MOBILE WALLET MARKET FOR RETAIL, BY REGION, 2019–2027 ($BILLION)
TABLE 13.MOBILE WALLET MARKET FOR HEALTHCARE, BY REGION, 2019–2027 ($BILLION)
TABLE 14.MOBILE WALLET MARKET FOR ENERGY & UTILITIES, BY REGION, 2019–2027 ($BILLION)
TABLE 15.MOBILE WALLET MARKET FOR TELECOMMUNICATION, BY REGION, 2019–2027 ($BILLION)
TABLE 16.MOBILE WALLET MARKET FOR OTHERS, BY REGION, 2019–2027 ($BILLION)
TABLE 17.MOBILE WALLET MARKET, BY END USER 2019–2027 ($BILLION)
TABLE 18.MOBILE WALLET MARKET FOR PERSONAL, BY REGION, 2019–2027 ($BILLION)
TABLE 19.MOBILE WALLET MARKET FOR BUSINESS, BY REGION, 2019–2027 ($BILLION)
TABLE 20.MOBILE WALLET MARKET, BY REGION, 2019–2027 ($BILLION)
TABLE 21.MOBILE WALLET MARKET, BY REGION, 2019–2027 ($BILLION)
TABLE 22.NORTH AMERICA MOBILE WALLET MARKET, BY TECHNOLOGY, 2019-2027 ($BILLION)
TABLE 23.NORTH AMERICA MOBILE WALLET MARKET, BY TYPE, 2019-2027 ($BILLION)
TABLE 24.NORTH AMERICA MOBILE WALLET MARKET, BY APPLICATIONS, 2019-2027 ($BILLION)
TABLE 25.NORTH AMERICA MOBILE WALLET MARKET, BY END USER, 2019-2027 ($BILLION)
TABLE 26.NORTH AMERICA MOBILE WALLET MARKET, BY COUNTRY, 2019-2027 ($BILLION)
TABLE 27.U.S. MOBILE WALLET MARKET, BY TECHNOLOGY, 2019-2027 ($BILLION)
TABLE 28.U.S. MOBILE WALLET MARKET, BY TYPE, 2019-2027 ($BILLION)
TABLE 29.U.S. MOBILE WALLET MARKET, BY APPLICATIONS, 2019-2027 ($BILLION)
TABLE 30.U.S. MOBILE WALLET MARKET, BY END USER, 2019-2027 ($BILLION)
TABLE 31.CANADA MOBILE WALLET MARKET, BY TECHNOLOGY, 2019-2027 ($BILLION)
TABLE 32.CANADA MOBILE WALLET MARKET, BY TYPE, 2019-2027 ($BILLION)
TABLE 33.CANADA MOBILE WALLET MARKET, BY APPLICATIONS, 2019-2027 ($BILLION)
TABLE 34.CANADA MOBILE WALLET MARKET, BY END USER, 2019-2027 ($BILLION)
TABLE 35.EUROPE MOBILE WALLET MARKET, BY TECHNOLOGY, 2019-2027 ($BILLION)
TABLE 36.EUROPE MOBILE WALLET MARKET, BY TYPE, 2019-2027 ($BILLION)
TABLE 37.EUROPE MOBILE WALLET MARKET, BY APPLICATIONS, 2019-2027 ($BILLION)
TABLE 38.EUROPE MOBILE WALLET MARKET, BY END USER, 2019-2027 ($BILLION)
TABLE 39.EUROPE MOBILE WALLET MARKET, BY COUNTRY, 2019-2027 ($BILLION)
TABLE 40.GERMANY MOBILE WALLET MARKET, BY TECHNOLOGY, 2019-2027 ($BILLION)
TABLE 41.GERMANY MOBILE WALLET MARKET, BY TYPE, 2019-2027 ($BILLION)
TABLE 42.GERMANY MOBILE WALLET MARKET, BY APPLICATIONS, 2019-2027 ($BILLION)
TABLE 43.GERMANY MOBILE WALLET MARKET, BY END USER, 2019-2027 ($BILLION)
TABLE 44.FRANCE MOBILE WALLET MARKET, BY TECHNOLOGY, 2019-2027 ($BILLION)
TABLE 45.FRANCE MOBILE WALLET MARKET, BY TYPE, 2019-2027 ($BILLION)
TABLE 46.FRANCE MOBILE WALLET MARKET, BY APPLICATIONS, 2019-2027 ($BILLION)
TABLE 47.FRANCE MOBILE WALLET MARKET, BY END USER, 2019-2027 ($BILLION)
TABLE 48.UK MOBILE WALLET MARKET, BY TECHNOLOGY, 2019-2027 ($BILLION)
TABLE 49.UK MOBILE WALLET MARKET, BY TYPE, 2019-2027 ($BILLION)
TABLE 50.UK MOBILE WALLET MARKET, BY APPLICATIONS, 2019-2027 ($BILLION)
TABLE 51.UK MOBILE WALLET MARKET, BY END USER, 2019-2027 ($BILLION)
TABLE 52.SPAIN MOBILE WALLET MARKET, BY TECHNOLOGY, 2019-2027 ($BILLION)
TABLE 53.SPAIN MOBILE WALLET MARKET, BY TYPE, 2019-2027 ($BILLION)
TABLE 54.SPAIN MOBILE WALLET MARKET, BY APPLICATIONS, 2019-2027 ($BILLION)
TABLE 55.SPAIN MOBILE WALLET MARKET, BY END USER, 2019-2027 ($BILLION)
TABLE 56.ITALY MOBILE WALLET MARKET, BY TECHNOLOGY, 2019-2027 ($BILLION)
TABLE 57.ITALY MOBILE WALLET MARKET, BY TYPE, 2019-2027 ($BILLION)
TABLE 58.ITALY MOBILE WALLET MARKET, BY APPLICATIONS, 2019-2027 ($BILLION)
TABLE 59.ITALY MOBILE WALLET MARKET, BY END USER, 2019-2027 ($BILLION)
TABLE 60.REST OF EUROPE MOBILE WALLET MARKET, BY TECHNOLOGY, 2019-2027 ($BILLION)
TABLE 61.REST OF EUROPE MOBILE WALLET MARKET, BY TYPE, 2019-2027 ($BILLION)
TABLE 62.REST OF EUROPE MOBILE WALLET MARKET, BY APPLICATIONS, 2019-2027 ($BILLION)
TABLE 63.REST OF EUROPE MOBILE WALLET MARKET, BY END USER, 2019-2027 ($BILLION)
TABLE 64.ASIA-PACIFIC MOBILE WALLET MARKET, BY TECHNOLOGY, 2019-2027 ($BILLION)
TABLE 65.ASIA-PACIFIC MOBILE WALLET MARKET, BY TYPE, 2019-2027 ($BILLION)
TABLE 66.ASIA-PACIFIC MOBILE WALLET MARKET, BY APPLICATIONS, 2019-2027 ($BILLION)
TABLE 67.ASIA-PACIFIC MOBILE WALLET MARKET, BY END USER, 2019-2027 ($BILLION)
TABLE 68.ASIA-PACIFIC MOBILE WALLET MARKET, BY COUNTRY, 2019-2027 ($BILLION)
TABLE 69.JAPAN MOBILE WALLET MARKET, BY TECHNOLOGY, 2019-2027 ($BILLION)
TABLE 70.JAPAN MOBILE WALLET MARKET, BY TYPE, 2019-2027 ($BILLION)
TABLE 71.JAPAN MOBILE WALLET MARKET, BY APPLICATIONS, 2019-2027 ($BILLION)
TABLE 72.JAPAN MOBILE WALLET MARKET, BY END USER, 2019-2027 ($BILLION)
TABLE 73.CHINA MOBILE WALLET MARKET, BY TECHNOLOGY, 2019-2027 ($BILLION)
TABLE 74.CHINA MOBILE WALLET MARKET, BY TYPE, 2019-2027 ($BILLION)
TABLE 75.CHINA MOBILE WALLET MARKET, BY APPLICATIONS, 2019-2027 ($BILLION)
TABLE 76.CHINA MOBILE WALLET MARKET, BY END USER, 2019-2027 ($BILLION)
TABLE 77.AUSTRALIA MOBILE WALLET MARKET, BY TECHNOLOGY, 2019-2027 ($BILLION)
TABLE 78.AUSTRALIA MOBILE WALLET MARKET, BY TYPE, 2019-2027 ($BILLION)
TABLE 79.AUSTRALIA MOBILE WALLET MARKET, BY APPLICATIONS, 2019-2027 ($BILLION)
TABLE 80.AUSTRALIA MOBILE WALLET MARKET, BY END USER, 2019-2027 ($BILLION)
TABLE 81.INDIA MOBILE WALLET MARKET, BY TECHNOLOGY, 2019-2027 ($BILLION)
TABLE 82.INDIA MOBILE WALLET MARKET, BY TYPE, 2019-2027 ($BILLION)
TABLE 83.INDIA MOBILE WALLET MARKET, BY APPLICATIONS, 2019-2027 ($BILLION)
TABLE 84.INDIA MOBILE WALLET MARKET, BY END USER, 2019-2027 ($BILLION)
TABLE 85.SOUTH KOREA MOBILE WALLET MARKET, BY TECHNOLOGY, 2019-2027 ($BILLION)
TABLE 86.SOUTH KOREA MOBILE WALLET MARKET, BY TYPE, 2019-2027 ($BILLION)
TABLE 87.SOUTH KOREA MOBILE WALLET MARKET, BY APPLICATIONS, 2019-2027 ($BILLION)
TABLE 88.SOUTH KOREA MOBILE WALLET MARKET, BY END USER, 2019-2027 ($BILLION)
TABLE 89.REST OF ASIA-PACIFIC MOBILE WALLET MARKET, BY TECHNOLOGY, 2019-2027 ($BILLION)
TABLE 90.REST OF ASIA-PACIFIC MOBILE WALLET MARKET, BY TYPE, 2019-2027 ($BILLION)
TABLE 91.REST OF ASIA-PACIFIC MOBILE WALLET MARKET, BY APPLICATIONS, 2019-2027 ($BILLION)
TABLE 92.REST OF ASIA-PACIFIC MOBILE WALLET MARKET, BY END USER, 2019-2027 ($BILLION)
TABLE 93.LAMEA MOBILE WALLET MARKET, BY TECHNOLOGY, 2019-2027 ($BILLION)
TABLE 94.LAMEA MOBILE WALLET MARKET, BY TYPE, 2019-2027 ($BILLION)
TABLE 95.LAMEA MOBILE WALLET MARKET, BY APPLICATIONS, 2019-2027 ($BILLION)
TABLE 96.LAMEA MOBILE WALLET MARKET, BY END USER, 2019-2027 ($BILLION)
TABLE 97.LATIN AMERICA MOBILE WALLET MARKET, BY TECHNOLOGY, 2019-2027 ($BILLION)
TABLE 98.LATIN AMERICA MOBILE WALLET MARKET, BY TYPE, 2019-2027 ($BILLION)
TABLE 99.LATIN AMERICA MOBILE WALLET MARKET, BY APPLICATIONS, 2019-2027 ($BILLION)
TABLE 100.LATIN AMERICA MOBILE WALLET MARKET, BY END USER, 2019-2027 ($BILLION)
TABLE 101.MIDDLE EAST MOBILE WALLET MARKET, BY TECHNOLOGY, 2019-2027 ($BILLION)
TABLE 102.MIDDLE EAST MOBILE WALLET MARKET, BY TYPE, 2019-2027 ($BILLION)
TABLE 103.MIDDLE EAST MOBILE WALLET MARKET, BY APPLICATIONS, 2019-2027 ($BILLION)
TABLE 104.MIDDLE EAST MOBILE WALLET MARKET, BY END USER, 2019-2027 ($BILLION)
TABLE 105.AFRICA MOBILE WALLET MARKET, BY TECHNOLOGY, 2019-2027 ($BILLION)
TABLE 106.AFRICA MOBILE WALLET MARKET, BY TYPE, 2019-2027 ($BILLION)
TABLE 107.AFRICA MOBILE WALLET MARKET, BY APPLICATIONS, 2019-2027 ($BILLION)
TABLE 108.AFRICA MOBILE WALLET MARKET, BY END USER, 2019-2027 ($BILLION)
TABLE 109.KEY NEW TYPE LAUNCHES (2018-2020)
TABLE 110.TYPEDEVELOPMENT (2018-2020)
TABLE 111.COLLABORATION (2018-2020)
TABLE 112.ACQUISTION (2018-2020)
TABLE 113.PARTNERSHIP (2018-2020)
TABLE 114.BUSINESS EXPANSION (2018-2020)
TABLE 115.ALIPAY.COM.: COMPANY SNAPSHOT
TABLE 116.ALIBABA GROUP HOLDING LIMITED: OPERATING SEGMENTS
TABLE 117.ALIPAY.COM: PRODUCT PORTFOLIO
TABLE 118.AMAZON.COM INC.: KEY EXECUTIVES
TABLE 119.AMAZON.COM INC.: COMPANY SNAPSHOT
TABLE 120.AMAZON.COM INC.: OPERATING SEGMENTS
TABLE 121.AMAZON.COM INC.: PRODUCT PORTFOLIO
TABLE 122.AMERICAN EXPRESS COMPANY: COMPANY SNAPSHOT
TABLE 123.AMERICAN EXPRESS COMPANY: OPERATING SEGMENTS
TABLE 124.AMERICAN EXPRESS COMPANY: PRODUCT PORTFOLIO
TABLE 125.APPLE INC.: KEY EXECUTIVES
TABLE 126.APPLE INC.: COMPANY SNAPSHOT
TABLE 127.APPLE INC.: PRODUCT CATEGORIES
TABLE 128.APPLE INC.: PRODUCT PORTFOLIO
TABLE 129.AT&T INC.: KEY EXECUTIVES
TABLE 130.AT&T INC.: COMPANY SNAPSHOT
TABLE 131.AT&T INC.: OPERATING SEGMENTS
TABLE 132.AT&T INC.: PRODUCT PORTFOLIO
TABLE 133.AT&T INC.: KEY STRATEGIC MOVES AND DEVELOPMENTS
TABLE 134.GOOGLE LLC: KEY EXECUTIVES
TABLE 135.GOOGLE LLC: COMPANY SNAPSHOT
TABLE 136.ALPHABET INC.: OPERATING SEGMENTS
TABLE 137.ALPHABET INC.: PRODUCT PORTFOLIO
TABLE 138.MASTERCARD: KEY EXECUTIVES
TABLE 139.MASTERCARD: COMPANY SNAPSHOT
TABLE 140.MASTERCARD: PRODUCT PORTFOLIO
TABLE 141.PAYPAL HOLDINGS, INC. : KEY EXECUTIVES
TABLE 142.PAYPAL HOLDINGS, INC. : COMPANY SNAPSHOT
TABLE 143.PAYPAL HOLDINGS, INC. : PRODUCT PORTFOLIO
TABLE 144.SAMSUNG ELECTRONICS CO., LTD.: KEY EXECUTIVES
TABLE 145.SAMSUNG ELECTRONICS CO., LTD.: COMPANY SNAPSHOT
TABLE 146.SAMSUNG ELECTRONICS CO., LTD.: OPERATING SEGMENTS
TABLE 147.SAMSUNG ELECTRONICS CO., LTD.: PRODUCT PORTFOLIO
TABLE 148.VISA INC.: KEY EXECUTIVES
TABLE 149.VISA INC.: COMPANY SNAPSHOT
TABLE 150.VISA INC.: PRODUCT PORTFOLIO

LIST OF FIGURES

FIGURE 01.KEY MARKET SEGMENTS
FIGURE 02.MOBILE WALLET MARKET, 2019–2027
FIGURE 03.MOBILE WALLET MARKET, BY COUNTRY, 2019-2027
FIGURE 04.TOP IMPACTING FACTORS
FIGURE 05.TOP INVESTMENT POCKETS
FIGURE 06.MODERATE -TO-HIGH BARGAINING POWER OF SUPPLIERS
FIGURE 07.LOW-TO-HIGH BARGAINING POWER OF BUYERS
FIGURE 08.LOW-TO-HIGH THREAT OF SUBSTITUTES
FIGURE 09.LOW THREAT OF NEW ENTRANTS
FIGURE 10.LOW-TO-HIGH COMPETITIVE RIVALRY
FIGURE 11.MARKET DYNAMICS: GLOBAL MOBILE WALLET MARKET
FIGURE 12.OPPORTUNISTIC FORM FACTORS THAT WILL IMPACT THE EVOLUTION OF MOBILE PAYMENTS IN COMING YEARS
FIGURE 13.INDUSTRY ROADMAP OF GLOBAL MOBILE WALLET MARKET
FIGURE 14.IMPACT OF RETAIL REGULATIONS ON THE GLOBAL MOBILE WALLET MARKET
FIGURE 15.MOBILE WALLET MARKET, BY TYPE, 2019–2027 ($BILLION)
FIGURE 16.COMPARATIVE SHARE ANALYSIS OF MOBILE WALLET MARKET FOR PROXIMITY, BY COUNTRY, 2019 & 2027 (%)
FIGURE 17.COMPARATIVE SHARE ANALYSIS OF MOBILE WALLET MARKET FOR REMOTE, BY COUNTRY, 2019 & 2027 (%)
FIGURE 18.MOBILE WALLET MARKET, BY TECHNOLOGY, 2019–2027 ($BILLION)
FIGURE 19.COMPARATIVE SHARE ANALYSIS OF MOBILE WALLET MARKET FOR NEAR FIELD COMMUNICATION, BY COUNTRY, 2019 & 2027 (%)
FIGURE 20.COMPARATIVE SHARE ANALYSIS OF MOBILE WALLET MARKET FOR QR CODE, BY COUNTRY, 2019 & 2027 (%)
FIGURE 21.COMPARATIVE SHARE ANALYSIS OF MOBILE WALLET MARKET FOR TEXT BASED/ SHORT MESSAGE SERVICE, BY COUNTRY, 2019 & 2027 (%)
FIGURE 22.COMPARATIVE SHARE ANALYSIS OF MOBILE WALLET MARKET FOR DIGITAL ONLY, BY COUNTRY, 2019 & 2027 (%)
FIGURE 23.MOBILE WALLET MARKET, BY APPLICATIONS, 2019–2027 ($BILLION)
FIGURE 24.COMPARATIVE SHARE ANALYSIS OF MOBILE WALLET MARKET FOR HOSPITALITY & TRANSPORTATION, BY COUNTRY, 2019 & 2027 (%)
FIGURE 25.COMPARATIVE SHARE ANALYSIS OF MOBILE WALLET MARKET FOR MEDIA & ENTERTAINMENT, BY COUNTRY, 2019 & 2027 (%)
FIGURE 26.COMPARATIVE SHARE ANALYSIS OF MOBILE WALLET MARKET FOR RETAIL, BY COUNTRY,  2019 & 2027 (%)
FIGURE 27.COMPARATIVE SHARE ANALYSIS OF MOBILE WALLET MARKET FOR HEALTHCARE, BY COUNTRY,  2019 & 2027 (%)
FIGURE 28.COMPARATIVE SHARE ANALYSIS OF MOBILE WALLET MARKET FOR ENERGY & UTILITIES, BY COUNTRY,  2019 & 2027 (%)
FIGURE 29.COMPARATIVE SHARE ANALYSIS OF MOBILE WALLET MARKET FOR TELECOMMUNICATION, BY COUNTRY,  2019 & 2027 (%)
FIGURE 30.COMPARATIVE SHARE ANALYSIS OF MOBILE WALLET MARKET FOR OTHERS, BY COUNTRY, 2019 & 2027 (%)
FIGURE 31.MOBILE WALLET MARKET, BY END USER, 2019–2027 ($BILLION)
FIGURE 32.COMPARATIVE SHARE ANALYSIS OF MOBILE WALLET MARKET FOR PERSONAL, BY COUNTRY, 2019 & 2027 (%)
FIGURE 33.COMPARATIVE SHARE ANALYSIS OF MOBILE WALLET MARKET FOR BUSINESS, BY COUNTRY, 2019 & 2027 (%)
FIGURE 34.U.S. MOBILE WALLET MARKET, 2019-2027 ($BILLION)
FIGURE 35.CANADA MOBILE WALLET MARKET, 2019-2027 ($BILLION)
FIGURE 36.GERMANY MOBILE WALLET MARKET, 2019-2027 ($BILLION)
FIGURE 37.FRANCE MOBILE WALLET MARKET, 2019-2027 ($BILLION)
FIGURE 38.UK MOBILE WALLET MARKET, 2019-2027 ($BILLION)
FIGURE 39.SPAIN MOBILE WALLET MARKET, 2019-2027 ($BILLION)
FIGURE 40.ITALY MOBILE WALLET MARKET, 2019-2027 ($BILLION)
FIGURE 41.REST OF EUROPE MOBILE WALLET MARKET, 2019-2027 ($BILLION)
FIGURE 42.JAPAN MOBILE WALLET MARKET, 2019-2027 ($BILLION)
FIGURE 43.CHINA MOBILE WALLET MARKET, 2019-2027 ($BILLION)
FIGURE 44.AUSTRALIA MOBILE WALLET MARKET, 2019-2027 ($BILLION)
FIGURE 45.INDIA MOBILE WALLET MARKET, 2019-2027 ($BILLION)
FIGURE 46.SOUTH KOREA MOBILE WALLET MARKET, 2019-2027 ($BILLION)
FIGURE 47.REST OF ASIA-PACIFIC MOBILE WALLET MARKET, 2019-2027 ($BILLION)
FIGURE 48.LAMEA MOBILE WALLET MARKET, BY COUNTRY, 2019-2027 ($BILLION)
FIGURE 49.LATIN AMERICA MOBILE WALLET MARKET, 2019-2027 ($BILLION)
FIGURE 50.MIDDLE EAST MOBILE WALLET MARKET, 2019-2027 ($BILLION)
FIGURE 51.AFRICA MOBILE WALLET MARKET, 2019-2027 ($BILLION)
FIGURE 52.KEY PLAYER POSITIONING ANLYSIS: GLOBAL MOBILE WALLET MARKET
FIGURE 53.TOP WINNING STRATEGIES, BY YEAR, 2017-2020
FIGURE 54.TOP WINNING STRATEGIES, BY DEVELOPMENT, 2017-2020
FIGURE 55.TOP WINNING STRATEGIES, BY COMPANY, 2018-2020
FIGURE 56.COMPETITIVE DASHBOARD
FIGURE 57.COMPETITIVE DASHBOARD
FIGURE 58.COMPETITIVE HEATMAP OF KEY PLAYERS
FIGURE 59.ALIBABA GROUP HOLDING LIMITED: KEY EXECUTIVES
FIGURE 60.ALIBABA GROUP HOLDING LIMITED: REVENUE, 2017–2019 ($BILLION)
FIGURE 61.ALIBABA GROUP HOLDING LIMITED: REVENUE SHARE BY SEGMENT, 2019 (%)
FIGURE 62.AMAZON.COM, INC.: REVENUE, 2017–2019 ($BILLION)
FIGURE 63.AMAZON.COM, INC.: REVENUE SHARE BY SEGMENT, 2019 (%)
FIGURE 64.AMAZON.COM, INC.: REVENUE SHARE BY REGION, 2019 (%)
FIGURE 65.AMERICAN EXPRESS COMPANY: KEY EXECUTIVES
FIGURE 66.AMERICAN EXPRESS COMPANY: REVENUE, 2017–2019 ($BILLION)
FIGURE 67.AMERICAN EXPRESS COMPANY: REVENUE SHARE BY SEGMENT, 2019 (%)
FIGURE 68.AMERICAN EXPRESS COMPANY: REVENUE SHARE BY REGION, 2019 (%)
FIGURE 69.R&D EXPENDITURE, 2017–2019 ($BILLION)
FIGURE 70.APPLE INC.: REVENUE, 2017–2019 ($BILLION)
FIGURE 71.APPLE INC.: REVENUE SHARE BY SEGMENT, 2019 (%)
FIGURE 72.APPLE INC.: REVENUE SHARE BY REGION, 2019 (%)
FIGURE 73.R&D EXPENDITURE, 2017–2019 ($BILLION)
FIGURE 74.AT&T INC.: REVENUE, 2017–2019 ($BILLION)
FIGURE 75.AT&T INC.: REVENUE SHARE BY SEGMENT, 2019 (%)
FIGURE 76.AT&T INC.: REVENUE SHARE BY REGION, 2019 (%)
FIGURE 77.R&D EXPENDITURE, 2017–2019 ($BILLION)
FIGURE 78.ALPHABET INC.: REVENUE, 2017–2019 ($BILLION)
FIGURE 79.ALPHABET INC.: REVENUE SHARE BY SEGMENT, 2019 (%)
FIGURE 80.ALPHABET INC.: REVENUE SHARE BY REGION, 2019 (%)
FIGURE 81.MASTERCARD: REVENUE, 2017–2019 ($BILLION)
FIGURE 82.MASTERCARD: REVENUE SHARE BY REGION, 2019 (%)
FIGURE 83.R&D EXPENDITURE, 2017–2019 ($BILLION)
FIGURE 84.PAYPAL HOLDINGS, INC. : REVENUE, 2017–2019 ($BILLION)
FIGURE 85.PAYPAL HOLDINGS, INC.: REVENUE SHARE BY REGION, 2019 (%)
FIGURE 86.R&D EXPENDITURE, 2017–2019 ($BILLION)
FIGURE 87.SAMSUNG ELECTRONICS CO., LTD.: REVENUE, 2017–2019 ($BILLION)
FIGURE 88.SAMSUNG ELECTRONICS CO., LTD.: REVENUE SHARE BY SEGMENT, 2019 (%)
FIGURE 89.SAMSUNG ELECTRONICS CO., LTD.: REVENUE SHARE BY REGION, 2019 (%)
FIGURE 90.VISA INC.: REVENUE, 2017–2019 ($BILLION)
FIGURE 91.VISA INC.: REVENUE SHARE BY REGION, 2019 (%)


From the past decade,payment models havewitnessed a monumental shift from physical to digitalpayments. As the ecosystem of modern payment processingconsists of complex network of consumers, banks, merchants, and payment processors, the number of online sales, smart payment devices, and mobile payments have increased at a high rate. This has changed the way consumers search and pay for goods and services online as well as changed the way payment systems accept, secure, and facilitate payments.Thus, the mobile payment technology has evolved rapidly due to which the global mobile wallet market experiences growth at a significant rate from the recent years.

Mobile wallet innovations in terms of technology and applications have shaped the future of the payment methods of theconsumers. Consumers are inclined toward mobile wallet applications due to rise in digitalization trend, which has helped them to eliminate inconveniencesfrom the everyday/cash transactions. 

The ability of mobile wallets to store payment-related credentials and non-payment-related information boosts the adoption of mobile wallets as it provides a simple way to manage payments, participate in loyalty programs, track transactions, and other such benefits. It also eliminates the need to carry bank documents such as cards. The data stored of payment-related credentialsincludes credit/debit card, bank account details, and others and non-payment-related information includes loyalty cards, ticket information, and others, which helps the user to keep records of its transactional history.

The key players operating in the global mobile walletmarket include Amazon Web Services Inc., American Express Banking Corp., Apple Inc., Alipay.com, AT&T Inc., Google Inc., Mastercard Incorporated, PayPal Holdings, Inc., Samsung Electronics Co., Ltd, and VISA Inc.are some of the major companies profiled in the report.Major players have adopted various revenue and business growth strategies to enhance and develop their product portfolio, strengthen their mobile walletmarket share, and help them increase their market penetration.
 

PURCHASE OPTIONS

Call or Email us

U.S.-Canada Toll-free: +1-800-792-5285
Int'l : +1-503-894-6022
Europe : +44-845-528-1300
Email : help@alliedmarketresearch.com

Looking for Customization?

 Customization Request

Have a Question?

 Speak with Analyst

Any Confusion?

 Inquire Before Buying

Have a glance of the Report

  Request Sample
RELATED TAGS

Purchase Full Report of
Mobile Wallet Market

Start reading instantly.
This Report and over 66,965+ more Reports, Available with Avenue Library. T&C*.

  • Online Only
  • $3,456
  • Online cloud access only
  • Restricted print, copy, paste & download
  • Read only
  • Free industry update
    (Within 180 days)
  • Free report update in next update cycle
    (Apr 2021 - Apr 2022)
  • Data Pack
  • $3,840
  • Restricted to one authorized user
  • One print only
  • Available in
    Excel
  • Free industry update
    (Within 180 days)
  •   Free report update in next update cycle
    (Apr 2021 - Apr 2022)
  • Single User
  • $5,769
  • Restricted to one authorized user
  • One print only
  • Available in
    PDF
  • Free industry update
    (Within 180 days)
  •   Free report update in next update cycle
    (Apr 2021 - Apr 2022)
  • Five Users
  • $6,450
  • Limited to five authorized users
  • Print upto five copies
  • Available in
    PDF
  • Free industry update
    (Within 180 days)
  •   Free report update in next update cycle
    (Apr 2021 - Apr 2022)
  • Enterprise
    License/PDF

  • $10,995
  • Unlimited
    within
    company/enterprise
  • Available in Excel & PDF
  • Free industry update
    (Within 180 days)
  •   Free report update in next update cycle
    (Apr 2021 - Apr 2022)
  • Library
    Membership

  • $999 $ 1,175
    Per User/ Per month/ Billed annually
  • Published Content
    E-access
  • Company Profiles
    E-access
  • Newly Added Content Access
  • 10 PDF
    Downloads
  • 5 Excel Data
    Pack Downloads
  • 250 Company Profiles PDF Downloads
  • Buy Now

*Taxes/Fees, if applicable will be added during checkout. All prices in USD

RELATED REPORTS
 

Why Allied Market Research?


Infallible Methodology

To ensure high-level data integrity, accurate analysis, and impeccable forecasts

Analyst Support

For complete satisfaction

Customization

On-demand customization of scope of the report to exactly meet your needs

TARGETED MARKET VIEW

Targeted market view to provide pertinent information and save time of readers

Get fresh content delivered

Get insights on topics that are crucial for your business. Stay abreast of your interest areas.

Get Industry Data Alerts

Why Allied Market Research?

Infallible Methodology

To ensure high-level data integrity, accurate analysis, and impeccable forecasts

Analyst Support

For complete satisfaction

Customization

On-demand customization of scope of the report to exactly meet your needs

TARGETED MARKET VIEW

Targeted market view to provide pertinent information and save time of readers