
Mortgage Brokerage Services Market Research, 2033
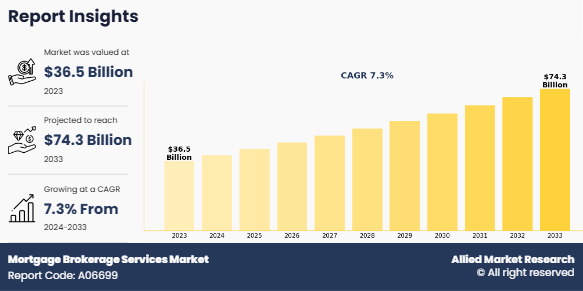
The global mortgage brokerage services market was valued at $36.5 billion in 2023, and is projected to reach $74.3 billion by 2033, growing at a CAGR of 7.3% from 2024 to 2033. Increasing adoption of digital platforms and online mortgage brokers, enhancing customer convenience and speeding up loan approvals. Additionally, there is a growing preference for personalized mortgage solutions, with brokers leveraging data analytics and artificial intelligence to offer more customized loan products and improve borrower experiences.
A mortgage broker is a licensed professional who assists borrowers and lenders in the process of obtaining a mortgage loan. They serve as professional advisors who help individuals or businesses navigate the complex landscape of mortgage financing. Mortgage brokers have a deep understanding of the mortgage brokerage services market, various loan products, and lending institutions. They work on behalf of the borrower to analyze their financial situation and goals, then leverage their network of lending partners to present a range of suitable loan options. These options may include different interest rates, terms, and conditions. In addition, mortgage brokers guide borrowers through the application process, helping them compile necessary documentation and ensuring that all requirements are met. Their objective is to facilitate a smooth and efficient transaction, ultimately assisting clients in securing a mortgage that aligns with their specific needs and financial circumstances.
The mortgage brokerage services industry is driven by the increasing complexity of mortgage products and regulations which has made it challenging for borrowers to navigate on their own. Mortgage brokers, with their expertise, simplify this process, helping clients understand different loan options and ensuring they meet regulatory requirements. Furthermore, brokers have access to a wide network of mortgage lenders, enabling them to offer borrowers a range of loan options with competitive rates. This empowers borrowers to compare and secure the most favorable mortgage terms available. In addition, there is a growing demand for personalized financial guidance in today's complex financial landscape, and mortgage brokers provide tailored advice based on clients' unique situations and goals. Therefore, these are the major driving factors for mortgage brokerage services market growth. However, the mortgage brokerage services market faces restraints such as intense competition due to its saturation, making it harder for individual brokers to stand out, and economic uncertainty or interest rate fluctuations, which can impact the demand for mortgage services. On the contrary, technological advancements and digital transformation present a significant opportunity for industry. Embracing digital platforms can enhance efficiency in the mortgage application process, allowing brokers to serve clients more effectively. Moreover, leveraging data analytics and artificial intelligence enables mortgage consulting to provide even more personalized and targeted financial advice, ultimately enhancing the overall customer experience.
Segment Review
The mortgage brokerage services market outlook is segmented on the basis of application, interest rate, distribution channel, end user, and region. On the basis of application, the mortgage brokerage services market is bifurcated into commercial property loans and residential property loans. By interest rate, the mortgage brokerage services industry is bifurcated into fixed rate and fluctuating rate. On the basis of distribution channel, the mortgage brokerage services market is segregated into online and offline. By end user,the mortgage brokerage services market is divided into individuals and businesses. On the basis of region, it is analyzed across North America, Europe, Asia-Pacific, and LAMEA.
By Application
The residential property loans segment attained the highest share in the mortgage brokerage services market size. This is because owning a home is an important goal for many individuals and families, and with time, more people are able to save up for a down payment or qualify for a mortgage. This growing demand for homes is expected to lead to an increase in the need for residential property loans, making it the fastest highest segment in the mortgage brokerage services market. On the other hand, the commercial property loans segment is attributed to be the fastest-growing segment during the forecast period. This is primarily because many businesses need loans to buy or improve their places of work, like offices or stores. These loans are usually bigger and can be more complex, so businesses often seek help from mortgage brokers to find the best deals.

By Region
North America attained the highest mortgage brokerage services market share in 2023, because it has a lot of well-established financial systems and a high number of people who want to buy homes or invest in properties. Many people in North America choose to take out loans to buy houses, and they often seek the help of mortgage brokers to find the best deals and options. On the other hand, Asia-Pacific is expected to be the fastest growing segment during the forecast period because this region has a large and rapidly growing population. As more people in Asia-Pacific are getting better jobs and earning more money, they are becoming more interested in buying homes or investing in properties. This increasing demand for property is expected to lead to a higher need for mortgage brokerage services, making the Asia-Pacific region the fastest-growing mortgage brokerage services market for these services.

The report focuses on growth prospects, restraints, and trends of the mortgage brokerage services market analysis. The study provides Porter’s five forces analysis to understand the impact of various factors, such as bargaining power of suppliers, competitive intensity of competitors, threat of new entrants, threat of substitutes, and bargaining power of buyers, on the mortgage brokerage services market.
Competition Analysis
The report analyzes the profiles of key players operating in the mortgage brokerage services market such as Bank of America, Flagstar Bank, Guild Mortgage Company, HDFC Bank Ltd., loanDepot.com, LLC, Meridian Capital Group, LLC, Mortgage Choice Pty Limited, Rocket Mortgage, United Wholesale Mortgage, Better Mortgage Corporation, Fairway Independent Mortgage Corporation, NerdWallet, Inc., Aussie Home Loans, Habito, Trussle, Freedom Mortgage Corporation, Redfin Mortgage, CrossCountry Mortgage, LLC, Guaranteed Rate Inc., and Wells Fargo. These players have adopted various strategies to increase their market penetration and strengthen their position in the mortgage brokerage services market.
Recent Partnerships in the Mortgage Brokerage Services Market
On October 20, 2023, Mortgage brokerage Resolve Finance and Funding.com.au (Funding) announced a new partnership to enhance opportunities for brokers and their clients, allowing Resolve Finance’s brokers to access Funding’s suite of bridging, business and building loan products. Funding specializes in short-term loans secured by property, which can allow borrowers to benefit from same-day approval and settlements within 48 hours. According to Funding, its state-based business development managers (BDMs) and Gold Coast-based credit team work closely with brokers to present flexible offerings while its proprietary built software platform allows for efficient credit underwriting.
Furthermore, on April 18, 2023, RESAAS Services Inc., a leading provider of technology solutions for the Real Estate Industry, announced a preliminary partnership with Rocket Mortgage Canada. Rocket Mortgage Canada is a digital mortgage broker, using technology to deliver a revolutionized mortgage process. The partnership introduces a unique way for real estate agents to add value to clients by offering access to a simplified mortgage process through Rocket Mortgage Canada.
Recent Product Launches in the Mortgage Brokerage Services Market
On November 7, 2023, GPARENCY, a pioneering force in the commercial real estate industry, introduced its full-service, game-changing Brokerage as a Services (BaaS) division. With a mandate to onboard mortgage brokers to meet mortgage brokerage services market demand, GPARENCY is seeking those aspiring to break into the field and experienced brokers looking for new opportunities to staff this division. This groundbreaking endeavor is set to redefine commercial real estate services by allowing clients to pay only half a point at closing. Simultaneously, it offers brokers an exceptional 80% commission rate and access to a wide range of products, addressing a common challenge faced by most brokers who typically have only one product in their portfolio.
Top Impacting Factors
Growth in demand for personalized financial guidance
In an increasingly complex financial landscape, individuals and businesses are recognizing the value of expert advice when it comes to mortgage financing. Mortgage brokers provide personalized guidance based on their clients' unique financial situations and long-term goals. They offer insights into the best strategies for achieving homeownership or optimizing existing mortgages, taking into account factors like credit history, income stability, and future financial plans. This tailored approach resonates with borrowers, fueling the demand for mortgage brokerage services. They take the time to get to know the borrowers' requirements. They ask questions and listen carefully to understand what the borrowers need and want in a mortgage. Then they use their expertise to find the best mortgage options available. This individualized approach helps borrowers to make smart decisions that fit their own circumstances. It gives them confidence in knowing that they are getting a mortgage that is right for them, which is incredibly important when it comes to purchasing a home.
Economic uncertainty and interest rate fluctuations
Economic fluctuations and shifts in interest rates can significantly impact the demand for mortgage brokerage services. During periods of economic uncertainty or rising interest rates, potential homebuyers may become more cautious, leading to a potential decrease in demand for mortgage services. Furthermore, when interest rates rise, borrowing becomes more expensive. This can deter potential buyers from entering the mortgage brokerage services market, as higher interest rates mean higher monthly mortgage payments. As a result, the demand for mortgage brokerage services may decrease during times of rising interest rates. Thus, economic conditions and interest rate movements can significantly influence the willingness of individuals to engage with the mortgage brokerage services market. These factors directly affect the revenue and profitability of mortgage brokers, making it crucial for them to adapt their strategies in response to changing economic circumstances.
Technological advancements and digital transformation
The integration of advanced technology and digital tools presents a significant opportunity for the mortgage brokerage services market. Adopting digital platforms can enhance the efficiency of the mortgage application process, allowing brokers to serve clients more effectively and appropriately. In addition, the use of data analytics and artificial intelligence can enable brokers to provide even more personalized and targeted financial advice. By leveraging these technological advancements, mortgage brokers can further differentiate themselves in a competitive market and enhance the overall customer experience.
Key Benefits For Stakeholders
This report provides a quantitative analysis of the market segments, current trends, estimations, and dynamics of the mortgage brokerage services market forecast from 2023 to 2033 to identify the prevailing mortgage brokerage services market opportunity.
The market research is offered along with information related to key drivers, restraints, and opportunities.
Porter's five forces analysis highlights the potency of buyers and suppliers to enable stakeholders make profit-oriented business decisions and strengthen their supplier-buyer network.
In-depth analysis of the mortgage brokerage services market segmentation assists to determine the prevailing market opportunity.
Major countries in each region are mapped according to their revenue contribution to the global market.
Market player positioning facilitates benchmarking and provides a clear understanding of the present position of the market players.
The report includes the analysis of the regional as well as global mortgage brokerage services market trends, key players, market segments, application areas, and market growth strategies.
Mortgage Brokerage Services Market Report Highlights
| Aspects | Details |
| Forecast period | 2023 - 2033 |
| Report Pages | 383 |
| By Application |
|
| By Interest Rate |
|
| By Distribution Channel |
|
| By End User |
|
| By Region |
|
| Key Market Players | movement mortgage, llc, Meridian Capital Group, LLC, Wells Fargo, Redfin Mortgage, AIGB Financing Broker LLC, Guild Mortgage Company, Rocket Mortgage, loanDepot.com, LLC, Better Mortgage Corporation, Fairway Independent Mortgage Corporation, Mortgage Choice Pty Limited, Habito, HDFC Bank Ltd., Flagstar Bank, CrossCountry Mortgage, LLC, Aussie Home Loans, NerdWallet, Inc., Freedom Mortgage Corporation, Pivotal Growth Limited, Bank of America Corporation |
Analyst Review
The mortgage brokerage services market is currently experiencing significant growth driven by several key factors and trends. The increasing complexity of the mortgage process and the wide array of available loan products have led consumers to seek professional guidance. Mortgage brokers, with their expertise and access to multiple lenders, offer borrowers a streamlined and informed experience. In addition, the continued low interest rate environment in many countries has driven a surge in homebuying activity, further boosting demand for brokerage services. Moreover, advancements in technology have revolutionized the way mortgage brokers operate. The integration of digital tools and platforms has enhanced efficiency in customer acquisition, document processing, and communication with both borrowers and lenders. This has not only improved the overall customer experience but has also allowed brokers to serve a broader clientele.
Another notable trend is the increasing emphasis on personalized, customer-centric approaches. Mortgage brokers are now focusing on understanding individual financial profiles and long-term goals to provide tailored solutions. This shift towards customization has helped build trust and loyalty among clients. In addition, regulatory changes and compliance requirements have played a significant role in shaping the mortgage brokerage ecosystem. Brokers are required to adhere to strict industry standards, ensuring transparency and accountability in their operations. This has instilled confidence in consumers, further fueling the market's growth. Furthermore, the COVID-19 pandemic has accelerated the adoption of remote and virtual processes in the mortgage industry.
With the widespread acceptance of online communication and document submission, brokers have been able to adapt to the changing ecosystem, providing convenient and accessible services to clients. Some key players profiled in the report include Bank of America, Flagstar Bank, Guild Mortgage Company, HDFC Bank Ltd., loanDepot.com, LLC, Meridian Capital Group, LLC, Mortgage Choice Pty Limited, Rocket Mortgage, United Wholesale Mortgage, and Wells Fargo. These players have adopted various strategies to increase their market penetration and strengthen their position in the mortgage brokerage services market.
The mortgage brokerage services market is estimated to grow at a CAGR of 7.3% from 2024 to 2033.
The mortgage brokerage services market is projected to reach $74.3 billion by 2033.
The mortgage brokerage services market is expected to witness notable growth including the increasing complexity of mortgage products and regulations which has made it challenging for borrowers to navigate on their own.
The key players profiled in the report include Bank of America, Flagstar Bank, Guild Mortgage Company, HDFC Bank Ltd., loanDepot.com, LLC, Meridian Capital Group, LLC, Mortgage Choice Pty Limited, Rocket Mortgage, United Wholesale Mortgage, Better Mortgage Corporation, Fairway Independent Mortgage Corporation, NerdWallet, Inc., Aussie Home Loans, Habito, Trussle, Freedom Mortgage Corporation, Redfin Mortgage, CrossCountry Mortgage, LLC, Guaranteed Rate Inc., and Wells Fargo.
The key growth strategies of mortgage brokerage services market players include product portfolio expansion, mergers & acquisitions, agreements, geographical expansion, and collaborations.
Loading Table Of Content...
Loading Research Methodology...

