
Mutual Fund Assets Market Research, 2034
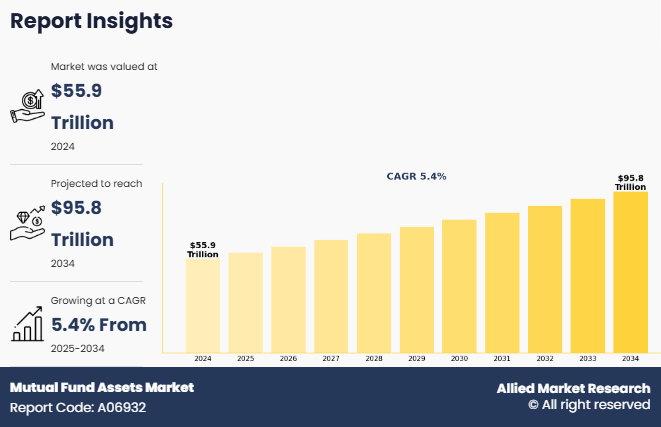
The global mutual fund assets market was valued at $55,851.0 billion in 2024, and is projected to reach $95,815.0 billion by 2034, growing at a CAGR of 5.4% from 2025 to 2034.
Mutual fund assets refer to the total market value of all the investments held by a mutual fund at a given time. This includes a variety of financial instruments such as stocks, bonds, money market securities, and other assets that the fund manager buys and manages on behalf of the investors. Commonly known as Assets Under Management (AUM), this value represents the overall size and financial strength of the mutual fund. The value of mutual fund assets fluctuates based on changes in market prices, as well as investor activity such as new investments into the fund (inflows) or withdrawals (outflows). A higher AUM often indicates greater investor confidence and fund performance, although it does not necessarily guarantee better returns.
Key Takeaways:
- By Fund Type, the equity funds segment held the largest share in the mutual fund assets market for 2024.
- By Distribution Channel, the financial advisors/brokers segment held the largest share in the mutual fund assets market for 2024.
- By Type, the active segment held the largest share in the mutual fund assets market for 2024.
- Region-wise, North America held the largest market share in 2024. However, LAMEA is expected to witness the highest CAGR during the forecast period.
Factors such as the rise in financial literacy and awareness, along with an increase in the use of digital distribution channels, positively impact the growth of the mutual fund assets market. In addition, the government's favorable regulatory framework, including tax benefits and investor protection policies, is expected to fuel the mutual fund assets market growth. Furthermore, the surge in the adoption of customized and goal-based products, such as retirement-focused and child-education mutual funds, is expected to create lucrative growth opportunities during the mutual fund assets market forecast period. Moreover, the increasing participation of millennials and Gen Z investors, driven by mobile-first investment platforms and robo-advisors, creates lucrative opportunities for the growth of the mutual fund assets market size.
Segment Review
The mutual fund assets market is segmented into fund type, distribution channel, type, and region. On the basis of fund type, the market is segregated into equity funds, bond funds, money market funds, hybrid and other funds. By distribution channel, the market is classified into banks, financial advisors/brokers, direct sellers, and others. Depending on the type, the market is divided into active and passive. Region wise, it is analyzed across North America, Europe, Asia-Pacific, and LAMEA.
On the basis of type, the global mutual fund assets market share was dominated by the active segment in 2024 and is expected to maintain its dominance in the upcoming years, owing to the increase in demand for personalized investment strategies and active risk management. In addition, there is a growing trend toward actively managed funds that seek to outperform benchmarks through skilled portfolio selection. However, the passive segment in the mutual fund assets market is expected to experience the highest growth during the forecast period. This segment is experiencing a surge in popularity due to its lower fees, transparency, and the increasing adoption of index-based investment approaches by both retail and institutional investors.
By region, North America dominated the mutual fund assets market share in 2024. This was due to the well-established financial infrastructure, high investor awareness, and strong presence of major asset management firms. However, LAMEA is expected to experience the fastest growth during the forecast period. The region is experiencing an increase in the adoption of investment products among a growing middle-class population, presenting numerous opportunities for financial inclusion, expansion of mutual fund offerings, and development of regulatory frameworks, which is expected to support the growth of the mutual fund assets market in the region.
Competition Analysis
The report analyzes the profiles of key players operating in the mutual fund assets market are BlackRock, Inc., The Vanguard Group, Inc., Charles Schwab & Co., Inc., JPMorgan Chase & Co., State Street Corporation, Deutsche Bank AG, Schroders plc, Franklin Templeton, Fidelity Investment, Invesco Ltd., T.Rowe Price Group, PIMCO, Capital Group, BNP Paribas, Goldman Sachs, Banco do Brasil, Sanlam investments, Nikko Asset Management Co., Ltd., Morgan Stanley, and Mirae Asset Financial Group. These players have adopted various strategies to strengthen their foothold in the mutual fund assets industry.
Recent Developments in the Mutual Fund Assets Market
In May 2025, Deutsche Bank partnered with Singapore-based AI firm finaXai to revolutionize the servicing of tokenized funds using advanced artificial intelligence. This collaboration is part of Project DAMA 2, a multi-chain asset servicing initiative aimed at streamlining fund lifecycle management for asset managers. By integrating machine learning, large language models (LLMs), and explainable AI, the partnership seeks to enhance speed, transparency, and precision in digital asset servicing. The initiative bridges academic research from NTU and NUS with real-world financial applications, marking a significant step toward more efficient and accessible tokenisation in asset management.
In April 2025, Fidelity Investments launched two new fixed income ETFs, Fidelity Municipal Bond Opportunities ETF (FMUB) and Fidelity Systematic Municipal Bond Index ETF (FMUN), to meet growing investor demand in the municipal bond market. These ETFs, listed on Nasdaq and available commission-free, are designed to offer tax-efficient income and liquidity. FMUB is actively managed, while FMUN follows a systematic index strategy. Both funds maintain the same investment approach as their predecessor mutual funds, adding approximately $229 million in assets to Fidelity’s ETF lineup. This move reinforces Fidelity’s leadership in fixed income management and expands its total ETF offerings to 78 strategies with $109 billion in assets.
Top Impacting Factors
Driver
Rising financial literacy and awareness
Rise in financial literacy and awareness among the general population is a significant factor driving the growth of the mutual fund assets market. This trend is largely influenced by proactive government and regulatory initiatives aimed at educating investors regarding financial products. For instance, campaigns such as “Mutual Funds Sahi Hai” in India and investor education programs by regulators such as SEBI and the SEC have been instrumental in simplifying investment concepts and building trust among retail investors. In addition, the widespread availability of digital content, including educational videos, blogs, podcasts, and finance-focused influencers, has made financial knowledge more accessible to the masses, even in regional languages.
Furthermore, employee financial wellness programs in a workplace environment promote investment literacy, especially regarding retirement planning and systematic investment options such as SIPs. This shift in awareness is gradually changing the traditional savings mindset, with more individuals moving away from fixed deposits, gold, and real estate toward market-linked instruments such as mutual funds. Moreover, increase in media coverage of mutual funds, fund manager insights, and investment strategies further enhances public knowledge and confidence. Enhanced transparency in the mutual fund aseets market, driven by comprehensive disclosures and independent performance evaluations, contributes significantly to building investor confidence. In addition, positive recommendations and social proof from successful retail investors who have benefitted from mutual fund investments encourage others to enter the market, thus supporting the growth of the mutual fund assets market.
Restraints
Lack of personalized advisory
The major challenge for the growth of the global mutual fund assets market is the lack of personalized advisory services. While mutual funds are increasingly becoming popular among retail investors for their diversification benefits and professional management, many investors still struggle to make informed decisions due to the absence of tailored financial guidance. The "one-size-fits-all" approach adopted by many financial institutions fails to account for individual risk tolerance, investment goals, time horizons, and financial literacy levels. As a result, potential investors may either avoid mutual funds altogether or invest in products that are not aligned with their needs, leading to dissatisfaction or suboptimal returns. In emerging markets especially, where financial awareness is still developing, the lack of personalized advisory is even more detrimental, which restrains the mutual fund assets market growth. Investors often rely on informal sources or fall prey to mis-selling due to limited access to trustworthy and customized advice. Moreover, digital platforms, while improving access to information, often lack the human touch and contextual understanding required for effective advisory, impeding the growth of the mutual fund assets market. To overcome this hurdle, there is a growing need for integrating technology with personalized advisory leveraging AI and data analytics to offer scalable, yet individualized recommendations. Enhancing investor education and building trust through transparent, client-centric advisory models is essential in driving the growth of the mutual fund assets industry.
Opportunity
Customized and goal-based products
Increase in the adoption of customized and goal-based products is expected to create mutual fund assets market opportunity, driven by evolving investor expectations and advancements in technology. Modern investors, especially millennials and Gen Z are increasingly focused on aligning their investments with personal life goals like homeownership, retirement, or education funding. Rather than settling for traditional, one-size-fits-all mutual funds, they seek customized solutions that reflect their unique financial objectives, risk tolerance, and timelines. This shift is driving demand for more personalized, goal-based investment products. In addition, robo-advisory platforms enabling seamless personalization allow investors to receive tailored advice and rebalancing strategies without needing full-time human advisors, thus creating a favorable environment for the growth of the mutual fund assets market.
Furthermore, the mutual fund assets market outlook indicates that the integration of advancements in technology, such as data analytics and AI, enables asset managers to offer personalized portfolios at scale, leading to the creation of goal-based mutual fund products that dynamically adapt to an investor’s life stage and changing market conditions. For instance, in May 2025, Deutsche Bank partnered with Singapore-based AI firm finaXai to enhance the servicing of tokenized funds using advanced AI technologies. This collaboration is part of Project DAMA 2, which aims to streamline asset servicing through blockchain and explainable AI. Co-founded by researchers from NTU and NUS, finaXai will help integrate machine learning and large language models into fund lifecycle management, improving speed, transparency, and precision. The initiative bridges academic innovation with real-world financial applications, aiming to simplify complex processes and support the growing adoption of digital assets. This partnership is expected to streamline fund servicing by combining AI and blockchain for greater speed, transparency, and precision. It aims to enhance portfolio management, support tokenized assets, and set new standards for digital asset adoption in asset management.
Key Benefits for Stakeholders
This report provides a quantitative analysis of the market segments, current trends, estimations, and dynamics of the mutual fund assets market analysis from 2024 to 2034 to identify the prevailing mutual fund assets market opportunities.
The market research is offered along with information related to key drivers, restraints, and opportunities.
Porter's five forces analysis highlights the potency of buyers and suppliers to enable stakeholders make profit-oriented business decisions and strengthen their supplier-buyer network.
In-depth analysis of the mutual fund assets market segmentation assists to determine the prevailing market opportunities.
Major countries in each region are mapped according to their revenue contribution to the global market.
Market player positioning facilitates benchmarking and provides a clear understanding of the present position of the market players.
The report includes the analysis of the regional as well as global mutual fund assets market trends, key players, market segments, application areas, and market growth strategies.
Mutual Fund Assets Market Report Highlights
| Aspects | Details |
| Market Size By 2034 | USD 95.8 trillion |
| Growth Rate | CAGR of 5.4% |
| Forecast period | 2024 - 2034 |
| Report Pages | 256 |
| By FUND TYPE |
|
| By DISTRIBUTION CHANNEL |
|
| By TYPE |
|
| By Region |
|
| Key Market Players | Nikko Asset Management Co., Ltd., BlackRock, Inc., Capital Group, The Vanguard Group, Inc., Invesco Ltd., PIMCO, Sanlam Investments, BNP Paribas, Banco do Brasil S.A., Charles Schwab & Co., Inc., Franklin Templeton, JPMorgan Chase & Co., Goldman Sachs, Morgan Stanley, State Street Corporation, Fidelity Investment, Mirae Asset Financial Group, T. Rowe Price Group, Inc., Schroders plc, Deutsche Bank AG |
Analyst Review
The mutual fund assets market is experiencing significant growth, driven by multiple key factors. Rise in financial literacy and awareness among retail investors has encouraged more individuals to explore mutual funds as a viable investment option, thus driving the growth of the market. In addition, the rise of digital platforms and fintech innovations has made investing more accessible and convenient, enabling investors to easily research, invest, and manage their portfolios online. Furthermore, favorable economic conditions, including stable interest rates and steady GDP growth, have boosted investor confidence. Regulatory reforms aimed at enhancing transparency and investor protection have further strengthened trust in mutual funds. Moreover, the growing preference for systematic investment plans (SIPs) and diversified asset allocation strategies is contributing to sustained inflows, making mutual funds a preferred choice for wealth creation over the long term.
Furthermore, technological advancements are playing a crucial role in accelerating the growth of the mutual fund assets market. The integration of artificial intelligence (AI) and machine learning (ML) in investment platforms is enabling more personalized and data-driven portfolio recommendations, helping investors make smarter decisions. Mobile apps and robo-advisors have simplified the investment process, allowing users to start investing with minimal paperwork and lower entry barriers. Blockchain technology is also being explored to increase transparency and reduce transaction costs, enhancing overall efficiency. Moreover, real-time data analytics and automated reporting tools provide investors with up-to-date insights and performance tracking, boosting engagement and trust. These technological innovations are transforming the mutual fund industry by making it more user-friendly, efficient, and accessible, thereby attracting a broader and more diverse investor base.
Moreover, supportive government initiatives and evolving regulatory frameworks aimed at fostering investor protection and market transparency are significantly contributing to the expansion of the mutual fund assets market. Governments and regulatory bodies are actively promoting financial inclusion by launching awareness campaigns and simplifying investment processes, encouraging participation from a wider demographic, including first-time and small investors. Policies focused on tax incentives for mutual fund investments, such as deductions and exemptions, are further motivating individuals to allocate more funds toward mutual schemes. In addition, stricter regulations on fund disclosures, risk management, and compliance standards ensure higher accountability among asset managers, which enhances investor confidence. The introduction of streamlined KYC norms and digitization of regulatory filings also reduces administrative hurdles, making it easier and safer for investors to enter and stay invested in mutual funds over the long term.
The mutual fund assets market is expected to witness notable growth due to rise in financial literacy and awareness along with increase in the use of digital distribution channels.
The mutual fund assets market is projected to reach $95,815.0 billion by 2034.
The mutual fund assets market is estimated to grow at a CAGR of 5.4% from 2025 to 2034.
The key players profiled in the report include BlackRock, Inc., The Vanguard Group, Inc., Charles Schwab & Co., Inc., JPMorgan Chase & Co., State Street Corporation, Deutsche Bank AG, Schroders plc, Franklin Templeton, Fidelity Investment, Invesco Ltd., T.Rowe Price Group, PIMCO, Capital Group, BNP Paribas, Goldman Sachs, Banco do Brasil, Sanlam investments, Nikko Asset Management Co., Ltd., Morgan Stanley, and Mirae Asset Financial Group.
The key growth strategies of mutual fund assets market players include product portfolio expansion, mergers & acquisitions, agreements, geographical expansion, and collaborations.
Loading Table Of Content...
Loading Research Methodology...

