Report Code: A12854 | Aug 2021 | Pages: 200 | ||
Tables: 87 | Charts: 48 |
|
Pandemic disrupted the entire world and affected many industries.
Get detailed COVID-19 impact analysis on the Nano Battery Market
Request Now !
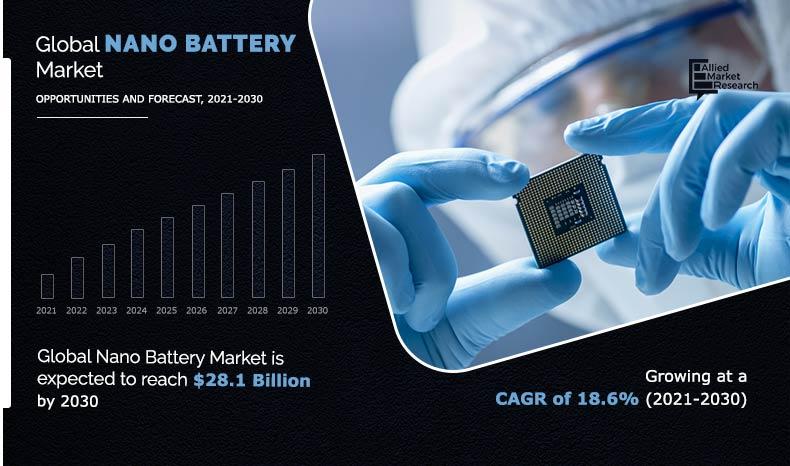
The global nano battery market size was valued at $5.1 billion in 2020, and is expected to reach $28.1 billion by 2030, registering a CAGR of 18.6% from 2021 to 2030. Batteries manufactured using nano scale materials and components with size less than 100 nanometers are known as nano batteries. Nano batteries find applications in power portable electronic devices, such as mobile phones, digital cameras, laptops, electric vehicles, military equipment and others, owing to reduced size and weight of the batteries. Types of battery technologies in the production of nano battery include Li-ion technology, nano pore technology, and nano-phosphate technology
The COVID-19 outbreak has impacted negatively on the Global Nano Battery Market. This is attributed to decline in demand for consumer electronics, electric vehicles, and other energy storage applications and temporary shutdown of industrial operations across the globe in the year 2020.
The growth of the global nano battery market is driven by rise in demand for energy storage systems in various applications including electronic devices, electric vehicles, military equipment, and others. In addition, use of nano materials to separate liquids in the battery from the electrodes increases the shelf life of battery, which in turn is projected to propel the demand for nano batteries from 2021 to 2030.
However, disadvantages of nano batteries such as low density, high manufacturing cost, high surface area, complex manufacturing process and others, are the key factors expected to restrain the growth of the global market in the upcoming years. On the contrary, rapid transition of conventional power generation to renewable power generation increases the need for energy storage systems, which is anticipated to provide lucrative growth opportunities for the key players to maintain their position in the market during the analyzed time frame.
The global nano battery market is segmented into technology, application, and region. Depending on technology, the market is classified into nano phosphate, nano pore, and lithium-ion. On the basis of application, it is categorized into consumer electronics, military, power tools & industrial, renewables & grid energy, transport, and others. Region wise, it is analyzed across North America, Europe, Asia-Pacific, and LAMEA.
The global market covers in-depth information about the major nano battery industry participants. Some of the major players in the market include Naxin New Energy Technology Co., Ltd., mPhase Technologies, Front Edge Technology, A123 Systems LLC, Altairnano, Amprius Technologies, US Photonics Inc., California Lithium Battery, Sicona Battery Technology, and Kokam.
Other players operating in the value chain of the global nano battery market are Asystems, Ecolocap Solutions, EnerG2, Zpower, Genesis Nanotech, In Step Nano Power and others.
The key players are adopting numerous strategies such as product launch, agreement, partnership, acquisition, and business expansion, to stay competitive in the market.
For instance, in October 2019, Amprius Technologies partnered with Airbus Defense and Space. This partnership boosted the development of new generation batteries based on silicon nanowire anode technology. In addition, this partnership strengthened the link between these two market leaders.
The nano battery market is analyzed and estimated in accordance with the impacts of the drivers, restraints, and opportunities. The period studied in this report is 2021–2030. The report includes the study of the market with respect to the growth prospects and restraints based on the regional analysis. The study includes Porter’s five forces analysis of the industry to determine the impact of suppliers, competitors, new entrants, substitutes, and buyers on the market growth.
By technology, the lithium-ion segment held the largest nano battery market share in 2020. This is owing to increase in demand for lithium-ion batteries from various applications including consumer electronics, power tools, aerospace & defense, renewable & grid energy storage, automotive and others. In addition, advantages of using nanotechnology in the production of lithium-ion battery such as increase in battery capacity and decrease in battery charging time, are anticipated to propel the growth of the market during the analyzed timeframe.
On the basis of application, the military segment dominated the global market in 2020, in terms of share, and is expected to maintain its dominance through the forecast period. This growth is attributed to rise in need for efficient power electronics devices due to increase in digitalization of battlefield and reduction in size & weight of military equipment in the U.S. In addition, rise in demand for nano batteries from weapons, military vehicles, portable power, sensors, remote activation, programmable power, and backup power applications, is anticipated to fuel the growth of the market during the analyzed time frame.
North America garnered the highest share in the nano battery market in 2020, in terms of revenue, and is anticipated to maintain its dominance throughout the forecast period. This is attributed to numerous factors such as presence of huge consumer base and the existence of key players in the region. Moreover, rapid growth of military, electric vehicle, and renewable energy in the region are anticipated to contribute toward growth of the market in North America.
Lockdown imposed due to the outbreak of COVID-19 pandemic resulted in temporary ban on import & export and manufacturing & processing activities across various industries, which decreased the demand for nano batteries from these consumers. This resulted in decline in market growth in the second, third, and fourth quarters of 2020. However, the nano battery market is expected to recover by the second quarter of 2021 as COVID-19 vaccination has started in various economies across the globe, which is expected to improve the global economy.
Key Benefits For Stakeholders
Key Market Segments
By Technology
By Application
By Region
Nano Battery Market Report Highlights
Aspects | Details |
---|---|
By TECHNOLOGY |
|
By APPLICATION |
|
By Region |
|
Key Market Players | FRONT EDGE TECHNOLOGY, U.S. PHOTONICS INCORPORATED, SOLAREDGE TECHNOLOGIES LTD., A123 SYSTEMS LLC, AMPRIUS TECHNOLOGIES, ALTAIRNANO, CALIFORNIA LITHIUM BATTERY, SICONA BATTERY TECHNOLOGIES, mPHASE TECHNOLOGIES, NAXIN NEW ENERGY TECHNOLOGY CO., LTD. |
CHAPTER 1:INTRODUCTION
1.1.Report description
1.2.Key benefits for stakeholders
1.3.Key market segments
1.4.Research methodology
1.4.1.Primary research
1.4.2.Secondary research
1.4.3.Analyst tools and models
CHAPTER 2:EXECUTIVE SUMMARY
2.1.Key findings
2.2.CXO perspective
CHAPTER 3:MARKET OVERVIEW
3.1.Market definition and scope
3.2.Key forces shaping the market
3.3.Value chain analysis
3.4.Top investment pockets
3.5.Patent analysis
3.5.1.By region, 2013–2019
3.6.Market dynamics
3.6.1.Drivers
3.6.1.1.Advantages associated with nanotechnology in the manufacturing of batteries
3.6.1.2.Rise in demand for nano batteries from various end use industries
3.6.2.Restraints
3.6.2.1.Difficulties associated with manufacturing of nano materials used in batteries
3.6.3.Opportunity
3.6.3.1.Rise in investment and R&D towards nano scale components in battery technology
3.7.Impact of government regulations on the market
3.8.Impact of COVID-19 outbreak on the market
CHAPTER 4:NANO BATTERY MARKET, BY TECHNOLOGY
4.1.Overview
4.1.1.Market size and forecast
4.2.Nano Phosphate
4.2.1.Key market trends, growth factors, and opportunities
4.2.2.Market size and forecast, by region
4.2.3.Market share analysis, by country
4.3.Nano pore
4.3.1.Key market trends, growth factors, and opportunities
4.3.2.Market size and forecast, by region
4.3.3.Market share analysis, by country
4.4.Lithium-ion (Li-ion)
4.4.1.Key market trends, growth factors, and opportunities
4.4.2.Market size and forecast, by region
4.4.3.Market share analysis, by country
CHAPTER 5:NANO BATTERY MARKET, BY APPLICATION
5.1.Overview
5.1.1.Market size and forecast
5.2.Consumer electronics
5.2.1.Key market trends, growth factors, and opportunities
5.2.2.Market size and forecast, by region
5.2.3.Market share analysis, by country
5.3.Military
5.3.1.Key market trends, growth factors, and opportunities
5.3.2.Market size and forecast, by region
5.3.3.Market share analysis, by country
5.4.Power tools and industrial
5.4.1.Key market trends, growth factors, and opportunities
5.4.2.Market size and forecast, by region
5.4.3.Market share analysis, by country
5.5.Renewables and grid energy
5.5.1.Key market trends, growth factors, and opportunities
5.5.2.Market size and forecast, by region
5.5.3.Market share analysis, by country
5.6.Transport
5.6.1.Key market trends, growth factors, and opportunities
5.6.2.Market size and forecast, by region
5.6.3.Market share analysis, by country
5.7.Others
5.7.1.Key market trends, growth factors, and opportunities
5.7.2.Market size and forecast, by region
5.7.3.Market share analysis, by country
CHAPTER 6:NANO BATTERY MARKET, BY REGION
6.1.Overview
6.1.1.Market size and forecast
6.2.North America
6.2.1.Key market trends, growth factors, and opportunities
6.2.2.Market size and forecast, by technology
6.2.3.Market size and forecast, by application
6.2.4.Market share analysis, by country
6.2.5.U.S.
6.2.5.1.Market size and forecast, by technology
6.2.5.2.Market size and forecast, by application
6.2.6.Canada
6.2.6.1.Market size and forecast, by technology
6.2.6.2.Market size and forecast, by application
6.2.7.Mexico
6.2.7.1.Market size and forecast, by technology
6.2.7.2.Market size and forecast, by application
6.3.Europe
6.3.1.Key market trends, growth factors, and opportunities
6.3.2.Market size and forecast, by technology
6.3.3.Market size and forecast, by application
6.3.4.Market share analysis, by country
6.3.5.Germany
6.3.5.1.Market size and forecast, by technology
6.3.5.2.Market size and forecast, by application
6.3.6.UK
6.3.6.1.Market size and forecast, by technology
6.3.6.2.Market size and forecast, by application
6.3.7.France
6.3.7.1.Market size and forecast, by technology
6.3.7.2.Market size and forecast, by application
6.3.8.Spain
6.3.8.1.Market size and forecast, by technology
6.3.8.2.Market size and forecast, by application
6.3.9.Italy
6.3.9.1.Market size and forecast, by technology
6.3.9.2.Market size and forecast, by application
6.3.10.Rest of Europe
6.3.10.1.Market size and forecast, by technology
6.3.10.2.Market size and forecast, by application
6.4.Asia-Pacific
6.4.1.Key market trends, growth factors, and opportunities
6.4.2.Market size and forecast, by technology
6.4.3.Market size and forecast, by application
6.4.4.Market share analysis, by country
6.4.5.China
6.4.5.1.Market size and forecast, by technology
6.4.5.2.Market size and forecast, by application
6.4.6.Japan
6.4.6.1.Market size and forecast, by technology
6.4.6.2.Market size and forecast, by application
6.4.7.India
6.4.7.1.Market size and forecast, by technology
6.4.7.2.Market size and forecast, by application
6.4.8.Australia
6.4.8.1.Market size and forecast, by technology
6.4.8.2.Market size and forecast, by application
6.4.9.South Korea
6.4.9.1.Market size and forecast, by technology
6.4.9.2.Market size and forecast, by application
6.4.10.Rest of Asia-Pacific
6.4.10.1.Market size and forecast, by technology
6.4.10.2.Market size and forecast, by application
6.5.LAMEA
6.5.1.Key market trends, growth factors, and opportunities
6.5.2.Market size and forecast, by technology
6.5.3.Market size and forecast, by application
6.5.4.Market share analysis, by country
6.5.5.Latin America
6.5.5.1.Market size and forecast, by technology
6.5.5.2.Market size and forecast, by application
6.5.6.Middle East
6.5.6.1.Market size and forecast, by technology
6.5.6.2.Market size and forecast, by application
6.5.7.Africa
6.5.7.1.Market size and forecast, by technology
6.5.7.2.Market size and forecast, by application
CHAPTER 7:COMPETITIVE LANDSCAPE
7.1.Introduction
7.1.1.Market Player Positioning, 2020
7.2.Top winning strategies
7.2.1.Top winning strategies, by year
7.2.2.Top winning strategies, by development
7.2.3.Top winning strategies, by company
7.3.Product Mapping of Top 10 Player
7.4.Competitive Heatmap
7.5.Key developments
7.5.1.New product launch
7.5.2.Collaboration
7.5.3.Partnership
CHAPTER 8:COMPANY PROFILES
8.1.ALTAIRNANO
8.1.1.Company overview
8.1.2.Company snapshot
8.1.3.Product portfolio
8.2.AMPRIUS TECHNOLOGIES
8.2.1.Company overview
8.2.2.Company snapshot
8.2.3.Product portfolio
8.2.5.Key strategic moves and developments
8.3.A123 SYSTEMS LLC
8.3.1.Company overview
8.3.2.Company snapshot
8.3.3.Product portfolio
8.4.CALIFORNIA LITHIUM BATTERY
8.4.1.Company overview
8.4.2.Company snapshot
8.4.3.Product portfolio
8.5.FRONT EDGE TECHNOLOGY
8.5.1.Company overview
8.5.2.Company snapshot
8.5.3.Product portfolio
8.6.mPHASE TECHNOLOGIES
8.6.1.Company overview
8.6.2.Company Snapshot
8.6.3.Product portfolio
8.7.NAXIN NEW ENERGY TECHNOLOGY CO., LTD.
8.7.1.Company overview
8.7.2.Company snapshot
8.7.3.Product portfolio
8.8.SICONA BATTERY TECHNOLOGIES
8.8.1.Company overview
8.8.2.Company Snapshot
8.8.3.Product portfolio
8.8.5.Key strategic moves and developments
8.9.SOLAREDGE TECHNOLOGIES LTD.
8.9.1.Company overview
8.9.2.Company snapshot
8.9.3.Operating business segments
8.9.4.Product portfolio
8.9.5.Business performance
8.10.U.S. PHOTONICS INCORPORATED
8.10.1.Company overview
8.10.2.Company snapshot
8.10.3.Product portfolio
LIST OF TABLES
TABLE 01.GLOBAL NANO BATTERY MARKET, BY TECHNOLOGY, 2020–2030 ($MILLION)
TABLE 02.NANO PHOSPHATE BATTERY MARKET, BY REGION, 2020–2030 ($MILLION)
TABLE 03.NANO PORE BATTERY MARKET, BY REGION, 2020–2030 ($MILLION)
TABLE 04.LITHIUM-ION NANO BATTERY MARKET, BY REGION, 2020–2030 ($MILLION)
TABLE 05.GLOBAL NANO BATTERY MARKET, BY APPLICATION, 2020–2030 ($MILLION)
TABLE 06.NANO BATTERY MARKET FOR CONSUMER ELECTRONICS, BY REGION, 2020–2030 ($MILLION)
TABLE 07.NANO BATTERY MARKET FOR MILITARY, BY REGION, 2020–2030 ($MILLION)
TABLE 08.NANO BATTERY MARKET FOR POWER TOOLS AND INDUSTRIAL, BY REGION, 2020–2030 ($MILLION)
TABLE 09.NANO BATTERY MARKET FOR RENEWABLES AND GRID ENERGY, BY REGION, 2020–2030 ($MILLION)
TABLE 10.NANO BATTERY MARKET FOR TRANSPORT, BY REGION, 2020–2030 ($MILLION)
TABLE 11.NANO BATTERY MARKET FOR OTHERS, BY REGION, 2020–2030 ($MILLION)
TABLE 12.NANO BATTERY MARKET, BY REGION, 2020-2030 ($MILLION)
TABLE 13.NORTH AMERICA NANO BATTERY MARKET, BY TECHNOLOGY, 2020–2030 ($MILLION)
TABLE 14.NORTH AMERICA NANO BATTERY MARKET, BY APPLICATION, 2020–2030 ($MILLION)
TABLE 15.NORTH AMERICA NANO BATTERY MARKET, BY COUNTRY, 2020–2030 ($MILLION)
TABLE 16.U.S. NANO BATTERY MARKET, BY TECHNOLOGY, 2020–2030 ($MILLION)
TABLE 17.U.S. NANO BATTERY MARKET, BY APPLICATION, 2020–2030 ($MILLION)
TABLE 18.CANADA NANO BATTERY MARKET, BY TECHNOLOGY, 2020–2030 ($MILLION)
TABLE 19.CANADA NANO BATTERY MARKET, BY APPLICATION, 2020–2030 ($MILLION)
TABLE 20.MEXICO NANO BATTERY MARKET, BY TECHNOLOGY, 2020–2030 ($MILLION)
TABLE 21.MEXICO NANO BATTERY MARKET, BY APPLICATION, 2020–2030 ($MILLION)
TABLE 22.EUROPE NANO BATTERY MARKET, BY TECHNOLOGY, 2020–2030 ($MILLION)
TABLE 23.EUROPE NANO BATTERY MARKET, BY APPLICATION, 2020–2030 ($MILLION)
TABLE 24.EUROPE NANO BATTERY MARKET, BY COUNTRY, 2020–2030 ($MILLION)
TABLE 25.GERMANY NANO BATTERY MARKET, BY TECHNOLOGY, 2020–2030 ($MILLION)
TABLE 26.GERMANY NANO BATTERY MARKET, BY APPLICATION, 2020–2030 ($MILLION)
TABLE 27.UK NANO BATTERY MARKET, BY TECHNOLOGY, 2020–2030 ($MILLION)
TABLE 28.UK NANO BATTERY MARKET, BY APPLICATION, 2020–2030 ($MILLION)
TABLE 29.FRANCE NANO BATTERY MARKET, BY TECHNOLOGY, 2020–2030 ($MILLION)
TABLE 30.FRANCE NANO BATTERY MARKET, BY APPLICATION, 2020–2030 ($MILLION)
TABLE 31.SPAIN NANO BATTERY MARKET, BY TECHNOLOGY, 2020–2030 ($MILLION)
TABLE 32.SPAIN NANO BATTERY MARKET, BY APPLICATION, 2020–2030 ($MILLION)
TABLE 33.ITALY NANO BATTERY MARKET, BY TECHNOLOGY, 2020–2030 ($MILLION)
TABLE 34.ITALY NANO BATTERY MARKET, BY APPLICATION, 2020–2030 ($MILLION)
TABLE 35.REST OF EUROPE NANO BATTERY MARKET, BY TECHNOLOGY, 2020–2030 ($MILLION)
TABLE 36.REST OF EUROPE NANO BATTERY MARKET, BY APPLICATION, 2020–2030 ($MILLION)
TABLE 37.ASIA-PACIFIC NANO BATTERY MARKET, BY TECHNOLOGY, 2020–2030 ($MILLION)
TABLE 38.ASIA-PACIFIC NANO BATTERY MARKET, BY APPLICATION, 2020–2030 ($MILLION)
TABLE 39.ASIA-PACIFIC NANO BATTERY MARKET, BY COUNTRY, 2020–2030 ($MILLION)
TABLE 40.CHINA NANO BATTERY MARKET, BY TECHNOLOGY, 2020–2030 ($MILLION)
TABLE 41.CHINA NANO BATTERY MARKET, BY APPLICATION, 2020–2030 ($MILLION)
TABLE 42.JAPAN NANO BATTERY MARKET, BY TECHNOLOGY, 2020–2030 ($MILLION)
TABLE 43.JAPAN NANO BATTERY MARKET, BY APPLICATION, 2020–2030 ($MILLION)
TABLE 44.INDIA NANO BATTERY MARKET, BY TECHNOLOGY, 2020–2030 ($MILLION)
TABLE 45.INDIA NANO BATTERY MARKET, BY APPLICATION, 2020–2030 ($MILLION)
TABLE 46.AUSTRALIA NANO BATTERY MARKET, BY TECHNOLOGY, 2020–2030 ($MILLION)
TABLE 47.AUSTRALIA NANO BATTERY MARKET, BY APPLICATION, 2020–2030 ($MILLION)
TABLE 48.SOUTH KOREA NANO BATTERY MARKET, BY TECHNOLOGY, 2020–2030 ($MILLION)
TABLE 49.SOUTH KOREA NANO BATTERY MARKET, BY APPLICATION, 2020–2030 ($MILLION)
TABLE 50.REST OF ASIA-PACIFIC NANO BATTERY MARKET, BY TECHNOLOGY, 2020–2030 ($MILLION)
TABLE 51.REST OF ASIA-PACIFIC NANO BATTERY MARKET, BY APPLICATION, 2020–2030 ($MILLION)
TABLE 52.LAMEA NANO BATTERY MARKET, BY TECHNOLOGY, 2020–2030 ($MILLION)
TABLE 53.LAMEA NANO BATTERY MARKET, BY APPLICATION, 2020–2030 ($MILLION)
TABLE 54.LAMEA NANO BATTERY MARKET, BY COUNTRY, 2020–2030 ($MILLION)
TABLE 55.LATIN AMERICA NANO BATTERY MARKET, BY TECHNOLOGY, 2020–2030 ($MILLION)
TABLE 56.LATIN AMERICA NANO BATTERY MARKET, BY APPLICATION, 2020–2030 ($MILLION)
TABLE 57.MIDDLE EAST NANO BATTERY MARKET, BY TECHNOLOGY, 2020–2030 ($MILLION)
TABLE 58.MIDDLE EAST NANO BATTERY MARKET, BY APPLICATION, 2020–2030 ($MILLION)
TABLE 59.AFRICA NANO BATTERY MARKET, BY TECHNOLOGY, 2020–2030 ($MILLION)
TABLE 60.AFRICA NANO BATTERY MARKET, BY APPLICATION, 2020–2030 ($MILLION)
TABLE 61.KEY NEW PRODUCT LAUNCH (2017-2021)
TABLE 62.KEY COLLABORATION (2017-2021)
TABLE 63.KEY PARTNERSHIP (2017-2021)
TABLE 64.ALTAIRNANO: COMPANY SNAPSHOT
TABLE 65.ALTAIRNANO: PRODUCT PORTFOLIO
TABLE 66.AMPRIUS TECHNOLOGIES: COMPANY SNAPSHOT
TABLE 67.AMPRIUS TECHNOLOGIES
TABLE 68.AMPRIUS TECHNOLOGIES: KEY STRATEGIC MOVES AND DEVELOPMENTS
TABLE 69.A123 SYSTEMS LLC: COMPANY SNAPSHOT
TABLE 70.A123 SYSTEMS LLC: PRODUCT PORTFOLIO
TABLE 71.CALIFORNIA LITHIUM BATTERY: COMPANY SNAPSHOT
TABLE 72.CALIFORNIA LITHIUM BATTERY: PRODUCT PORTFOLIO
TABLE 73.FRONT EDGE TECHNOLOGY: COMPANY SNAPSHOT
TABLE 74.FRONT EDGE TECHNOLOGY: PRODUCT PORTFOLIO
TABLE 75.MPHASE TECHNOLOGIES: COMPANY SNAPSHOT
TABLE 76.MPHASE TECHNOLOGIES: PRODUCT PORTFOLIO
TABLE 77.NAXIN NEW ENERGY TECHNOLOGY CO., LTD.: COMPANY SNAPSHOT
TABLE 78.NAXIN NEW ENERGY TECHNOLOGY CO., LTD.: PRODUCT PORTFOLIO
TABLE 79.SICONA BATTERY TECHNOLOGIES: COMPANY SNAPSHOT
TABLE 80.SICONA BATTERY TECHNOLOGIES: PRODUCT PORTFOLIO
TABLE 81.SICONA BATTERY TECHNOLOGIES: KEY STRATEGIC MOVES AND DEVELOPMENTS
TABLE 82.SOLAREDGE: COMPANY SNAPSHOT
TABLE 83.SOLAREDGE: OPERATING SEGMENTS
TABLE 84.SOLAREDGE: PRODUCT PORTFOLIO
TABLE 85.OVERALL FINANCIAL STATUS ($MILLION)
TABLE 86.U.S. PHOTONICS INCORPORATED: COMPANY SNAPSHOT
TABLE 87.U.S. PHOTONICS INCORPORATED: PRODUCT PORTFOLIO
LIST OF FIGURES
FIGURE 01.KEY MARKET SEGMENTS
FIGURE 02.MODERATE BARGAINING POWER OF SUPPLIERS
FIGURE 03.MODERATE THREAT OF NEW ENTRANTS
FIGURE 04.MODERATE THREAT OF SUBSTITUTES
FIGURE 05.MODERATE INTENSITY OF COMPETITIVE RIVALRY
FIGURE 06.MODERATE BARGAINING POWER OF BUYERS
FIGURE 07.VALUE CHAIN ANALYSIS
FIGURE 08.TOP INVESTMENT POCKETS
FIGURE 09.PATENT ANALYSIS, BY REGION
FIGURE 10.NANO BATTERY MARKET DYNAMICS
FIGURE 11.GLOBAL NANO BATTERY MARKET, BY TECHNOLOGY, 2020–2030
FIGURE 12.COMPARATIVE ANALYSIS OF NANO PHOSPHATE BATTERY MARKET, BY COUNTRY, 2020 & 2030 ($MILLION)
FIGURE 13.COMPARATIVE ANALYSIS OF NANO PORE BATTERY MARKET, BY COUNTRY, 2020 & 2030 ($MILLION)
FIGURE 14.COMPARATIVE ANALYSIS OF LITHIUM-ION NANO BATTERY MARKET, BY COUNTRY, 2020 & 2030 ($MILLION)
FIGURE 15.GLOBAL NANO BATTERY MARKET, BY APPLICATION, 2020–2030
FIGURE 16.COMPARATIVE ANALYSIS OF NANO BATTERY MARKET FOR CONSUMER ELECTRONICS, BY COUNTRY, 2020 & 2030 ($MILLION)
FIGURE 17.COMPARATIVE ANALYSIS OF NANO BATTERY MARKET FOR MILITARY, BY COUNTRY, 2020 & 2030 ($MILLION)
FIGURE 18.COMPARATIVE ANALYSIS OF NANO BATTERY MARKET FOR POWER TOOLS AND INDUSTRIAL, BY COUNTRY, 2020 & 2030 ($MILLION)
FIGURE 19.COMPARATIVE ANALYSIS OF NANO BATTERY MARKET FOR RENEWABLES AND GRID ENERGY, BY COUNTRY, 2020 & 2030 ($MILLION)
FIGURE 20.COMPARATIVE ANALYSIS OF NANO BATTERY MARKET FOR TRANSPORT, BY COUNTRY, 2020 & 2030 ($MILLION)
FIGURE 21.COMPARATIVE ANALYSIS OF NANO BATTERY MARKET FOR OTHERS, BY COUNTRY, 2020 & 2030 ($MILLION)
FIGURE 22.U.S. NANO BATTERY MARKET REVENUE, 2020–2030 ($MILLION)
FIGURE 23.CANADA NANO BATTERY MARKET REVENUE, 2020–2030 ($MILLION)
FIGURE 24.MEXICO NANO BATTERY MARKET REVENUE, 2020–2030 ($MILLION)
FIGURE 25.GERMANY NANO BATTERY MARKET REVENUE, 2020–2030 ($MILLION)
FIGURE 26.UK NANO BATTERY MARKET REVENUE, 2020–2030 ($MILLION)
FIGURE 27.FRANCE NANO BATTERY MARKET REVENUE, 2020–2030 ($MILLION)
FIGURE 28.SPAIN NANO BATTERY MARKET REVENUE, 2020–2030 ($MILLION)
FIGURE 29.ITALY NANO BATTERY MARKET REVENUE, 2020–2030 ($MILLION)
FIGURE 30.REST OF EUROPE NANO BATTERY MARKET REVENUE, 2020–2030 ($MILLION)
FIGURE 31.CHINA NANO BATTERY MARKET REVENUE, 2020–2030 ($MILLION)
FIGURE 32.JAPAN NANO BATTERY MARKET REVENUE, 2020–2030 ($MILLION)
FIGURE 33.INDIA NANO BATTERY MARKET REVENUE, 2020–2030 ($MILLION)
FIGURE 34.AUSTRALIA NANO BATTERY MARKET REVENUE, 2020–2030 ($MILLION)
FIGURE 35.SOUTH KOREA NANO BATTERY MARKET REVENUE, 2020–2030 ($MILLION)
FIGURE 36.REST OF ASIA-PACIFIC NANO BATTERY MARKET REVENUE, 2020–2030 ($MILLION)
FIGURE 37.LATIN AMERICA NANO BATTERY MARKET REVENUE, 2020–2030 ($MILLION)
FIGURE 38.MIDDLE EAST NANO BATTERY MARKET REVENUE, 2020–2030 ($MILLION)
FIGURE 39.AFRICA NANO BATTERY MARKET REVENUE, 2020–2030 ($MILLION)
FIGURE 40.MARKET PLAYER POSITIONING, 2020
FIGURE 41.TOP WINNING STRATEGIES, BY YEAR, 2017–2021
FIGURE 42.TOP WINNING STRATEGIES, BY DEVELOPMENT, 2017–2021 (%)
FIGURE 43.TOP WINNING STRATEGIES, BY COMPANY, 2017–2021
FIGURE 44.PRODUCT MAPPING OF TOP 10 PLAYERS
FIGURE 45.COMPETITIVE HEATMAP OF KEY PLAYERS
FIGURE 46.SOLAREDGE: REVENUE, 2018–2020 ($MILLION)
FIGURE 47.SOLAREDGE: REVENUE SHARE BY SEGMENT, 2020 (%)
FIGURE 48.SOLAREDGE: REVENUE SHARE BY REGION, 2020 (%)
Rapid industrialization and growth of the energy storage sector is the key factor attributed to the leading position of North America and Asia-Pacific region in the global nano battery market. The Asia-Pacific region is further expected to provide lucrative opportunities to leading nano battery manufacturers, owing to its huge potential to set up manufacturing plants and surge in demand for energy storage systems.
Advantages associated with nanotechnology in the manufacturing of batteries and rise in demand for nano batteries from various end-use industries are the key factors driving the growth of the global nano battery market during the forecast period. However, difficulties associated with manufacturing of nano materials used in batteries is expected to hamper the growth of the market during the analyzed time frame. On the contrary, rise in investment and R&D toward nano scale components in battery technology is anticipated to provide remunerative opportunity for the key players to maintain the pace in the nano battery market in the upcoming years.
Among the analyzed regions, North America is expected to account for the highest revenue in the market by the end of 2030, followed by Asia-Pacific, Europe, and LAMEA.
A. Partnership, product launch and collaboration are the key growth strategies of nano battery market players.
A. North America and Asia-Pacific will provide more business opportunities for nano battery in future.
A. To get latest version of nano battery market report can be obtained on demand from the website.
A. Potential customers of nano battery industry are consumer electronics, military, power tools & industrial, renewables & grid energy, transport, and others.
A. Naxin New Energy Technology Co., Ltd., mPhase Technologies, Front Edge Technology, A123 Systems LLC, Altairnano, Amprius Technologies, US Photonics Inc., California Lithium Battery, Sicona Battery Technology, and Kokam are leading global players in the nano battery market.
A. The top ten market players are selected based on two key attributes - competitive strength and market positioning
A. On the basis of technology, lithium-ion technology holds maximum share of the market. By application, military segment holds maximum share of the market.
A. The key benefits of the global nano battery market are information on key trends, market size & forecast, top players and their development strategies, and others.
A. Rise in investment and R&D towards nano scale components in battery technology are the current trends will influence the nano battery market in the next few years.
A. Advantages associated with nanotechnology in the manufacturing of batteries and Rise in demand for nano batteries from various end use industries are key factors drives the nano battery market growth during the forecast period.
Start reading instantly.
This Report and over 66,804+ more Reports, Available with Avenue Library. T&C*.
Enterprise
License/PDF
Library
Membership
*Taxes/Fees, if applicable will be added during checkout. All prices in USD
To ensure high-level data integrity, accurate analysis, and impeccable forecasts
For complete satisfaction
On-demand customization of scope of the report to exactly meet your needs
Targeted market view to provide pertinent information and save time of readers
Get insights on topics that are crucial for your business. Stay abreast of your interest areas.
Get Industry Data AlertsTo ensure high-level data integrity, accurate analysis, and impeccable forecasts
For complete satisfaction
On-demand customization of scope of the report to exactly meet your needs
Targeted market view to provide pertinent information and save time of readers