0
2022
Nano Copper Oxide Market

Nano Copper Oxide Market

By End User (Electricals and Electronics, Energy Storage, Paints & Coatings, Catalysts, Others): Global Opportunity Analysis and Industry Forecast, 2021-2031

Report Code: A01391
Jul 2022 | Pages: 204
Tables: 129
Charts: 58
  • Formats*:

  • pdf

    Single User License, Five User
    License & Enterprise User License

  • xls

    Data Pack Excel License

  • ppt

    It comes with the additional cost
    of $2500.00 contact sales.


Nano Copper Oxide Market Research, 2031

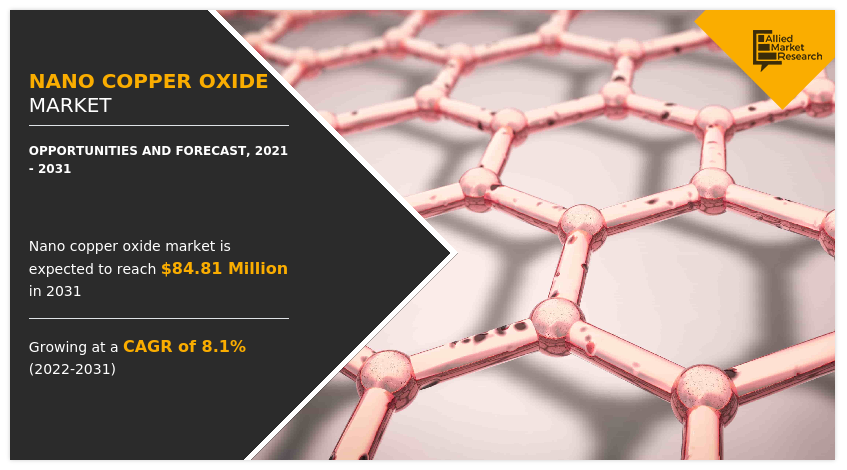
The global nano copper oxide market was valued at $39.09 million in 2021, and is projected to reach $84.81 million by 2031, growing at a CAGR of 8.1% from 2022 to 2031.

COVID-19 had negative impact on nano copper oxide market owing to decreased demand from various end user like energy storage, paints & coatings and electronics.

Nano copper oxide is a brownish-black or reddish nanoparticle that comes in a number of shapes depending on the application. In the market, it is often marketed as a powder or in scattered form. It exhibits different physical and chemical characteristics, Including superconductivity, photovoltaic capabilities, stability, cheap cost, and antibacterial action.

Increase in usage of metal and metal oxide nanoparticles in the electronics and semiconductor sectors is a primary factor driving the copper oxide nanoparticles market. The demand for copper oxide nanoparticles in catalyst applications is predicted to rise due to their exceptional catalytic characteristics. As a result, industries are increasing their manufacturing of copper oxide nanoparticles. In addition, an increase in demand for copper oxide nanoparticles in paints & coatings applications is expected to raise demand for these particles in the near future. Humans have experienced negative effects including nausea and vomiting after ingesting copper oxide powder and lung damage after breathing copper oxide fumes. In most instances, these impacts expose the copper ions released by copper oxide to exceptionally high concentrations of this metal, resulting in an Increase in copper bioavailability. This factor restrains the market for nano copper oxide. However, among the uses are semiconductors, batteries, gas sensors, microelectronics, solar energy converters, and heat transfer fluids. All of these elements open the way for more advanced nano copper oxide research and development, as well as more opportunities to identify new uses for the material.
Nano Copper Oxide Market, Nano Copper Oxide Industry, Nano Copper Oxide Market Size, Nano Copper Oxide Market Share, Nano Copper Oxide Market Growth, Nano Copper Oxide Market Analysis, Nano Copper Oxide Market Trends, Nano Copper Oxide Market Forecast

Increased disposable income in countries such as Japan and South Korea is driving the growth of industries such as paints and coatings, electricals and electronics, textiles, healthcare, and life sciences. Rapid development and rise in investment in these industries drive market expansion and demand for nano copper oxide.

The nano copper oxide market is segmented on the basis of end-use industry and region. On the basis of end-use industry, the market is categorized into electricals & electronics, energy storage, paints & coatings, catalysts and others. On the basis of region, the market is studied across North America, Europe, Asia-Pacific, and LAMEA.

Major players operating in the global nano copper oxide market include American Elements, Hongwu International Group Ltd., Inframat Advanced Materials, LLC, Merck KGaA, Nanjing Emperor Nano materials Co., Ltd., Nanoshel LLC, Nanostructured & Amorphous Materials, Inc., Novacentrix, Iolitec Ionic Liquids Technologies GmbH, PlasmaChem GmbH, Sisco Research Laboratories Pvt. Ltd., SkySpring Nanomaterials Inc., Stream Chemicals, Inc., Suzhou Canfuo Nanotechnology Co., Ltd., and US Research Nanomaterials, Inc.
Nano Copper Oxide Market

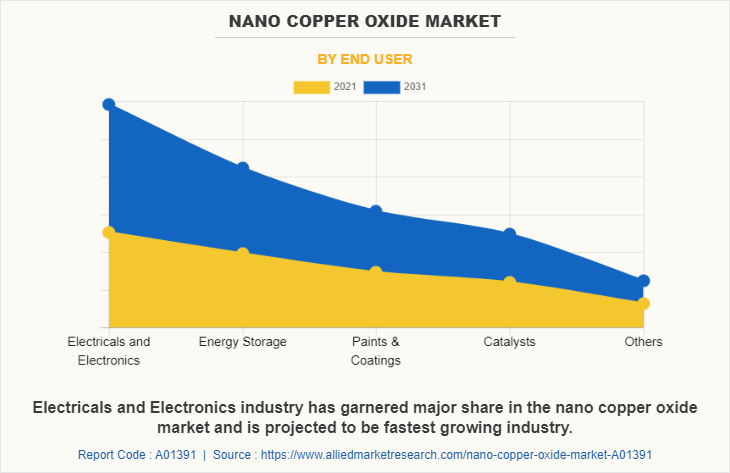
The electricals and electronics segment accounted for the largest share i.e., 32.22%. The electricals and electronics segment is the fastest growing segment, growing around 8.9% CAGR during the forecasted period. This is due to increased demand for semiconductors from electricals & electronics industry.
Nano Copper Oxide Market

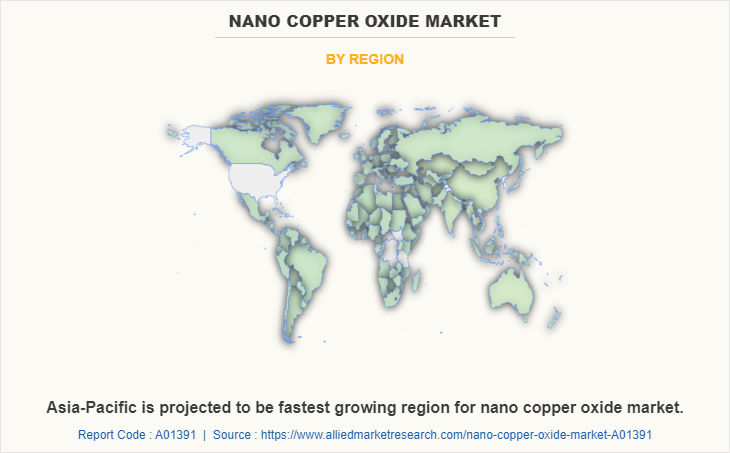
Asia-Pacific contributed the 42.96% market share in 2021 and is projected to grow at CAGR of 8.8% during the forecast period owing to the increased demand from electricals & electronics and energy storage industries. Asia-Pacific has garnered major share in nano copper oxide market.

In the paint & coatings business, nano copper oxide is used in ship antifouling paints. It also inhibits the growth of microbes such as fungus and algae, and theoretically, ships may save up to 40 percent of their fuel. The majority of industry employed this biocide for preventative wood treatments. Developments in the construction industry in Japan and South Korea is surges the demand for paints and coatings and hence boosts the growth of the nano copper oxide market. Copper nanoparticle ink is created using nano copper oxide particles. Its development is a result of the product's increasing use in research and laboratories. There is a rise in demand in electronic sector need for copper oxide nanoparticle ink in Japan and South Korea. This is anticipated to drive the market growth.

IMPACT OF COVID-19 ON THE GLOBAL NANO COPPER OXIDE MARKET

  • The COVID-19 pandemic had a negative impact on the economics and industries of various nations as a result of several lockdowns, travel restrictions, and company closures.
  • The chemicals and materials industry is one of the principal industries facing significant disruptions, including supply chain restrictions and facility shutdowns. The shutdown of several warehouses and factories in worldwide markets disrupted global supply networks and affected the electrical and paint & coating sectors' revenue.
  • Nano copper oxide consumption has also been hindered by a drop in demand from end-use industries. Multiple businesses have already warned of potential delays in product deliveries and a decline in future product sales.
  • In contrast, the launch of vaccination campaigns has loosened constraints on manufacturing activity.

Key Benefits For Stakeholders

  • This report provides a quantitative analysis of the market segments, current trends, estimations, and dynamics of the nano copper oxide market analysis from 2021 to 2031 to identify the prevailing nano copper oxide market opportunities.
  • The market research is offered along with information related to key drivers, restraints, and opportunities.
  • Porter's five forces analysis highlights the potency of buyers and suppliers to enable stakeholders make profit-oriented business decisions and strengthen their supplier-buyer network.
  • In-depth analysis of the nano copper oxide market segmentation assists to determine the prevailing market opportunities.
  • Major countries in each region are mapped according to their revenue contribution to the global market.
  • Market player positioning facilitates benchmarking and provides a clear understanding of the present position of the market players.
  • The report includes the analysis of the regional as well as global nano copper oxide market trends, key players, market segments, application areas, and market growth strategies.

      Nano Copper Oxide Market Report Highlights

      Aspects Details
      By End User
      • Energy Storage
      • Paints & Coatings
      • Catalysts
      • Others
      • Electricals and Electronics
      By Region
      • North America  (U.S, Canada, Mexico)
      • Europe  (Germany, France, U.K, Spain, Italy, Rest of Europe)
      • Asia-Pacific  (China, Japan, India, South Korea, Australia, Rest Of Asia Pacific)
      • LAMEA  (Brazil, Saudi Arabia, South Africa, Rest of LAMEA)
      Key Market Players PlasmaChem GmbH, NANOCOMPOSIX, INC., SkySpring Nanomaterials, Inc., American Elements, Hongwu International Group Ltd, Inframat Corporation, Nanoshel LLC, US Research Nanomaterials, Inc., NaBond Technologies Co., Limited, Nanostructured & Amorphous Materials, Inc.
      Other players in the value chain include Beijing Nachen S&T Ltd., Nanjing Emperor Nano Material Co., Ltd., Ionic Liquids Technologies GmbH, Nanotechnology, Inc., Quantumsphere, Reade Advanced Materials, Sigma Aldrich, Sisco Research Laboratories Pvt. Ltd., Strem Chemicals, Sun Innovations, Yong-Zhen Technomaterial Co. Ltd.
       
      • CHAPTER 1:INTRODUCTION

        • 1.1.Report description

        • 1.2.Key market segments

        • 1.3.Key benefits to the stakeholders

        • 1.4.Research Methodology

          • 1.4.1.Secondary research

          • 1.4.2.Primary research

          • 1.4.3.Analyst tools and models

      • CHAPTER 2:EXECUTIVE SUMMARY

        • 2.1.Key findings of the study

        • 2.2.CXO Perspective

      • CHAPTER 3:MARKET OVERVIEW

        • 3.1.Market definition and scope

        • 3.2.Key findings

          • 3.2.1.Top investment pockets

        • 3.3.Porter’s five forces analysis

        • 3.4.Top player positioning

        • 3.5.Market dynamics

          • 3.5.1.Drivers

          • 3.5.2.Restraints

          • 3.5.3.Opportunities

        • 3.6.COVID-19 Impact Analysis on the market

        • 3.7.Pricing Analysis

        • 3.8.Value Chain Analysis

        • 3.9.Key Regulation Analysis

        • 3.10.Patent Landscape

      • CHAPTER 4: NANO COPPER OXIDE MARKET, BY END USER

        • 4.1 Overview

          • 4.1.1 Market size and forecast

        • 4.2 Electricals and Electronics

          • 4.2.1 Key market trends, growth factors and opportunities

          • 4.2.2 Market size and forecast, by region

          • 4.2.3 Market analysis by country

        • 4.3 Energy Storage

          • 4.3.1 Key market trends, growth factors and opportunities

          • 4.3.2 Market size and forecast, by region

          • 4.3.3 Market analysis by country

        • 4.4 Paints & Coatings

          • 4.4.1 Key market trends, growth factors and opportunities

          • 4.4.2 Market size and forecast, by region

          • 4.4.3 Market analysis by country

        • 4.5 Catalysts

          • 4.5.1 Key market trends, growth factors and opportunities

          • 4.5.2 Market size and forecast, by region

          • 4.5.3 Market analysis by country

        • 4.6 Others

          • 4.6.1 Key market trends, growth factors and opportunities

          • 4.6.2 Market size and forecast, by region

          • 4.6.3 Market analysis by country

      • CHAPTER 5: NANO COPPER OXIDE MARKET, BY REGION

        • 5.1 Overview

          • 5.1.1 Market size and forecast

        • 5.2 North America

          • 5.2.1 Key trends and opportunities

          • 5.2.2 North America Market size and forecast, by End User

          • 5.2.3 North America Market size and forecast, by country

            • 5.2.3.1 U.S
              • 5.2.3.1.1 Market size and forecast, by End User
            • 5.2.3.2 Canada
              • 5.2.3.2.1 Market size and forecast, by End User
            • 5.2.3.3 Mexico
              • 5.2.3.3.1 Market size and forecast, by End User
        • 5.3 Europe

          • 5.3.1 Key trends and opportunities

          • 5.3.2 Europe Market size and forecast, by End User

          • 5.3.3 Europe Market size and forecast, by country

            • 5.3.3.1 Germany
              • 5.3.3.1.1 Market size and forecast, by End User
            • 5.3.3.2 France
              • 5.3.3.2.1 Market size and forecast, by End User
            • 5.3.3.3 U.K
              • 5.3.3.3.1 Market size and forecast, by End User
            • 5.3.3.4 Spain
              • 5.3.3.4.1 Market size and forecast, by End User
            • 5.3.3.5 Italy
              • 5.3.3.5.1 Market size and forecast, by End User
            • 5.3.3.6 Rest of Europe
              • 5.3.3.6.1 Market size and forecast, by End User
        • 5.4 Asia-Pacific

          • 5.4.1 Key trends and opportunities

          • 5.4.2 Asia-Pacific Market size and forecast, by End User

          • 5.4.3 Asia-Pacific Market size and forecast, by country

            • 5.4.3.1 China
              • 5.4.3.1.1 Market size and forecast, by End User
            • 5.4.3.2 Japan
              • 5.4.3.2.1 Market size and forecast, by End User
            • 5.4.3.3 India
              • 5.4.3.3.1 Market size and forecast, by End User
            • 5.4.3.4 South Korea
              • 5.4.3.4.1 Market size and forecast, by End User
            • 5.4.3.5 Australia
              • 5.4.3.5.1 Market size and forecast, by End User
            • 5.4.3.6 Rest Of Asia Pacific
              • 5.4.3.6.1 Market size and forecast, by End User
        • 5.5 LAMEA

          • 5.5.1 Key trends and opportunities

          • 5.5.2 LAMEA Market size and forecast, by End User

          • 5.5.3 LAMEA Market size and forecast, by country

            • 5.5.3.1 Brazil
              • 5.5.3.1.1 Market size and forecast, by End User
            • 5.5.3.2 Saudi Arabia
              • 5.5.3.2.1 Market size and forecast, by End User
            • 5.5.3.3 South Africa
              • 5.5.3.3.1 Market size and forecast, by End User
            • 5.5.3.4 Rest of LAMEA
              • 5.5.3.4.1 Market size and forecast, by End User
      • CHAPTER 6: COMPANY LANDSCAPE

        • 6.1. Introduction

        • 6.2. Top winning strategies

        • 6.3. Product Mapping of Top 10 Player

        • 6.4. Competitive Dashboard

        • 6.5. Competitive Heatmap

        • 6.6. Key developments

      • CHAPTER 7: COMPANY PROFILES

        • 7.1 American Elements

          • 7.1.1 Company overview

          • 7.1.2 Company snapshot

          • 7.1.3 Operating business segments

          • 7.1.4 Product portfolio

          • 7.1.5 Business performance

          • 7.1.6 Key strategic moves and developments

        • 7.2 Inframat Corporation

          • 7.2.1 Company overview

          • 7.2.2 Company snapshot

          • 7.2.3 Operating business segments

          • 7.2.4 Product portfolio

          • 7.2.5 Business performance

          • 7.2.6 Key strategic moves and developments

        • 7.3 Hongwu International Group Ltd

          • 7.3.1 Company overview

          • 7.3.2 Company snapshot

          • 7.3.3 Operating business segments

          • 7.3.4 Product portfolio

          • 7.3.5 Business performance

          • 7.3.6 Key strategic moves and developments

        • 7.4 NaBond Technologies Co., Limited

          • 7.4.1 Company overview

          • 7.4.2 Company snapshot

          • 7.4.3 Operating business segments

          • 7.4.4 Product portfolio

          • 7.4.5 Business performance

          • 7.4.6 Key strategic moves and developments

        • 7.5 NANOCOMPOSIX, INC.

          • 7.5.1 Company overview

          • 7.5.2 Company snapshot

          • 7.5.3 Operating business segments

          • 7.5.4 Product portfolio

          • 7.5.5 Business performance

          • 7.5.6 Key strategic moves and developments

        • 7.6 Nanoshel LLC

          • 7.6.1 Company overview

          • 7.6.2 Company snapshot

          • 7.6.3 Operating business segments

          • 7.6.4 Product portfolio

          • 7.6.5 Business performance

          • 7.6.6 Key strategic moves and developments

        • 7.7 Nanostructured & Amorphous Materials, Inc.

          • 7.7.1 Company overview

          • 7.7.2 Company snapshot

          • 7.7.3 Operating business segments

          • 7.7.4 Product portfolio

          • 7.7.5 Business performance

          • 7.7.6 Key strategic moves and developments

        • 7.8 PlasmaChem GmbH

          • 7.8.1 Company overview

          • 7.8.2 Company snapshot

          • 7.8.3 Operating business segments

          • 7.8.4 Product portfolio

          • 7.8.5 Business performance

          • 7.8.6 Key strategic moves and developments

        • 7.9 SkySpring Nanomaterials, Inc.

          • 7.9.1 Company overview

          • 7.9.2 Company snapshot

          • 7.9.3 Operating business segments

          • 7.9.4 Product portfolio

          • 7.9.5 Business performance

          • 7.9.6 Key strategic moves and developments

        • 7.10 US Research Nanomaterials, Inc.

          • 7.10.1 Company overview

          • 7.10.2 Company snapshot

          • 7.10.3 Operating business segments

          • 7.10.4 Product portfolio

          • 7.10.5 Business performance

          • 7.10.6 Key strategic moves and developments

      • LIST OF TABLES

      • TABLE 1. GLOBAL NANO COPPER OXIDE MARKET, BY END USER, 2021-2031 ($MILLION)
        TABLE 2. GLOBAL NANO COPPER OXIDE MARKET, BY END USER, 2021-2031 (TONS)
        TABLE 3. NANO COPPER OXIDE MARKET SIZE, FOR ELECTRICALS AND ELECTRONICS, BY REGION, 2021-2031 ($MILLION)
        TABLE 4. NANO COPPER OXIDE MARKET SIZE, FOR ELECTRICALS AND ELECTRONICS, BY REGION, 2021-2031 (TONS)
        TABLE 5. NANO COPPER OXIDE MARKET FOR ELECTRICALS AND ELECTRONICS, BY COUNTRY, 2021-2031 ($MILLION)
        TABLE 6. NANO COPPER OXIDE MARKET FOR ELECTRICALS AND ELECTRONICS, BY COUNTRY, 2021-2031 (TONS)
        TABLE 7. NANO COPPER OXIDE MARKET SIZE, FOR ENERGY STORAGE, BY REGION, 2021-2031 ($MILLION)
        TABLE 8. NANO COPPER OXIDE MARKET SIZE, FOR ENERGY STORAGE, BY REGION, 2021-2031 (TONS)
        TABLE 9. NANO COPPER OXIDE MARKET FOR ENERGY STORAGE, BY COUNTRY, 2021-2031 ($MILLION)
        TABLE 10. NANO COPPER OXIDE MARKET FOR ENERGY STORAGE, BY COUNTRY, 2021-2031 (TONS)
        TABLE 11. NANO COPPER OXIDE MARKET SIZE, FOR PAINTS & COATINGS, BY REGION, 2021-2031 ($MILLION)
        TABLE 12. NANO COPPER OXIDE MARKET SIZE, FOR PAINTS & COATINGS, BY REGION, 2021-2031 (TONS)
        TABLE 13. NANO COPPER OXIDE MARKET FOR PAINTS & COATINGS, BY COUNTRY, 2021-2031 ($MILLION)
        TABLE 14. NANO COPPER OXIDE MARKET FOR PAINTS & COATINGS, BY COUNTRY, 2021-2031 (TONS)
        TABLE 15. NANO COPPER OXIDE MARKET SIZE, FOR CATALYSTS, BY REGION, 2021-2031 ($MILLION)
        TABLE 16. NANO COPPER OXIDE MARKET SIZE, FOR CATALYSTS, BY REGION, 2021-2031 (TONS)
        TABLE 17. NANO COPPER OXIDE MARKET FOR CATALYSTS, BY COUNTRY, 2021-2031 ($MILLION)
        TABLE 18. NANO COPPER OXIDE MARKET FOR CATALYSTS, BY COUNTRY, 2021-2031 (TONS)
        TABLE 19. NANO COPPER OXIDE MARKET SIZE, FOR OTHERS, BY REGION, 2021-2031 ($MILLION)
        TABLE 20. NANO COPPER OXIDE MARKET SIZE, FOR OTHERS, BY REGION, 2021-2031 (TONS)
        TABLE 21. NANO COPPER OXIDE MARKET FOR OTHERS, BY COUNTRY, 2021-2031 ($MILLION)
        TABLE 22. NANO COPPER OXIDE MARKET FOR OTHERS, BY COUNTRY, 2021-2031 (TONS)
        TABLE 23. NANO COPPER OXIDE MARKET, BY REGION, 2021-2031 ($MILLION)
        TABLE 24. NANO COPPER OXIDE MARKET, BY REGION, 2021-2031 (TONS)
        TABLE 25. NORTH AMERICA NANO COPPER OXIDE MARKET, BY END USER, 2021-2031 ($MILLION)
        TABLE 26. NORTH AMERICA NANO COPPER OXIDE MARKET, BY END USER, 2021-2031 (TONS)
        TABLE 27. NORTH AMERICA NANO COPPER OXIDE MARKET, BY COUNTRY, 2021-2031 ($MILLION)
        TABLE 28. NORTH AMERICA NANO COPPER OXIDE MARKET, BY COUNTRY, 2021-2031 (TONS)
        TABLE 29. U.S NANO COPPER OXIDE MARKET, BY END USER, 2021-2031 ($MILLION)
        TABLE 30. U.S NANO COPPER OXIDE MARKET, BY END USER, 2021-2031 (TONS)
        TABLE 31. CANADA NANO COPPER OXIDE MARKET, BY END USER, 2021-2031 ($MILLION)
        TABLE 32. CANADA NANO COPPER OXIDE MARKET, BY END USER, 2021-2031 (TONS)
        TABLE 33. MEXICO NANO COPPER OXIDE MARKET, BY END USER, 2021-2031 ($MILLION)
        TABLE 34. MEXICO NANO COPPER OXIDE MARKET, BY END USER, 2021-2031 (TONS)
        TABLE 35. EUROPE NANO COPPER OXIDE MARKET, BY END USER, 2021-2031 ($MILLION)
        TABLE 36. EUROPE NANO COPPER OXIDE MARKET, BY END USER, 2021-2031 (TONS)
        TABLE 37. EUROPE NANO COPPER OXIDE MARKET, BY COUNTRY, 2021-2031 ($MILLION)
        TABLE 38. EUROPE NANO COPPER OXIDE MARKET, BY COUNTRY, 2021-2031 (TONS)
        TABLE 39. GERMANY NANO COPPER OXIDE MARKET, BY END USER, 2021-2031 ($MILLION)
        TABLE 40. GERMANY NANO COPPER OXIDE MARKET, BY END USER, 2021-2031 (TONS)
        TABLE 41. FRANCE NANO COPPER OXIDE MARKET, BY END USER, 2021-2031 ($MILLION)
        TABLE 42. FRANCE NANO COPPER OXIDE MARKET, BY END USER, 2021-2031 (TONS)
        TABLE 43. U.K NANO COPPER OXIDE MARKET, BY END USER, 2021-2031 ($MILLION)
        TABLE 44. U.K NANO COPPER OXIDE MARKET, BY END USER, 2021-2031 (TONS)
        TABLE 45. SPAIN NANO COPPER OXIDE MARKET, BY END USER, 2021-2031 ($MILLION)
        TABLE 46. SPAIN NANO COPPER OXIDE MARKET, BY END USER, 2021-2031 (TONS)
        TABLE 47. ITALY NANO COPPER OXIDE MARKET, BY END USER, 2021-2031 ($MILLION)
        TABLE 48. ITALY NANO COPPER OXIDE MARKET, BY END USER, 2021-2031 (TONS)
        TABLE 49. REST OF EUROPE NANO COPPER OXIDE MARKET, BY END USER, 2021-2031 ($MILLION)
        TABLE 50. REST OF EUROPE NANO COPPER OXIDE MARKET, BY END USER, 2021-2031 (TONS)
        TABLE 51. ASIA-PACIFIC NANO COPPER OXIDE MARKET, BY END USER, 2021-2031 ($MILLION)
        TABLE 52. ASIA-PACIFIC NANO COPPER OXIDE MARKET, BY END USER, 2021-2031 (TONS)
        TABLE 53. ASIA-PACIFIC NANO COPPER OXIDE MARKET, BY COUNTRY, 2021-2031 ($MILLION)
        TABLE 54. ASIA-PACIFIC NANO COPPER OXIDE MARKET, BY COUNTRY, 2021-2031 (TONS)
        TABLE 55. CHINA NANO COPPER OXIDE MARKET, BY END USER, 2021-2031 ($MILLION)
        TABLE 56. CHINA NANO COPPER OXIDE MARKET, BY END USER, 2021-2031 (TONS)
        TABLE 57. JAPAN NANO COPPER OXIDE MARKET, BY END USER, 2021-2031 ($MILLION)
        TABLE 58. JAPAN NANO COPPER OXIDE MARKET, BY END USER, 2021-2031 (TONS)
        TABLE 59. INDIA NANO COPPER OXIDE MARKET, BY END USER, 2021-2031 ($MILLION)
        TABLE 60. INDIA NANO COPPER OXIDE MARKET, BY END USER, 2021-2031 (TONS)
        TABLE 61. SOUTH KOREA NANO COPPER OXIDE MARKET, BY END USER, 2021-2031 ($MILLION)
        TABLE 62. SOUTH KOREA NANO COPPER OXIDE MARKET, BY END USER, 2021-2031 (TONS)
        TABLE 63. AUSTRALIA NANO COPPER OXIDE MARKET, BY END USER, 2021-2031 ($MILLION)
        TABLE 64. AUSTRALIA NANO COPPER OXIDE MARKET, BY END USER, 2021-2031 (TONS)
        TABLE 65. REST OF ASIA PACIFIC NANO COPPER OXIDE MARKET, BY END USER, 2021-2031 ($MILLION)
        TABLE 66. REST OF ASIA PACIFIC NANO COPPER OXIDE MARKET, BY END USER, 2021-2031 (TONS)
        TABLE 67. LAMEA NANO COPPER OXIDE MARKET, BY END USER, 2021-2031 ($MILLION)
        TABLE 68. LAMEA NANO COPPER OXIDE MARKET, BY END USER, 2021-2031 (TONS)
        TABLE 69. LAMEA NANO COPPER OXIDE MARKET, BY COUNTRY, 2021-2031 ($MILLION)
        TABLE 70. LAMEA NANO COPPER OXIDE MARKET, BY COUNTRY, 2021-2031 (TONS)
        TABLE 71. BRAZIL NANO COPPER OXIDE MARKET, BY END USER, 2021-2031 ($MILLION)
        TABLE 72. BRAZIL NANO COPPER OXIDE MARKET, BY END USER, 2021-2031 (TONS)
        TABLE 73. SAUDI ARABIA NANO COPPER OXIDE MARKET, BY END USER, 2021-2031 ($MILLION)
        TABLE 74. SAUDI ARABIA NANO COPPER OXIDE MARKET, BY END USER, 2021-2031 (TONS)
        TABLE 75. SOUTH AFRICA NANO COPPER OXIDE MARKET, BY END USER, 2021-2031 ($MILLION)
        TABLE 76. SOUTH AFRICA NANO COPPER OXIDE MARKET, BY END USER, 2021-2031 (TONS)
        TABLE 77. REST OF LAMEA NANO COPPER OXIDE MARKET, BY END USER, 2021-2031 ($MILLION)
        TABLE 78. REST OF LAMEA NANO COPPER OXIDE MARKET, BY END USER, 2021-2031 (TONS)
        TABLE 79.AMERICAN ELEMENTS: COMPANY SNAPSHOT
        TABLE 80.AMERICAN ELEMENTS: OPERATING SEGMENTS
        TABLE 81.AMERICAN ELEMENTS: PRODUCT PORTFOLIO
        TABLE 82.AMERICAN ELEMENTS: NET SALES,
        TABLE 83.AMERICAN ELEMENTS: KEY STRATERGIES
        TABLE 84.INFRAMAT CORPORATION: COMPANY SNAPSHOT
        TABLE 85.INFRAMAT CORPORATION: OPERATING SEGMENTS
        TABLE 86.INFRAMAT CORPORATION: PRODUCT PORTFOLIO
        TABLE 87.INFRAMAT CORPORATION: NET SALES,
        TABLE 88.INFRAMAT CORPORATION: KEY STRATERGIES
        TABLE 89.HONGWU INTERNATIONAL GROUP LTD: COMPANY SNAPSHOT
        TABLE 90.HONGWU INTERNATIONAL GROUP LTD: OPERATING SEGMENTS
        TABLE 91.HONGWU INTERNATIONAL GROUP LTD: PRODUCT PORTFOLIO
        TABLE 92.HONGWU INTERNATIONAL GROUP LTD: NET SALES,
        TABLE 93.HONGWU INTERNATIONAL GROUP LTD: KEY STRATERGIES
        TABLE 94.NABOND TECHNOLOGIES CO., LIMITED: COMPANY SNAPSHOT
        TABLE 95.NABOND TECHNOLOGIES CO., LIMITED: OPERATING SEGMENTS
        TABLE 96.NABOND TECHNOLOGIES CO., LIMITED: PRODUCT PORTFOLIO
        TABLE 97.NABOND TECHNOLOGIES CO., LIMITED: NET SALES,
        TABLE 98.NABOND TECHNOLOGIES CO., LIMITED: KEY STRATERGIES
        TABLE 99.NANOCOMPOSIX, INC.: COMPANY SNAPSHOT
        TABLE 100.NANOCOMPOSIX, INC.: OPERATING SEGMENTS
        TABLE 101.NANOCOMPOSIX, INC.: PRODUCT PORTFOLIO
        TABLE 102.NANOCOMPOSIX, INC.: NET SALES,
        TABLE 103.NANOCOMPOSIX, INC.: KEY STRATERGIES
        TABLE 104.NANOSHEL LLC: COMPANY SNAPSHOT
        TABLE 105.NANOSHEL LLC: OPERATING SEGMENTS
        TABLE 106.NANOSHEL LLC: PRODUCT PORTFOLIO
        TABLE 107.NANOSHEL LLC: NET SALES,
        TABLE 108.NANOSHEL LLC: KEY STRATERGIES
        TABLE 109.NANOSTRUCTURED & AMORPHOUS MATERIALS, INC.: COMPANY SNAPSHOT
        TABLE 110.NANOSTRUCTURED & AMORPHOUS MATERIALS, INC.: OPERATING SEGMENTS
        TABLE 111.NANOSTRUCTURED & AMORPHOUS MATERIALS, INC.: PRODUCT PORTFOLIO
        TABLE 112.NANOSTRUCTURED & AMORPHOUS MATERIALS, INC.: NET SALES,
        TABLE 113.NANOSTRUCTURED & AMORPHOUS MATERIALS, INC.: KEY STRATERGIES
        TABLE 114.PLASMACHEM GMBH: COMPANY SNAPSHOT
        TABLE 115.PLASMACHEM GMBH: OPERATING SEGMENTS
        TABLE 116.PLASMACHEM GMBH: PRODUCT PORTFOLIO
        TABLE 117.PLASMACHEM GMBH: NET SALES,
        TABLE 118.PLASMACHEM GMBH: KEY STRATERGIES
        TABLE 119.SKYSPRING NANOMATERIALS, INC.: COMPANY SNAPSHOT
        TABLE 120.SKYSPRING NANOMATERIALS, INC.: OPERATING SEGMENTS
        TABLE 121.SKYSPRING NANOMATERIALS, INC.: PRODUCT PORTFOLIO
        TABLE 122.SKYSPRING NANOMATERIALS, INC.: NET SALES,
        TABLE 123.SKYSPRING NANOMATERIALS, INC.: KEY STRATERGIES
        TABLE 124.US RESEARCH NANOMATERIALS, INC.: COMPANY SNAPSHOT
        TABLE 125.US RESEARCH NANOMATERIALS, INC.: OPERATING SEGMENTS
        TABLE 126.US RESEARCH NANOMATERIALS, INC.: PRODUCT PORTFOLIO
        TABLE 127.US RESEARCH NANOMATERIALS, INC.: NET SALES,
        TABLE 128.US RESEARCH NANOMATERIALS, INC.: KEY STRATERGIES
      • LIST OF FIGURES

      • FIGURE 1.NANO COPPER OXIDE MARKET SEGMENTATION
        FIGURE 2.NANO COPPER OXIDE MARKET,2021-2031
        FIGURE 3.NANO COPPER OXIDE MARKET,2021-2031
        FIGURE 4. TOP INVESTMENT POCKETS, BY REGION
        FIGURE 5.PORTER FIVE-1
        FIGURE 6.PORTER FIVE-2
        FIGURE 7.PORTER FIVE-3
        FIGURE 8.PORTER FIVE-4
        FIGURE 9.PORTER FIVE-5
        FIGURE 10.TOP PLAYER POSITIONING
        FIGURE 11.NANO COPPER OXIDE MARKET:DRIVERS, RESTRAINTS AND OPPORTUNITIES
        FIGURE 12.PRICING ANALYSIS
        FIGURE 13.VALUE CHAIN ANALYSIS
        FIGURE 14.KEY REGULATION ANALYSIS
        FIGURE 15.PATENT ANALYSIS BY COMPANY
        FIGURE 16.PATENT ANALYSIS BY COUNTRY
        FIGURE 17.NANO COPPER OXIDE MARKET,BY END USER,2021(%)
        FIGURE 18.COMPARATIVE SHARE ANALYSIS OF ELECTRICALS AND ELECTRONICS NANO COPPER OXIDE MARKET,2021-2031(%)
        FIGURE 19.COMPARATIVE SHARE ANALYSIS OF ENERGY STORAGE NANO COPPER OXIDE MARKET,2021-2031(%)
        FIGURE 20.COMPARATIVE SHARE ANALYSIS OF PAINTS & COATINGS NANO COPPER OXIDE MARKET,2021-2031(%)
        FIGURE 21.COMPARATIVE SHARE ANALYSIS OF CATALYSTS NANO COPPER OXIDE MARKET,2021-2031(%)
        FIGURE 22.COMPARATIVE SHARE ANALYSIS OF OTHERS NANO COPPER OXIDE MARKET,2021-2031(%)
        FIGURE 23.NANO COPPER OXIDE MARKET BY REGION,2021
        FIGURE 24.U.S NANO COPPER OXIDE MARKET,2021-2031($MILLION)
        FIGURE 25.CANADA NANO COPPER OXIDE MARKET,2021-2031($MILLION)
        FIGURE 26.MEXICO NANO COPPER OXIDE MARKET,2021-2031($MILLION)
        FIGURE 27.GERMANY NANO COPPER OXIDE MARKET,2021-2031($MILLION)
        FIGURE 28.FRANCE NANO COPPER OXIDE MARKET,2021-2031($MILLION)
        FIGURE 29.U.K NANO COPPER OXIDE MARKET,2021-2031($MILLION)
        FIGURE 30.SPAIN NANO COPPER OXIDE MARKET,2021-2031($MILLION)
        FIGURE 31.ITALY NANO COPPER OXIDE MARKET,2021-2031($MILLION)
        FIGURE 32.REST OF EUROPE NANO COPPER OXIDE MARKET,2021-2031($MILLION)
        FIGURE 33.CHINA NANO COPPER OXIDE MARKET,2021-2031($MILLION)
        FIGURE 34.JAPAN NANO COPPER OXIDE MARKET,2021-2031($MILLION)
        FIGURE 35.INDIA NANO COPPER OXIDE MARKET,2021-2031($MILLION)
        FIGURE 36.SOUTH KOREA NANO COPPER OXIDE MARKET,2021-2031($MILLION)
        FIGURE 37.AUSTRALIA NANO COPPER OXIDE MARKET,2021-2031($MILLION)
        FIGURE 38.REST OF ASIA PACIFIC NANO COPPER OXIDE MARKET,2021-2031($MILLION)
        FIGURE 39.BRAZIL NANO COPPER OXIDE MARKET,2021-2031($MILLION)
        FIGURE 40.SAUDI ARABIA NANO COPPER OXIDE MARKET,2021-2031($MILLION)
        FIGURE 41.SOUTH AFRICA NANO COPPER OXIDE MARKET,2021-2031($MILLION)
        FIGURE 42.REST OF LAMEA NANO COPPER OXIDE MARKET,2021-2031($MILLION)
        FIGURE 43. TOP WINNING STRATEGIES, BY YEAR
        FIGURE 44. TOP WINNING STRATEGIES, BY DEVELOPMENT
        FIGURE 45. TOP WINNING STRATEGIES, BY COMPANY
        FIGURE 46.PRODUCT MAPPING OF TOP 10 PLAYERS
        FIGURE 47.COMPETITIVE DASHBOARD
        FIGURE 48.COMPETITIVE HEATMAP OF TOP 10 KEY PLAYERS
        FIGURE 49.AMERICAN ELEMENTS.: NET SALES ,($MILLION)
        FIGURE 50.INFRAMAT CORPORATION.: NET SALES ,($MILLION)
        FIGURE 51.HONGWU INTERNATIONAL GROUP LTD.: NET SALES ,($MILLION)
        FIGURE 52.NABOND TECHNOLOGIES CO., LIMITED.: NET SALES ,($MILLION)
        FIGURE 53.NANOCOMPOSIX, INC..: NET SALES ,($MILLION)
        FIGURE 54.NANOSHEL LLC.: NET SALES ,($MILLION)
        FIGURE 55.NANOSTRUCTURED & AMORPHOUS MATERIALS, INC..: NET SALES ,($MILLION)
        FIGURE 56.PLASMACHEM GMBH.: NET SALES ,($MILLION)
        FIGURE 57.SKYSPRING NANOMATERIALS, INC..: NET SALES ,($MILLION)
        FIGURE 58.US RESEARCH NANOMATERIALS, INC..: NET SALES ,($MILLION)


      According to the perspective of the CXOs of leading companies, increased investment in research and development, increased nano copper oxide penetration in many end-user sectors, and nano copper oxide's superior physiochemical qualities fuel its demand among diverse end-users. Typically, nano copper oxides are added in minute amounts to enhance the performance of the final product. Nonetheless, concerns such as severe toxicity to human lungs and aquatic life may impede market expansion. Currently, the largest end-user markets for nano copper oxides are electrical & electronics and catalysts. According to CXOs, the demand for nano copper oxide is on the rise in all areas due to its substantial physio-chemical qualities and the opportunities they create for all industry participants.

      PURCHASE OPTIONS

      Call or Email us

      U.S.-Canada Toll-free: +1-800-792-5285
      Int'l : +1-503-894-6022
      Europe : +44-845-528-1300
      Email : help@alliedmarketresearch.com
       
      FREQUENTLY ASKED QUESTIONS?

      A. Increasing demand from electrical and electronics industry owing to increased demand for compact and portable id driving the demand for nano copper oxide.

      A. Leading application of nano copper oxides are in automobile and electronics industry.

      A. The nano copper oxide market is projected to reach $ 84.8 million by 2031, growing at a CAGR of 8.1% from 2022 to 2031.

      A. American Elements, Hongwu International Group Ltd., Inframat Advanced Materials, LLC, Merck KGaA, Nanjing Emperor Nano materials Co., Ltd., Nanoshel LLC are some of the top companies to hold the market share in nano Copper Oxide.

      A. Asia-Pacific is the largest regional market for nano copper oxide market owing to increased demand from automotive and electronics industry.

      A. The nano copper oxide market is segmented on the basis of end-use industry. On the basis of end-use industry, the market is categorized into electricals & electronics, energy storage, paints & coatings, catalysts and others.

      A. The COVID-19 outbreak has severely affected several industries such as automobile and electrical manufacturing activities owing to temporary shutdown of manufacturing plants, leading to a drop in sales and disturbance in the supply–demand chain. This disruption in sales has affected the demand and consumption of products, leading to a substantial decline in market growth.

      Looking for Customization?

       Customization Request

      Have a Question?

       Speak with Analyst

      Any Confusion?

       Inquire Before Buying

      Have a glance of the Report

        Request Sample
      RELATED TAGS

      Purchase Full Report of
      Nano Copper Oxide Market

      Start reading instantly.
      This Report and over 68,094+ more Reports, Available with Avenue Library. T&C*.

      • Online Only
      • $3,570
      • Online cloud access only
      • Restricted print, copy, paste & download
      • Read only
      • Free industry update
        (Within 180 days)
      • Free report update in next update cycle
        (Jul 2023 - Jul 2024)
      • Data Pack
      • $3,840
      • Restricted to one authorized user
      • One print only
      • Available in
        Excel
      • Free industry update
        (Within 180 days)
      •   Free report update in next update cycle
        (Jul 2023 - Jul 2024)
      • Single User
      • $5,730
      • Restricted to one authorized user
      • One print only
      • Available in
        PDF
      • Free industry update
        (Within 180 days)
      •   Free report update in next update cycle
        (Jul 2023 - Jul 2024)
      • Five Users
      • $6,450
      • Limited to five authorized users
      • Print upto five copies
      • Available in
        PDF
      • Free industry update
        (Within 180 days)
      •   Free report update in next update cycle
        (Jul 2023 - Jul 2024)
      • Enterprise
        License/PDF

      • $9,600
      • Unlimited
        within
        company/enterprise
      • Available in Excel & PDF
      • Free industry update
        (Within 180 days)
      •   Free report update in next update cycle
        (Jul 2023 - Jul 2024)
      • Library
        Membership

      • $999 $ 1,175
        Per User/ Per month/ Billed annually
      • Published Content
        E-access
      • Company Profiles
        E-access
      • Newly Added Content Access
      • 10 PDF
        Downloads
      • 5 Excel Data
        Pack Downloads
      • 250 Company Profiles PDF Downloads
      • Buy Now

      *Taxes/Fees, if applicable will be added during checkout. All prices in USD

      RELATED REPORTS
       

      Why Allied Market Research?


      Infallible Methodology

      To ensure high-level data integrity, accurate analysis, and impeccable forecasts

      Analyst Support

      For complete satisfaction

      Customization

      On-demand customization of scope of the report to exactly meet your needs

      TARGETED MARKET VIEW

      Targeted market view to provide pertinent information and save time of readers

      Get fresh content delivered

      Get insights on topics that are crucial for your business. Stay abreast of your interest areas.

      Get Industry Data Alerts

      Why Allied Market Research?

      Infallible Methodology

      To ensure high-level data integrity, accurate analysis, and impeccable forecasts

      Analyst Support

      For complete satisfaction

      Customization

      On-demand customization of scope of the report to exactly meet your needs

      TARGETED MARKET VIEW

      Targeted market view to provide pertinent information and save time of readers