Report Code: A11782 | Jun 2021 | Pages: 200 | ||
Tables: 104 | Charts: 69 |
|
Pandemic disrupted the entire world and affected many industries.
Get detailed COVID-19 impact analysis on the Nanochemicals Market
Request Now !
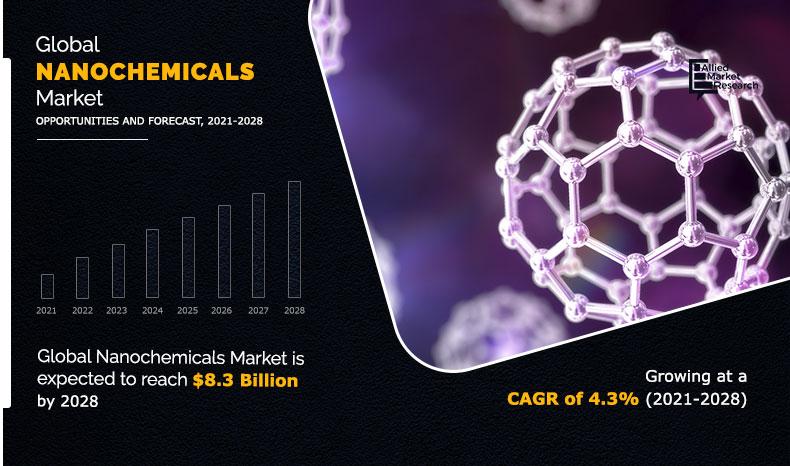
The global nanochemicals market was valued at $5.4 billion in 2020, and is anticipated to generate $8.3 billion by 2028. The market is projected to experience growth at a CAGR of 4.3% from 2021 to 2028.
There is a positive impact in the nanochemicals industry during the pandemic because huge investments were made in the sector for surface treatment, vaccine, and disinfection & cleaning applications.
In the recent years, the nanochemicals market has witnessed a sharp upsurge due to increase in polymer and ceramic demands. In addition, nanochemicals has found quite a demand in the medical field and the pharmaceuticals sectors, owing to increase in advancements and demand in these markets. Also, these are used in metallic, electronic chemicals, cleaners, industrial & specialty gases, and in various other rubber chemicals industries because of its non-resistant and fast reactions. It is also used in various kind of batteries because of less flame, lighter weight, high power density, and quick charging facilities. In developing countries like India, the demand for nanochemicals is increasing day by day because of development of new buildings. The nano chemicals are used in the manufacturing of nano-sized ceramic which in turn gives color to the ceramics in different applications. Also, the paint which is being developed using nanochemicals have very high refractive index and are very bright and hence will last longer.
The nanochemicals market is segmented on the basis of type, application, and region. Depending on type, the market is classified into metallic nano chemicals, ceramic nano chemicals, polymer nano chemicals, and other. By application, the market is divided into semiconductors & electronics, pharmaceuticals, food & agriculture, energy, textiles, and others. Region-wise, it is analyzed across North America, Europe, Asia-Pacific, and LAMEA (Latin America, Middle East, and Africa).
The key players operating in the market are BASF SE, DuPont, Evonik Industries AG, Huntsman Corporation, Merck KGaA, Mitsubishi Chemical Holding, SABIC, Solvay S.A., Sumitomo Corporation, and Thermo Fischer Scientific. The players in the market have adopted several strategies, such as type launch and business expansion, to sustain the market competition.
By type, the ceramic nanochemicals segment dominated the market in 2020 owing to the increased application in building & construction industry. However, polymer nanochemicals are projected to grow at a higher pace during the forecast period. This is attributed to increase in pharmaceuticals and semiconductors applications.
By application, the pharmaceutical segment dominated the nanochemicals market growth in 2020 owing to various properties of nanochemicals that are effective in drug delivery and thus widely used in the treatment and therapeutic solutions. The semiconductors & electricals segment is expected to grow at a notable CAGR during the forecast period owing to increased use of nano particles in computation sector.
By region, the nanochemicals market analysis is done across North America, Europe, Asia-Pacific, and LAMEA. North America dominated the nanochemicals market share in 2020 owing to technological advancement that benefits the growth of the region. Europe and Asia-Pacific are expected to grow at a higher CAGR during the forecast period due to rise in activities in nanochemicals in countries such as France, China, India, Malaysia, Spain and South Korea.
Key Benefits For Stakeholders
Key Market Segments
By Type
By Application
By Region
Key Players
Nanochemicals Market Report Highlights
Aspects | Details |
---|---|
By TYPE |
|
By APPLICATION |
|
By Region |
|
Key Market Players | MERCK KGaA, HUNTSMAN CORPORATION, THERMO FISHER SCIENTIFIC, DuPont., Solvay S.A., SUMITOMO CORPORATION, BASF SE, Evonik Industries AG, SABIC, MITSUBISHI CHEMICAL HOLDINGS |
CHAPTER 1:INTRODUCTION
1.1.Report description
1.2.Key benefits for stakeholders
1.3.Key market segments
1.4.Research methodology
1.4.1.Primary research
1.4.2.Secondary research
1.4.3.Analyst tools and models
CHAPTER 2:EXECUTIVE SUMMARY
2.1.Key findings of the study
2.2.CXO perspective
CHAPTER 3:MARKET LANDSCAPE
3.1.Market definition and scope
3.2.Key findings
3.2.1.Top investment pockets
3.3.Porter's five forces analysis
3.4.Value chain analysis
3.5.Market dynamics
3.5.1.Drivers
3.5.1.1.Growth in demand for nanochemicals in semiconductors & electronics applications
3.5.1.2.Growth of the paints & coatings industry in Asia-Pacific
3.5.2.Restraint
3.5.2.1.Low availability of raw
3.5.3.Opportunity
3.5.3.1.Technological advancements in the industry
3.6.COVID-19 impact analysis
CHAPTER 4:NANOCHEMICALS MARKET, BY TYPE
4.1.Overview
4.1.1.Market size and forecast
4.2.Metallic nanochemicals
4.2.1.Key market trends, growth factors, and opportunities
4.2.2.Market size and forecast, by region
4.3.Ceramic nanochemicals
4.3.1.Key market trends, growth factors, and opportunities
4.3.2.Market size and forecast, by region
4.4.Polymer nanochemicals
4.4.1.Key market trends, growth factors, and opportunities
4.4.2.Market size and forecast, by region
4.5.Others
4.5.1.Key market trends, growth factors, and opportunities
4.5.2.Market size and forecast, by region
CHAPTER 5:NANOCHEMICALS MARKET, BY APPLICATION
5.1.Overview
5.1.1.Market size and forecast
5.2.Semiconductors & electronics
5.2.1.Key market trends, growth factors, and opportunities
5.2.2.Market size and forecast, by region
5.3.Pharmaceuticals
5.3.1.Key market trends, growth factors, and opportunities
5.3.2.Market size and forecast, by region
5.4.Food & Agriculture
5.4.1.Key market trends, growth factors, and opportunities
5.4.2.Market size and forecast, by region
5.5.Energy
5.5.1.Key market trends, growth factors, and opportunities
5.5.2.Market size and forecast, by region
5.6.Textiles
5.6.1.Key market trends, growth factors, and opportunities
5.6.2.Market size and forecast, by region
5.7.Others
5.7.1.Key market trends, growth factors, and opportunities
5.7.2.Market size and forecast, by region
CHAPTER 6:NANOCHEMICALS MARKET, BY REGION
6.1.Overview
6.1.1.Market size and forecast
6.2.North America
6.2.1.Key market trends, growth factors, and opportunities
6.2.2.Market size and forecast, by type
6.2.3.Market size and forecast, by application
6.2.4.Market share analysis, by country
6.2.5.U.S.
6.2.5.1.Market size and forecast, by type
6.2.5.2.Market size and forecast, by application
6.2.6.Canada
6.2.6.1.Market size and forecast, by type
6.2.6.2.Market size and forecast, by application
6.2.7.Mexico
6.2.7.1.Market size and forecast, by type
6.2.7.2.Market size and forecast, by application
6.3.Europe
6.3.1.Key market trends, growth factors, and opportunities
6.3.2.Market size and forecast, by type
6.3.3.Market size and forecast, by application
6.3.4.Market share analysis, by country
6.3.5.GERMANY
6.3.5.1.Market size and forecast, by type
6.3.5.2.Market size and forecast, by application
6.3.6.UK
6.3.6.1.Market size and forecast, by type
6.3.6.2.Market size and forecast, by application
6.3.7.Franc
6.3.7.1.Market size and forecast, by type
6.3.7.2.Market size and forecast, by application
6.3.8.ITALY
6.3.8.1.Market size and forecast, by type
6.3.8.2.Market size and forecast, by application
6.3.9.Spain
6.3.9.1.Market size and forecast, by type
6.3.9.2.Market size and forecast, by application
6.3.10.Rest of Europe
6.3.10.1.Market size and forecast, by type
6.3.10.2.Market size and forecast, by application
6.4.Asia-Pacific
6.4.1.Key market trends, growth factors, and opportunities
6.4.2.Market size and forecast, by type
6.4.3.Market size and forecast, by application
6.4.4.Market share analysis, by country
6.4.5.CHINA
6.4.5.1.Market size and forecast, by type
6.4.5.2.Market size and forecast, by application
6.4.6.Japan
6.4.6.1.Market size and forecast, by type
6.4.6.2.Market size and forecast, by application
6.4.7.India
6.4.7.1.Market size and forecast, by type
6.4.7.2.Market size and forecast, by application
6.4.8.SOUTH KOREA
6.4.8.1.Market size and forecast, by type
6.4.8.2.Market size and forecast, by application
6.4.9.Australia
6.4.9.1.Market size and forecast, by type
6.4.9.2.Market size and forecast, by application
6.4.10.Rest of Asia-Pacific
6.4.10.1.Market size and forecast, by type
6.4.10.2.Market size and forecast, by application
6.5.LAMEA
6.5.1.Key market trends, growth factors, and opportunities
6.5.2.Market size and forecast, by type
6.5.3.Market size and forecast, by application
6.5.4.Market share analysis, by country
6.5.5.BRAZIL
6.5.5.1.Market size and forecast, by type
6.5.5.2.Market size and forecast, by application
6.5.6.Saudi Arabia
6.5.6.1.Market size and forecast, by type
6.5.6.2.Market size and forecast, by application
6.5.7.South Africa
6.5.7.1.Market size and forecast, by type
6.5.7.2.Market size and forecast, by application
6.5.8.Rest of LAMEA
6.5.8.1.Market size and forecast, by type
6.5.8.2.Market size and forecast, by application
CHAPTER 7:COMPETITIVE LANDSCAPE
7.1.Introduction
7.1.1.Market player positioning, 2020
CHAPTER 8:COMPANY PROFILES
8.1.BASF SE
8.1.1.Company overview
8.1.2.Company snapshot
8.1.3.Operating business segments
8.1.4.Product portfolio
8.1.5.Business performance
8.2.DuPont.
8.2.1Company overview
8.2.2.Company snapshot
8.2.3.Operating business segments
8.2.4.Product portfolio
8.2.5.Business performance
8.2.6.Key strategic moves and developments
8.3.Evonik Industries AG
8.3.1.Company overview
8.3.2.Company snapshot
8.3.3.Operating business segments
8.3.4.Product portfolio
8.3.5.Business performance
8.4.HUNTSMAN CORPORATION
8.4.1.Company overview
8.4.2.Company snapshot
8.4.3.Operating business segments
8.4.4.Product portfolio
8.4.5.Business performance
8.5.MERCK KGaA
8.5.1.Company overview
8.5.2.Company snapshot
8.5.3.Operating business segments
8.5.4.Product portfolio
8.5.5.Business performance
8.6.MITSUBISHI CHEMICAL HOLDINGS
8.6.1Company overview
8.6.2Company snapshot
8.6.3Operating business segments
8.6.4Product portfolio
8.6.5Business performance
8.7.SABIC
1.7.1Company overview
8.7.2.Company snapshot
8.7.3.Operating business segments
8.7.4.Product portfolio
8.7.5.Business performance
8.8.Solvay S.A.
8.8.1.Company overview
8.8.2.Company snapshot
8.8.3.Operating business segments
8.8.4.Product portfolio
8.8.5.Business performance
8.9.SUMITOMO CORPORATION
8.9.1.Company overview
8.9.2.Company snapshot
8.9.3.Operating business segments
8.9.4.Product portfolio
8.9.5.Business performance
8.10.THERMO FISHER SCIENTIFIC
8.10.1.Company overview
8.10.2.Company snapshot
8.10.3.Operating business segments
8.10.4.Product portfolio
8.10.5.Business performance
LIST OF TABLES
TABLE 01.GLOBAL NANOCHEMICALS MARKET, BY TYPE, 2020–2028 ($MILLION)
TABLE 02.METALLIC NANOCHEMICALS MARKET, BY REGION, 2020–2028 ($MILLION)
TABLE 03.CERAMIC NANOCHEMICALS MARKET, BY REGION, 2020–2028 ($MILLION)
TABLE 04.POLYMER NANOCHEMICALS MARKET, BY REGION, 2020–2028 ($MILLION)
TABLE 05.OTHERS NANOCHEMICALS MARKET, BY REGION, 2020–2028 ($MILLION)
TABLE 06.GLOBAL NANOCHEMICALS MARKET, BY APPLICATION, 2020–2028 ($MILLION)
TABLE 07.NANOCHEMICALS SEMICONDUCTORS & ELECTRONICS MARKET, BY REGION, 2020–2028 ($MILLION)
TABLE 08.NANOCHEMICALS PHARMACEUTICALS MARKET, BY REGION, 2020–2028 ($MILLION)
TABLE 09.NANOCHEMICALS FOOD & AGRICULTURE MARKET, BY REGION, 2020–2028 ($MILLION)
TABLE 10.NANOCHEMICALS ENERGY MARKET, BY REGION, 2020–2028 ($MILLION)
TABLE 11.NANOCHEMICALS TEXTILES MARKET, BY REGION, 2020–2028 ($MILLION)
TABLE 12.NANOCHEMICALS OTHERS MARKET, BY REGION, 2020–2028 ($MILLION)
TABLE 13.NANOCHEMICALS MARKET, BY REGION, 2020-2028 ($MILLION)
TABLE 14.NORTH AMERICA NANOCHEMICALS MARKET, BY TYPE, 2020–2028 ($MILLION)
TABLE 15.NORTH AMERICA NANOCHEMICALS MARKET, BY APPLICATION, 2020–2028 ($MILLION)
TABLE 16.NORTH AMERICA NANOCHEMICALS MARKET, BY COUNTRY, 2020–2028 ($MILLION)
TABLE 17.U.S. NANOCHEMICALS MARKET, BY TYPE, 2020–2028 ($MILLION)
TABLE 18.U.S. NANOCHEMICALS MARKET, BY APPLICATION, 2020–2028 ($MILLION)
TABLE 19.CANADA NANOCHEMICALS MARKET, BY TYPE, 2020–2028 ($MILLION)
TABLE 20.CANADA NANOCHEMICALS MARKET, BY APPLICATION, 2020–2028 ($MILLION)
TABLE 21.MEXICO NANOCHEMICALS MARKET, BY TYPE, 2020–2028 ($MILLION)
TABLE 22.MEXICO NANOCHEMICALS MARKET, BY APPLICATION, 2020–2028 ($MILLION)
TABLE 23.EUROPE NANOCHEMICALS MARKET, BY TYPE, 2020–2028 ($MILLION)
TABLE 24.EUROPE NANOCHEMICALS MARKET, BY APPLICATION, 2020–2028 ($MILLION)
TABLE 25.EUROPE NANOCHEMICALS MARKET, BY COUNTRY, 2020–2028 ($MILLION)
TABLE 26.GERMANY NANOCHEMICALS MARKET, BY TYPE, 2020–2028 ($MILLION)
TABLE 27.GERMANY NANOCHEMICALS MARKET, BY APPLICATION, 2020–2028 ($MILLION)
TABLE 28.UK NANOCHEMICALS MARKET, BY TYPE, 2020–2028 ($MILLION)
TABLE 29.UK NANOCHEMICALS MARKET, BY APPLICATION, 2020–2028 ($MILLION)
TABLE 30.FRANCE NANOCHEMICALS MARKET, BY TYPE, 2020–2028 ($MILLION)
TABLE 31.FRANCE NANOCHEMICALS MARKET, BY APPLICATION, 2020–2028 ($MILLION)
TABLE 32.ITALY NANOCHEMICALS MARKET, BY TYPE, 2020–2028 ($MILLION)
TABLE 33.ITALY NANOCHEMICALS MARKET, BY APPLICATION, 2020–2028 ($MILLION)
TABLE 34.SPAIN NANOCHEMICALS MARKET, BY TYPE, 2020–2028 ($MILLION)
TABLE 35.SPAIN NANOCHEMICALS MARKET, BY APPLICATION, 2020–2028 ($MILLION)
TABLE 36.REST OF EUROPE NANOCHEMICALS MARKET, BY TYPE, 2020–2028 ($MILLION)
TABLE 37.REST OF EUROPE NANOCHEMICALS MARKET, BY APPLICATION, 2020–2028 ($MILLION)
TABLE 38.ASIA-PACIFIC NANOCHEMICALS MARKET, BY TYPE, 2020–2028 ($MILLION)
TABLE 39.ASIA-PACIFIC NANOCHEMICALS MARKET, BY APPLICATION, 2020–2028 ($MILLION)
TABLE 40.ASIA-PACIFIC NANOCHEMICALS MARKET, BY COUNTRY, 2020–2028 ($MILLION)
TABLE 41.CHINA NANOCHEMICALS MARKET, BY TYPE, 2020–2028 ($MILLION)
TABLE 42.CHINA NANOCHEMICALS MARKET, BY APPLICATION, 2020–2028 ($MILLION)
TABLE 43.JAPAN NANOCHEMICALS MARKET, BY TYPE, 2020–2028 ($MILLION)
TABLE 44.JAPAN NANOCHEMICALS MARKET, BY APPLICATION, 2020–2028 ($MILLION)
TABLE 45.INDIA NANOCHEMICALS MARKET, BY TYPE, 2020–2028 ($MILLION)
TABLE 46.INDIA NANOCHEMICALS MARKET, BY APPLICATION, 2020–2028 ($MILLION)
TABLE 47.SOUTH KOREA NANOCHEMICALS MARKET, BY TYPE, 2020–2028 ($MILLION)
TABLE 48.SOUTH KOREA NANOCHEMICALS MARKET, BY APPLICATION, 2020–2028 ($MILLION)
TABLE 49.AUSTRALIA NANOCHEMICALS MARKET, BY TYPE, 2020–2028 ($MILLION)
TABLE 50.AUSTRALIA NANOCHEMICALS MARKET, BY APPLICATION, 2020–2028 ($MILLION)
TABLE 51.REST OF ASIA-PACIFIC NANOCHEMICALS MARKET, BY TYPE, 2020–2028 ($MILLION)
TABLE 52.REST OF ASIA-PACIFIC NANOCHEMICALS MARKET, BY APPLICATION, 2020–2028 ($MILLION)
TABLE 53.LAMEA NANOCHEMICALS MARKET, BY TYPE, 2020–2028 ($MILLION)
TABLE 54.LAMEA NANOCHEMICALS MARKET, BY APPLICATION, 2020–2028 ($MILLION)
TABLE 55.LAMEA NANOCHEMICALS MARKET, BY COUNTRY, 2020–2028 ($MILLION)
TABLE 56.BRAZIL NANOCHEMICALS MARKET, BY TYPE, 2020–2028 ($MILLION)
TABLE 57.BRAZIL NANOCHEMICALS MARKET, BY APPLICATION, 2020–2028 ($MILLION)
TABLE 58.SAUDI ARABIA NANOCHEMICALS MARKET, BY TYPE, 2020–2028 ($MILLION)
TABLE 59.SAUDI ARABIA NANOCHEMICALS MARKET, BY APPLICATION, 2020–2028 ($MILLION)
TABLE 60.SOUTH AFRICA NANOCHEMICALS MARKET, BY TYPE, 2020–2028 ($MILLION)
TABLE 61.SOUTH AFRICA NANOCHEMICALS MARKET, BY APPLICATION, 2020–2028 ($MILLION)
TABLE 62.REST OF LAMEA NANOCHEMICALS MARKET, BY TYPE, 2020–2028 ($MILLION)
TABLE 63.REST OF LAMEA NANOCHEMICALS MARKET, BY APPLICATION, 2020–2028 ($MILLION)
TABLE 64.BASF: COMPANY SNAPSHOT
TABLE 65.BASF: OPERATING SEGMENTS
TABLE 66.BASF: PRODUCT PORTFOLIO
TABLE 67.OVERALL FINANCIAL STATUS ($MILLION)
TABLE 68.DUPONT.: COMPANY SNAPSHOT
TABLE 69.DUPONT: OPERATING SEGMENTS
TABLE 70.DUPONT.: PRODUCT PORTFOLIO
TABLE 71.OVERALL FINANCIAL STATUS (20,397MILLIO$)
TABLE 72.DUPONT KEY STRATEGIC MOVES AND DEVELOPMENTS
TABLE 73.EVONIK INDUSTRIES AG.: COMPANY SNAPSHOT
TABLE 74.EVONIK INDUSTRIES AG.: OPERATING SEGMENTS
TABLE 75.EVONIK INDUSTRIES AG: PRODUCT PORTFOLIO
TABLE 76.OVERALL FINANCIAL STATUS ($MILLION)
TABLE 77.HUNTSMAN: COMPANY SNAPSHOT
TABLE 78.HUNTSMAN: OPERATING SEGMENTS
TABLE 79.HUNTSMAN: PRODUCT PORTFOLIO
TABLE 80.OVERALL FINANCIAL STATUS ($MILLION)
TABLE 81.MERCK: COMPANY SNAPSHOT
TABLE 82.MERCK: OPERATING SEGMENTS
TABLE 83.MERCK: PRODUCT PORTFOLIO
TABLE 84.OVERALL FINANCIAL STATUS ($MILLION)
TABLE 85.MITSUBISHI: COMPANY SNAPSHOT
TABLE 86.MITSUBISHI: OPERATING SEGMENTS
TABLE 87.MITSUBISHI: PRODUCT PORTFOLIO
TABLE 88.OVERALL FINANCIAL STATUS ($MILLION)
TABLE 89.SABIC: COMPANY SNAPSHOT
TABLE 90.SABIC: OPERATING SEGMENTS
TABLE 91.SABIC: PRODUCT PORTFOLIO
TABLE 92.OVERALL FINANCIAL STATUS ($MILLION)
TABLE 93.SOLVAY S.A.: COMPANY SNAPSHOT
TABLE 94.SOLVAY S.A.: OPERATING SEGMENTS
TABLE 95.SOLVAY S.A.: PRODUCT PORTFOLIO
TABLE 96.OVERALL FINANCIAL STATUS ($MILLION)
TABLE 97.SUMITOMO CORPORATION: COMPANY SNAPSHOT
TABLE 98.SUMITOMO CORPORATION: BUSINESS SEGMENTS
TABLE 99.SUMITOMO CORPORATION: PRODUCT PORTFOLIO
TABLE 100.OVERALL FINANCIAL STATUS ($MILLION)
TABLE 101.THERMO FISHER: COMPANY SNAPSHOT
TABLE 102.THERMO FISHER: OPERATING SEGMENTS
TABLE 103.THERMO FISHER: PRODUCT PORTFOLIO
TABLE 104.OVERALL FINANCIAL STATUS ($MILLION)
LIST OF FIGURES
FIGURE 01.KEY MARKET SEGMENTS
FIGURE 02.GLOBAL NANOCHEMICALS MARKET SNAPSHOT, BY SEGMENT
FIGURE 03.GLOBAL NANOCHEMICALS MARKET SNAPSHOT, BY COUNTRY
FIGURE 04.TOP INVESTMENT POCKETS
FIGURE 05.LOW BARGAINING POWER OF SUPPLIERS
FIGURE 06.HIGH THREAT OF NEW ENTRANTS
FIGURE 07.MODERATE THREAT OF SUBSTITUTES
FIGURE 08.LOW INTENSITY OF RIVALRY
FIGURE 09.HIGH BARGAINING POWER OF BUYERS
FIGURE 10.VALUE CHAIN ANALYSIS FOR NANOCHEMICALS MARKET
FIGURE 11.NANOCHEMICALS MARKET DYNAMICS
FIGURE 12.GLOBAL NANOCHEMICALS MARKET, BY TYPE, 2020–2028 ($MILILION)
FIGURE 13.COMPARATIVE ANALYSIS OF METALLIC NANOCHEMICALS MARKET, BY COUNTRY, 2020 & 2028 ($MILLION)
FIGURE 14.COMPARATIVE ANALYSIS OF CERAMIC NANOCHEMICALS MARKET, BY COUNTRY, 2020 & 2028 ($MILLION)
FIGURE 15.COMPARATIVE ANALYSIS OF POLYMER NANOCHEMICALS MARKET, BY COUNTRY, 2020 & 2028 ($MILLION)
FIGURE 16.COMPARATIVE ANALYSIS OF OTHERS MARKET, BY COUNTRY, 2020 & 2028 ($MILLION)
FIGURE 17.GLOBAL NANOCHEMICALS MARKET, BY APPLICATION, 2020–2028 ($MILILION)
FIGURE 18.COMPARATIVE ANALYSIS OF NANOCHEMICALS SEMICONDUCTORS & ELECTRONICS MARKET, BY COUNTRY, 2020 & 2028 ($MILLION)
FIGURE 19.COMPARATIVE ANALYSIS OF NANOCHEMICALS PHARMACEUTICALS MARKET, BY COUNTRY, 2020 & 2028 ($MILLION)
FIGURE 20.COMPARATIVE ANALYSIS OF NANOCHEMICALS FOOD & AGRICULTURE MARKET, BY COUNTRY, 2020 & 2028 ($MILLION)
FIGURE 21.COMPARATIVE ANALYSIS OF NANOCHEMICALS ENERGY MARKET, BY COUNTRY, 2020 & 2028 ($MILLION)
FIGURE 22.COMPARATIVE ANALYSIS OF NANOCHEMICALS TEXTILES MARKET, BY COUNTRY, 2020 & 2028 ($MILLION)
FIGURE 23.COMPARATIVE ANALYSIS OF NANOCHEMICALS OTHERS MARKET, BY COUNTRY, 2020 & 2028 ($MILLION)
FIGURE 24.U.S. NANOCHEMICALS MARKET REVENUE, 2020–2028 (MILLION)
FIGURE 25.CANADA NANOCHEMICALS MARKET REVENUE, 2020–2028 (MILLION)
FIGURE 26.MEXICO NANOCHEMICALS MARKET REVENUE, 2020–2028 (MILLION)
FIGURE 27.GERMANY NANOCHEMICALS MARKET REVENUE, 2020–2028 (MILLION)
FIGURE 28.UK NANOCHEMICALS MARKET REVENUE, 2020–2028 (MILLION)
FIGURE 29.FRANCE NANOCHEMICALS MARKET REVENUE, 2020–2028 (MILLION)
FIGURE 30.ITALY NANOCHEMICALS MARKET REVENUE, 2020–2028 (MILLION)
FIGURE 31.SPAIN NANOCHEMICALS MARKET REVENUE, 2020–2028 (MILLION)
FIGURE 32.REST OF EUROPE NANOCHEMICALS MARKET REVENUE, 2020–2028 (MILLION)
FIGURE 33.CHINA NANOCHEMICALS MARKET REVENUE, 2020–2028 (MILLION)
FIGURE 34.JAPAN NANOCHEMICALS MARKET REVENUE, 2020–2028 (MILLION)
FIGURE 35.INDIA NANOCHEMICALS MARKET REVENUE, 2020–2028 (MILLION)
FIGURE 36.SOUTH KOREA NANOCHEMICALS MARKET REVENUE, 2020–2028 (MILLION)
FIGURE 37.AUSTRALIA NANOCHEMICALS MARKET REVENUE, 2020–2028 (MILLION)
FIGURE 38.REST OF ASIA-PACIFIC NANOCHEMICALS MARKET REVENUE, 2020–2028 (MILLION)
FIGURE 39.BRAZIL NANOCHEMICALS MARKET REVENUE, 2020–2028 (MILLION)
FIGURE 40.SAUDI ARABIA NANOCHEMICALS MARKET REVENUE, 2020–2028 (MILLION)
FIGURE 41.SOUTH AFRICA NANOCHEMICALS MARKET REVENUE, 2020–2028 (MILLION)
FIGURE 42.REST OF LAMEA NANOCHEMICALS MARKET REVENUE, 2020–2028 (MILLION)
FIGURE 43.MARKET PLAYER POSITIONING, 2020
FIGURE 44.BASF: REVENUE, 2018–2020 ($MILLION)
FIGURE 45.BASF: REVENUE SHARE BY SEGMENT, 2020 (%)
FIGURE 46.BASF: REVENUE SHARE BY REGION, 2020 (%)
FIGURE 47.DUPONT.: NET SALES, 2018–2020
FIGURE 48.DUPONT: REVENUE SHARE BY BUSINESS SEGMENT, 2020
FIGURE 49.EVONIK INDUSTRIES AG: NET REVENUE, 2020 (%)
FIGURE 50.EVONIK INDUSTRIES AG : REVENUE SHARE, BY SEGMENT, 2020 (%)
FIGURE 51.HUNTSMAN: REVENUE, 2018–2020 ($MILLION)
FIGURE 52.HUNTSMAN: REVENUE SHARE BY SEGMENT, 2020 (%)
FIGURE 53.HUNTSMAN: REVENUE SHARE BY REGION, 2020 (%)
FIGURE 54.MERCK: REVENUE, 2018–2020 ($MILLION)
FIGURE 55.MERCK: REVENUE SHARE BY SEGMENT, 2020 (%)
FIGURE 56.MERCK: REVENUE SHARE BY REGION, 2020 (%)
FIGURE 57.MITSUBISHI: REVENUE, 2018–2020 ($MILLION)
FIGURE 58.MITSUBISHI: REVENUE SHARE BY SEGMENT, 2020 (%)
FIGURE 59.MITSUBISHI: REVENUE SHARE BY REGION, 2020 (%)
FIGURE 60.SABIC: NET SALES, 2018–2020 ($MILLION)
FIGURE 61.SABIC: REVENUE SHARE BY SEGMENT, 2020 (%)
FIGURE 62.SABIC: REVENUE SHARE BY REGION, 2020 (%)
FIGURE 63.SOLVAY S.A.: NET SALES, 2018–2020 ($MILLION)
FIGURE 64.SOLVAY S.A.: REVENUE SHARE, BY SEGMENT, 2020
FIGURE 65.SUMITOMO CORPORATION: NET SALES, 2018–2020 ($MILLION)
FIGURE 66.SUMITOMO CORPORATION: REVENUE SHARE, BY SEGMENT, 2020 (%)
FIGURE 67.THERMO FISHER: REVENUE, 2018–2020 ($MILLION)
FIGURE 68.THERMO FISHER: REVENUE SHARE BY SEGMENT, 2020 (%)
FIGURE 69.THERMO FISHER: REVENUE SHARE BY REGION, 2020 (%)
The nanochemicals market is highly consolidated in nature. It has applications in various industries such as defense, textiles, manufacturing, pharmaceuticals, semiconductors, and energy generation. The recent trends in the market show a sharp upsurge in the nanochemicals market due to increase in polymer and ceramic nanochemicals demand. These products are widely popular in North America and Europe owing to their extensive use in the military equipment. The nanochemical materials are used in developing batteries, which exhibit quick charging, have very light weight, is more efficient, and can hold the electrical charge longer as compared to the traditional batteries, which in turn helps in saving time. Such applications have led the market toward a notable growth rate. However, these are small in size and exhibit fast reaction mechanisms, which can be very hazardous to human body and the environment and thus hinder the growth of the market in the upcoming years.
A. Increase in polymer and ceramic demands are the key factors driving the Nanochemicals market.
A. The market share of Nanochemicals market $5.4 billion in 2020.
A. The rising use of medicines has also led to rise in demand of Nanochemicals in-addition with food & beverage industry.
A. Europe and Asia-Pacific will provide more business opportunities for Nanochemicals market in future.
A. Business expansion and acquisition are the key growth strategies of Nanochemicals market players.
A. The leading players in the market are BASF SE, DuPont, Evonik Industries AG, Huntsman Corporation, Merck KGaA, Mitsubishi Chemical Holding, SABIC, Solvay S.A., Sumitomo Corporation, and Thermo Fischer Scientific.
A. Pharmaceutical’s segment based on application holds the maximum market share of the Nanochemicals market.
A. Food & beverage, pharmaceuticals, semiconductors & electronics, automotive, and cosmetics are the potential customers of Nanochemicals industry.
Start reading instantly.
This Report and over 66,782+ more Reports, Available with Avenue Library. T&C*.
Enterprise
License/PDF
Library
Membership
*Taxes/Fees, if applicable will be added during checkout. All prices in USD
To ensure high-level data integrity, accurate analysis, and impeccable forecasts
For complete satisfaction
On-demand customization of scope of the report to exactly meet your needs
Targeted market view to provide pertinent information and save time of readers
Get insights on topics that are crucial for your business. Stay abreast of your interest areas.
Get Industry Data AlertsTo ensure high-level data integrity, accurate analysis, and impeccable forecasts
For complete satisfaction
On-demand customization of scope of the report to exactly meet your needs
Targeted market view to provide pertinent information and save time of readers