0
2021
Nepheline Market

Nepheline Market

by Product Type (Nepheline Syenite, Nepheline Monzonite, and Nephelinites) and Application (Ceramic Product, Glass Product, Refractories, and Others): Global Opportunity Analysis and Industry Forecast, 2020-2027

Report Code: A02773
May 2021 | Pages: 251
Tables: 156
Charts: 65
  • Formats*:

  • pdf

    Single User License, Five User
    License & Enterprise User License

  • xls

    Data Pack Excel License

  • ppt

    It comes with the additional cost
    of $2500.00 contact sales.


COVID-19

Pandemic disrupted the entire world and affected many industries.

Get detailed COVID-19 impact analysis on the Nepheline Market

Request Now !

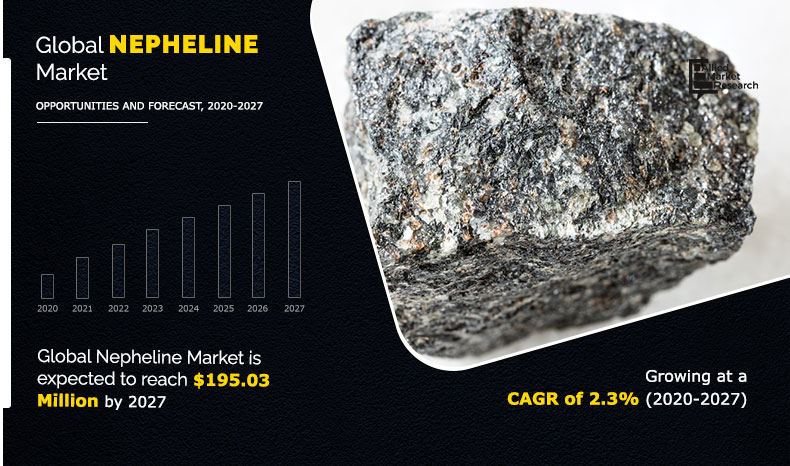
The global nepheline market size was valued at $171.70 million in 2019, and is projected to reach $195.03 million by 2027, growing at a CAGR of 2.3% from 2020 to 2027.

The global nepheline market witnessed a negative effect in the COVID-19 pandemic. Major ceramic and tile manufacturers across the world are facing problems despite of no construction ban. This is attributed to disruption in value chain and closure of other industries that are directly or indirectly linked with the ceramic sector.

Nepheline, also known as nephelite or eleolite, is extracted from rock mineral that belongs to feldspathoid group. It exhibits similar structure to that of tridymite mineral consisting of two polymorph groups and aluminosilicate of sodium & potassium. It is used as a substitute for manufacturing of glass and ceramic. Nepheline syenite, nepheline monzonite, and nephelinites are types of nepheline that are available in the market. Nepheline syenite is a plutonic rock that is made up of feldspar and nepheline, and if the quantity of sodic plagioclase exceeds the quantity alkali feldspar in nepheline syenite it is known as nepheline monzonite. Nephelinite is fine grained aphanitic igneous rock that is made up of nepheline and pyroxene. 

Nepheline-Market

Nepheline syenite is widely used in paints & coatings, adhesives, plastics, and inks, owing to its ability to enhance performance. Brightness, tint retention, and weatherability are utmost important parameters in exterior paints that can be achieved by using nepheline syenite. In addition, use nepheline syenite helps to achieve color, sheen uniformity and chemical & stain resistance as well as prolong durability of interior paints. These factors are predicted to augment the growth of the global nepheline market. In addition, rise in use of nepheline syenite in industrial process such as ceramic tile, refractories, filler, and extraction of rare earth elements (REE) is anticipated to contribute toward the growth of the global market. However, high transportation cost involved in carrying nepheline from extraction sites to processing industries such as glass and ceramics hampers the nepheline market growth. 

On the contrary, availability of nepheline reserve in countries such as India, China, Canada, Morocco, and Italy and the development of ceramic and electronic industries are predicted to offer lucrative opportunities for market expansion in the upcoming period. In addition, increase in import and export of nepheline syenite to meet the demand of construction and automotive sectors is likely to provide potential opportunities for the global market. For instance, according to the domestic survey by U.S. Geological Survey (USGS), a scientific agency that is formed by the U.S. Government, Canada exported 1 MT of nepheline syenite in 2018 that was majorly consumed by the construction and automotive sectors.

The global nepheline market analysis is done based on product type, application, and region. On the basis of product type, the market is categorized into nepheline syenite, nepheline monzonite, and nephelinites. The applications covered in the study include ceramic products, glass products, refractories, and others. Region wise, the global market is studied across North America, Europe, Asia-Pacific, and LAMEA. 

The major companies profiled in this report include AGSCO Corporation, Unimin Corp. (COVIA), Phos Agro Group of Companies, Anglo Pacific Minerals Ltd., Anyang Country Mining Co Ltd., SCR Sibelco, RUSAL PLC, The 3M Company, Fineton Industrial Minerals Ltd., and North Cape Minerals AS.

Nepheline market, by region 

Asia-Pacific is projected to grow at the fastest CAGR of 3.5%. China and India are the largest manufacturers of ceramic tiles in Asia-Pacific. Surge in production and consumption of ceramic tiles in Vietnam is the major factor that augments the growth of the nepheline market. However, North America accounted for the largest share in the global nepheline market in 2019. This is attributed to the presence of number of nepheline synite deposits and production sites in Canada and the U.S. 

Nepheline Market
By Region

2027
North America 
Europe
Asia-Pacific
LAMEA

Asia-Pacific would exhibit highest CAGR of 3.50% during 2019-2027.

Get more information on this report : Request Sample Pages

Global nepheline market, by product type

By product type, the nepheline syenite segment garnered the largest share in the global nepheline market in 2019, and is projected to exhibit a CAGR of 2.4% during the forecast period. This is attributed to the fact that nepheline syenite witnessing increased demand in applications such as glass, ceramic, coatings, plastic, and rubber.

Nepheline Market
By Product

Your browser does not support the canvas element.

Nepheline syenite segment is the most lucrative segment

Get more information on this report : Request Sample Pages

Global nepheline market, by application

Depending on application, the glass product segment acquired the largest revenue share in the global nepheline market This is attributed to the fact that nepheline possesses properties such as high melting pressure, UV resistance, and chemical & thermal stability, which make it an ideal choice for glass manufacturing. This is the major factor that is escalating the use of nepheline for production of container glass. However, the refractories production segment grows at the highest CAGR of 2.6%, as nepheline possesses the ability to withstand high temperature range, making it a suitable chemical compound for production of refractories.

Nepheline Market
By Application

Your browser does not support the canvas element.

Refractories application is projected as the fastest growing segment

Get more information on this report : Request Sample Pages

Key benefits for stakeholders

  • Porter’s five forces analysis helps to analyze the potential of buyers & suppliers and the competitive scenario of the industry for strategy building.
  • It outlines the current nepheline market trends and future estimations from 2019 to 2027 to understand the prevailing opportunities and potential investment pockets.
  • The major countries in the region have been mapped according to their individual revenue contribution to the regional market.
  • The key drivers, restraints, and opportunities and their detailed impact analysis are explained in the study.
  • The profiles of key players and their key strategic developments are enlisted in the report.

Impact of COVID-19 on the global nepheline market

  • The COVID-19 pandemic has negatively affected the global economy and is subsequent shrinking the GDP in global economies, thereby changing consumer spending patterns globally.
  • Several challenges have been faced by the glass industry due to the outbreak of the pandemic such as temporary closure of manufacturing sites and travel restrictions, which, in turn, has created logistical supply issue and delay is shipment.
  • Major ceramic and tile manufacturers across the world are facing problems despite of no construction ban. This is attributed to disruption in value chain and closure of other industries that are directly or indirectly linked with the ceramic sector.
  • The real estate sector is directly dependent on the growth of the ceramic tile sector. Owing to unavailability of raw materials, slowdown in the construction sector, and restrictions laid by government to prevent the spread of virus, the demand for ceramic tile has declined considerably. Thus, consumption and production of nepheline have been hampered during the COVID-19 pandemic.      
  • In addition, other industries such as refractories and glass are hit due to the global health crisis, which, in turn, has negatively affected the global nepheline market.  

Key Market Segments

By Product Type

  • Nepheline Syenite 
  • Nepheline Monzonite 
  • Nephelinites 

By Application

  • Ceramic Product
  • Glass Product
  • Refractories 
  • Other

By Region

  • North America
    • U.S.
    • Canada
    • Mexico
  • Europe
    • Germany
    • France
    • U.K.
    • Italy
    • Rest of Europe
  • Asia-Pacific
    • China
    • Japan
    • India
    • Australia
    • Rest of Asia-Pacific
  • LAMEA
    • Brazil
    • Saudi Arabia
    • UAE
    • South Africa
    • Rest of LAMEA

Key players in the global nepheline market are:

  • AGSCO Corporation 
  • Unimin Corp. (COVIA)
  • Phos Agro Group of Companies 
  • Anglo Pacific Minerals Ltd. 
  • Anyang Country Mining Co. Ltd.
  • SCR Sibelco
  • RUSAL PLC
  • The 3M Company
  • Fineton Industrial Minerals Ltd.
  • North Cape Minerals AS

Nepheline Market Report Highlights

Aspects Details
By PRODUT TYPE
  • Nepheline syenite
  • Nepheline monzonite
  • Nephelinites
By APPLICATION
  • Ceramic products
  • Glass products
  • Refractories
  • Others
By Region
  • North America  (U.S., Canada, Mexico)
  • Europe  (France, Germany, Italy, Spain, UK, Russia, Rest of Europe)
  • Asia-Pacific  (China, Japan, India, South Korea, Australia, Thailand, Malaysia, Indonesia, Rest of Asia-Pacific)
  • LAMEA  (Brazil, South Africa, Saudi Arabia, UAE, Argentina, Rest of LAMEA)
Key Market Players .RUSAL PLC, Phos Agro Group of Companies, .SCR Sibelco, Anyang Jiulong Mineral Industry Co., Ltd., Unimin Corporation (COVIA), The 3M Company, AGSCO Corporation, FINETON Industrial Minerals Limited, Anglo Pacific Minerals Ltd.
 

CHAPTER 1:INTRODUCTION

1.1.Report description
1.2.Key benefits for stakeholders
1.3.Key market segments
1.4.Research methodology

1.4.1.Secondary research
1.4.2.Primary research
1.5.Analyst tools and models

CHAPTER 2:EXECUTIVE SUMMARY

2.1.Key findings of the study
2.2.CXO perspective

CHAPTER 3:MARKET OVERVIEW

3.1.Market definition and scope
3.2.Key findings

3.2.1.Top investment pockets

3.3.Porter’s five forces analysis
3.4.Market dynamics

3.4.1.Drivers

3.4.1.1.Increased adoption of nepheline during glass manufacturing
3.4.1.2.Rise in adoption of nepheline in ceramic products

3.4.2.Restraint

3.4.2.1.Escalating transportation costs

3.4.3.Opportunity

3.4.3.1.Upcoming power projects to open up opportunities for the market

3.5.Value chain analysis
3.6.Impact of key regulations on the global nepheline market
3.7.Impact of COVID-19 on the global nepheline market
3.8.Patent analysis, 2012-2020

CHAPTER 4:GLOBAL NEPHELINE MARKET, BY PRODUT TYPE

4.1.Overview

4.1.1.Market size and forecast, by product type

4.2.Nepheline syenite

4.2.1.Key market trends, growth factors, and opportunities
4.2.2.Market size and forecast, by region
4.2.3.Market share analysis, by country

4.3.Nepheline monzonite

4.3.1.Key market trends, growth factors, and opportunities
4.3.2.Market size and forecast, by region
4.3.3.Market share analysis, by country

4.4.Nephelinites

4.4.1.Key market trends, growth factors, and opportunities
4.4.2.Market size and forecast, by region
4.4.3.Market share analysis, by country

CHAPTER 5:GLOBAL NEPHELINE MARKET, BY APPLICATION

5.1.Overview

5.1.1.Market size and forecast

5.2.Ceramic products

5.2.1.Key market trends, growth factors, and opportunities
5.2.2.Market size and forecast, by region
5.2.3.Market share analysis, by country

5.3.Glass products

5.3.1.Key market trends, growth factors, and opportunities
5.3.2.Market size and forecast, by region
5.3.3.Market share analysis, by country

5.4.Refractories

5.4.1.Key market trends, growth factors, and opportunities
5.4.2.Market size and forecast, by region
5.4.3.Market share analysis, by country

5.5.Others

5.5.1.Key market trends, growth factors, and opportunities
5.5.2.Market size and forecast, by region
5.5.3.Market share analysis, by country

CHAPTER 6:NEPHELINE MARKET, BY REGION

6.1.Overview

6.1.1.Market size and forecast

6.2.North America

6.2.1.Key market trends, growth factors, and opportunities
6.2.2.Market size and forecast, by product type
6.2.3.Market size and forecast, by application
6.2.4.Market share analysis, by country
6.2.5.U.S.

6.2.5.1.Market size and forecast, by product type
6.2.5.2.Market size and forecast, by application

6.2.6.Canada

6.2.6.1.Market size and forecast, by product type
6.2.6.2.Market size and forecast, by application

6.2.7.Mexico

6.2.7.1.Market size and forecast, by product type
6.2.7.2.Market size and forecast, by application

6.3.Europe

6.3.1.Key market trends, growth factors, and opportunities
6.3.2.Market size and forecast, by product type
6.3.3.Market size and forecast, by application
6.3.4.Market size and forecast, by country
6.3.5.Germany

6.3.5.1.Market size and forecast, by product type
6.3.5.2.Market size and forecast, by application

6.3.6.UK

6.3.6.1.Market size and forecast, by product type
6.3.6.2.Market size and forecast, by application

6.3.7.France

6.3.7.1.Market size and forecast, by product type
6.3.7.2.Market size and forecast, by application

6.3.8.Italy

6.3.8.1.Market size and forecast, by product type
6.3.8.2.Market size and forecast, by application

6.3.9.Rest of Europe

6.3.9.1.Market size and forecast, by product type
6.3.9.2.Market size and forecast, by application

6.4.Asia-Pacific

6.4.1.Key market trends, growth factors, and opportunities
6.4.2.Market size and forecast, by product type
6.4.3.Market size and forecast, by application
6.4.4.Market size and forecast, by country
6.4.5.China

6.4.5.1.Market size and forecast, by product type
6.4.5.2.Market size and forecast, by application

6.4.6.Japan

6.4.6.1.Market size and forecast, by product type
6.4.6.2.Market size and forecast, by application

6.4.7.India

6.4.7.1.Market size and forecast, by product type
6.4.7.2.Market size and forecast, by application

6.4.8.Australia

6.4.8.1.Market size and forecast, by product type
6.4.8.2.Market size and forecast, by application

6.4.9.Rest of Asia-Pacific

6.4.9.1.Market size and forecast, by product type
6.4.9.2.Market size and forecast, by application

6.5.LAMEA

6.5.1.Key market trends, growth factors, and opportunities
6.5.2.Market size and forecast, by product type
6.5.3.Market size and forecast, by application
6.5.4.Market size and forecast, by country
6.5.5.Brazil

6.5.5.1.Market size and forecast, by product type
6.5.5.2.Market size and forecast, by application

6.5.6.Saudi Arabia

6.5.6.1.Market size and forecast, by product type
6.5.6.2.Market size and forecast, by application

6.5.7.UAE

6.5.7.1.Market size and forecast, by product type
6.5.7.2.Market size and forecast, by application

6.5.8.South Africa

6.5.8.1.Market size and forecast, by product type
6.5.8.2.Market size and forecast, by application

6.5.9.Rest of LAMEA

6.5.9.1.Market size and forecast, by product type
6.5.9.2.Market size and forecast, by application

CHAPTER 7:COMPETITIVE LANDSCAPE

7.1.Introduction

7.1.1.Market player positioning, 2020

7.2.Top winning strategies

7.2.1.Top winning strategies, by year
7.2.2.Top winning strategies, by development
7.2.3.Top winning strategies, by company

7.3.Product mapping of top 10 player
7.4.Competitive dashboard
7.5.Competitive heatmap
7.6.Key developments

7.6.1.New product launches
7.6.2.Expansions

CHAPTER 8:COMPANY PROFILES

8.1.AGSCO Corporation

8.1.1.Company overview
8.1.2.Company snapshot
8.1.3.Operating business segments
8.1.4.Product portfolio

8.2.Anglo Pacific Minerals Ltd.

8.2.1.Company overview
8.2.2.Company snapshot
8.2.3.Operating business segments
8.2.4.Product portfolio
8.2.5.Business performance

8.3.Anyang Jiulong Mineral Industry Co., Ltd.

8.3.1.Company overview
8.3.2.Company snapshot
8.3.3.Operating business segments 
8.3.4.Product Portfolio

8.4.FINETON Industrial Minerals Limited

8.4.1.Company overview
8.4.2.Company snapshot
8.4.3.Operating Business Segments
8.4.4.Product portfolio

8.5.North Cape Minerals (Sibelco Nordic)

8.5.1.Company overview
8.5.2.Company snapshot
8.5.3.Operating business segments
8.5.4.Product portfolio

8.6.Phos Agro Group of Companies

8.6.1.Company overview
8.6.2.Company snapshot
8.6.3.Operating business segments
8.6.4.Product portfolio
8.6.5.Business performance
8.6.6.Key strategic moves and developments

8.7.RUSAL PLC

8.7.1.Company overview
8.7.2.Company snapshot
8.7.3.Operating business segments
8.7.4.Product portfolio
8.7.5.Business performance
8.7.6.Key strategic moves and developments

8.8.SCR Sibelco

8.8.1.Company overview
8.8.2.Company snapshot
8.8.3.Operating business segments
8.8.4.Product portfolio
8.8.5.Business performance

8.9.The 3M Company

8.9.1.Company overview
8.9.2.Company snapshot
8.9.3.Operating business segments
8.9.4.Product portfolio
8.9.5.Business performance

8.10.Unimin Corporation (COVIA)

8.10.1.Company overview
8.10.2.Company snapshot
8.10.3.Operating business segments
8.10.4.Product portfolio
8.10.5.Business performance
8.10.6.Key strategic moves and developments

LIST OF TABLES

TABLE 01.GLOBAL NEPHELINE MARKET, BY PRODUCT TYPE, 2019-2027 ($MILLION)
TABLE 02.GLOBAL NEPHELINE MARKET, BY PRODUCT TYPE, 2019-2027 (TON)
TABLE 03.NEPHELINE MARKET FOR NEPHELINE SYENITE, BY REGION, 2019–2027 ($MILLION)
TABLE 04.NEPHELINE MARKET FOR NEPHELINE SYENITE, BY REGION, 2019–2027 (TON)
TABLE 05.NEPHELINE MARKET FOR NEPHELINE MONZONITE, BY REGION, 2019–2027 ($MILLION)
TABLE 06.NEPHELINE MARKET FOR NEPHELINE MONZONITE, BY REGION, 2019–2027 (TON)
TABLE 07.NEPHELINE MARKET FOR NEPHELINITES, BY REGION, 2019–2027 ($MILLION)
TABLE 08.NEPHELINE MARKET FOR NEPHELINITES, BY REGION, 2019–2027 (TON)
TABLE 09.GLOBAL NEPHELINE MARKET, BY APPLICATION, 2019-2027 ($MILLION)
TABLE 10.GLOBAL NEPHELINE MARKET, BY APPLICATION, 2019-2027 (TON)
TABLE 11.NEPHELINE MARKET FOR CERAMIC PRODUCTS, BY REGION, 2019–2027 ($MILLION)
TABLE 12.NEPHELINE MARKET FOR CERAMIC PRODUCTS, BY REGION, 2019–2027 (TON)
TABLE 13.NEPHELINE MARKET FOR GLASS PRODUCTS, BY REGION, 2019–2027 ($MILLION)
TABLE 14.NEPHELINE MARKET FOR GLASS PRODUCTS, BY REGION, 2019–2027 (TON)
TABLE 15.NEPHELINE MARKET FOR REFRACTORIES, BY REGION, 2019–2027 ($MILLION)
TABLE 16.NEPHELINE MARKET FOR REFRACTORIES, BY REGION, 2019–2027 (TON)
TABLE 17.NEPHELINE MARKET FOR OTHERS, BY REGION, 2019–2027 ($MILLION)
TABLE 18.NEPHELINE MARKET FOR OTHERS, BY REGION, 2019–2027 (TON)
TABLE 19.NEPHELINE MARKET, BY REGION, 2019–2027 ($MILLION)
TABLE 20.NEPHELINE MARKET, BY REGION, 2019–2027 (TON)
TABLE 21.NORTH AMERICA NEPHELINE MARKET, BY PRODUCT TYPE, 2019–2027 ($MILLION)
TABLE 22.NORTH AMERICA NEPHELINE MARKET, BY PRODUCT TYPE, 2019–2027 (TON)
TABLE 23.NORTH AMERICA NEPHELINE MARKET, BY APPLICATION, 2019–2027 ($MILLION)
TABLE 24.NORTH AMERICA NEPHELINE MARKET, BY APPLICATION, 2019–2027 (TON)
TABLE 25.NORTH AMERICA NEPHELINE MARKET, BY COUNTRY, 2019–2027 ($MILLION)
TABLE 26.NORTH AMERICA NEPHELINE MARKET, BY COUNTRY, 2019–2027 (TON)
TABLE 27.U.S. NEPHELINE MARKET, BY PRODUCT TYPE, 2019–2027 ($MILLION)
TABLE 28.U.S. NEPHELINE MARKET, BY PRODUCT TYPE, 2019–2027 (TON)
TABLE 29.U.S. NEPHELINE MARKET, BY APPLICATION, 2019–2027 ($MILLION)
TABLE 30.U.S. NEPHELINE MARKET, BY APPLICATION, 2019–2027 (TON)
TABLE 31.CANADA NEPHELINE MARKET, BY PRODUCT TYPE, 2019–2027 ($MILLION)
TABLE 32.CANADA NEPHELINE MARKET, BY PRODUCT TYPE, 2019–2027 (TON)
TABLE 33.CANADA NEPHELINE MARKET, BY APPLICATION, 2019–2027 ($MILLION)
TABLE 34.CANADA NEPHELINE MARKET, BY APPLICATION, 2019–2027 (TON)
TABLE 35.MEXICO NEPHELINE MARKET, BY PRODUCT TYPE, 2019–2027 ($MILLION)
TABLE 36.MEXICO NEPHELINE MARKET, BY PRODUCT TYPE, 2019–2027 (TON)
TABLE 37.MEXICO NEPHELINE MARKET, BY APPLICATION, 2019–2027 ($MILLION)
TABLE 38.MEXICO NEPHELINE MARKET, BY APPLICATION, 2019–2027 (TON)
TABLE 39.EUROPE NEPHELINE MARKET, BY PRODUCT TYPE, 2019–2027 ($MILLION)
TABLE 40.EUROPE NEPHELINE MARKET, BY PRODUCT TYPE, 2019–2027 (TON)
TABLE 41.EUROPE NEPHELINE MARKET, BY APPLICATION, 2019–2027 ($MILLION)
TABLE 42.EUROPE NEPHELINE MARKET, BY APPLICATION, 2019–2027 (TON)
TABLE 43.EUROPE NEPHELINE MARKET, BY COUNTRY, 2019–2027 ($MILLION)
TABLE 44.EUROPE NEPHELINE MARKET, BY COUNTRY, 2019–2027 (TON)
TABLE 45.GERMANY NEPHELINE MARKET, BY PRODUCT TYPE, 2019–2027 ($MILLION)
TABLE 46.GERMANY NEPHELINE MARKET, BY PRODUCT TYPE, 2019–2027 (TON)
TABLE 47.GERMANY NEPHELINE MARKET, BY APPLICATION, 2019–2027 ($MILLION)
TABLE 48.GERMANY NEPHELINE MARKET, BY APPLICATION, 2019–2027 (TON)
TABLE 49.UK NEPHELINE MARKET, BY PRODUCT TYPE, 2019–2027 ($MILLION)
TABLE 50.UK NEPHELINE MARKET, BY PRODUCT TYPE, 2019–2027 (TON)
TABLE 51.UK NEPHELINE MARKET, BY APPLICATION, 2019–2027 ($MILLION)
TABLE 52.UK NEPHELINE MARKET, BY APPLICATION, 2019–2027 (TON)
TABLE 53.FRANCE NEPHELINE MARKET, BY PRODUCT TYPE, 2019–2027 ($MILLION)
TABLE 54.FRANCE NEPHELINE MARKET, BY PRODUCT TYPE, 2019–2027 (TON)
TABLE 55.FRANCE NEPHELINE MARKET, BY APPLICATION, 2019–2027 ($MILLION)
TABLE 56.FRANCE NEPHELINE MARKET, BY APPLICATION, 2019–2027 (TON)
TABLE 57.ITALY NEPHELINE MARKET, BY PRODUCT TYPE, 2019–2027 ($MILLION)
TABLE 58.ITALY NEPHELINE MARKET, BY PRODUCT TYPE, 2019–2027 (TON)
TABLE 59.ITALY NEPHELINE MARKET, BY APPLICATION, 2019–2027 ($MILLION)
TABLE 60.ITALY NEPHELINE MARKET, BY APPLICATION, 2019–2027 (TON)
TABLE 61.REST OF EUROPE NEPHELINE MARKET, BY PRODUCT TYPE, 2019–2027 ($MILLION)
TABLE 62.REST OF EUROPE NEPHELINE MARKET, BY PRODUCT TYPE, 2019–2027 (TON)
TABLE 63.REST OF EUROPE NEPHELINE MARKET, BY APPLICATION, 2019–2027 ($MILLION)
TABLE 64.REST OF EUROPE NEPHELINE MARKET, BY APPLICATION, 2019–2027 (TON)
TABLE 65.ASIA-PACIFIC NEPHELINE MARKET, BY PRODUCT TYPE, 2019–2027 ($MILLION)
TABLE 66.ASIA-PACIFIC NEPHELINE MARKET, BY PRODUCT TYPE, 2019–2027 (TON)
TABLE 67.ASIA-PACIFIC NEPHELINE MARKET, BY APPLICATION, 2019–2027 ($MILLION)
TABLE 68.ASIA-PACIFIC NEPHELINE MARKET, BY APPLICATION, 2019–2027 (TON)
TABLE 69.ASIA-PACIFIC NEPHELINE MARKET, BY COUNTRY, 2019–2027 ($MILLION)
TABLE 70.ASIA-PACIFIC NEPHELINE MARKET, BY COUNTRY, 2019–2027 (TON)
TABLE 71.CHINA NEPHELINE MARKET, BY PRODUCT TYPE, 2019–2027 ($MILLION)
TABLE 72.CHINA NEPHELINE MARKET, BY PRODUCT TYPE, 2019–2027 (TON)
TABLE 73.CHINA NEPHELINE MARKET, BY APPLICATION, 2019–2027 ($MILLION)
TABLE 74.CHINA NEPHELINE MARKET, BY APPLICATION, 2019–2027 (TON)
TABLE 75.JAPAN NEPHELINE MARKET, BY PRODUCT TYPE, 2019–2027 ($MILLION)
TABLE 76.JAPAN NEPHELINE MARKET, BY PRODUCT TYPE, 2019–2027 (TON)
TABLE 77.JAPAN NEPHELINE MARKET, BY APPLICATION, 2019–2027 ($MILLION)
TABLE 78.JAPAN NEPHELINE MARKET, BY APPLICATION, 2019–2027 (TON)
TABLE 79.INDIA NEPHELINE MARKET, BY PRODUCT TYPE, 2019–2027 ($MILLION)
TABLE 80.INDIA NEPHELINE MARKET, BY PRODUCT TYPE, 2019–2027 (TON)
TABLE 81.INDIA NEPHELINE MARKET, BY APPLICATION, 2019–2027 ($MILLION)
TABLE 82.INDIA NEPHELINE MARKET, BY APPLICATION, 2019–2027 (TON)
TABLE 83.AUSTRALIA NEPHELINE MARKET, BY PRODUCT TYPE, 2019–2027 ($MILLION)
TABLE 84.AUSTRALIA NEPHELINE MARKET, BY PRODUCT TYPE, 2019–2027 (TON)
TABLE 85.AUSTRALIA NEPHELINE MARKET, BY APPLICATION, 2019–2027 ($MILLION)
TABLE 86.AUSTRALIA NEPHELINE MARKET, BY APPLICATION, 2019–2027 (TON)
TABLE 87.REST OF ASIA-PACIFIC NEPHELINE MARKET, BY PRODUCT TYPE, 2019–2027 ($MILLION)
TABLE 88.REST OF ASIA-PACIFIC NEPHELINE MARKET, BY PRODUCT TYPE, 2019–2027 (TON)
TABLE 89.REST OF ASIA-PACIFIC NEPHELINE MARKET, BY APPLICATION, 2019–2027 ($MILLION)
TABLE 90.REST OF ASIA-PACIFIC NEPHELINE MARKET, BY APPLICATION, 2019–2027 (TON)
TABLE 91.LAMEA NEPHELINE MARKET, BY PRODUCT TYPE, 2019–2027 ($MILLION)
TABLE 92.LAMEA NEPHELINE MARKET, BY PRODUCT TYPE, 2019–2027 (TON)
TABLE 93.LAMEA NEPHELINE MARKET, BY APPLICATION, 2019–2027 ($MILLION)
TABLE 94.LAMEA NEPHELINE MARKET, BY APPLICATION, 2019–2027 (TON)
TABLE 95.LAMEA NEPHELINE MARKET, BY COUNTRY, 2019–2027 ($MILLION)
TABLE 96.LAMEA NEPHELINE MARKET, BY COUNTRY, 2019–2027 (TON)
TABLE 97.BRAZIL NEPHELINE MARKET, BY PRODUCT TYPE, 2019–2027 ($MILLION)
TABLE 98.BRAZIL NEPHELINE MARKET, BY PRODUCT TYPE, 2019–2027 (TON)
TABLE 99.BRAZIL NEPHELINE MARKET, BY APPLICATION, 2019–2027 ($MILLION)
TABLE 100.BRAZIL NEPHELINE MARKET, BY APPLICATION, 2019–2027 (TON)
TABLE 101.SAUDI ARABIA NEPHELINE MARKET, BY PRODUCT TYPE, 2019–2027 ($MILLION)
TABLE 102.SAUDI ARABIA NEPHELINE MARKET, BY PRODUCT TYPE, 2019–2027 (TON)
TABLE 103.SAUDI ARABIA NEPHELINE MARKET, BY APPLICATION, 2019–2027 ($MILLION)
TABLE 104.SAUDI ARABIA NEPHELINE MARKET, BY APPLICATION, 2019–2027 (TON)
TABLE 105.UAE NEPHELINE MARKET, BY PRODUCT TYPE, 2019–2027 ($MILLION)
TABLE 106.UAE NEPHELINE MARKET, BY PRODUCT TYPE, 2019–2027 (TON)
TABLE 107.UAE NEPHELINE MARKET, BY APPLICATION, 2019–2027 ($MILLION)
TABLE 108.UAE NEPHELINE MARKET, BY APPLICATION, 2019–2027 (TON)
TABLE 109.SOUTH AFRICA NEPHELINE MARKET, BY PRODUCT TYPE, 2019–2027 ($MILLION)
TABLE 110.SOUTH AFRICA NEPHELINE MARKET, BY PRODUCT TYPE, 2019–2027 (TON)
TABLE 111.SOUTH AFRICA NEPHELINE MARKET, BY APPLICATION, 2019–2027 ($MILLION)
TABLE 112.SOUTH AFRICA NEPHELINE MARKET, BY APPLICATION, 2019–2027 (TON)
TABLE 113.REST OF LAMEA NEPHELINE MARKET, BY PRODUCT TYPE, 2019–2027 ($MILLION)
TABLE 114.REST OF LAMEA NEPHELINE MARKET, BY PRODUCT TYPE, 2019–2027 (TON)
TABLE 115.REST OF LAMEA NEPHELINE MARKET, BY APPLICATION, 2019–2027 ($MILLION)
TABLE 116.REST OF LAMEA NEPHELINE MARKET, BY APPLICATION, 2019–2027 (TON)
TABLE 117.KEY EXPANSIONS (2017-2021)
TABLE 118.AGSCO CORPORATION: COMPANY SNAPSHOT
TABLE 119.AGSCO CORPORATION: OPERATING SEGMENTS
TABLE 120.AGSCO CORPORATION: PRODUCT PORTFOLIO
TABLE 121.ANGLO PACIFIC MINERALS LTD.: COMPANY SNAPSHOT
TABLE 122.ANGLO PACIFIC MINERALS LTD.: OPERATING SEGMENTS
TABLE 123.ANGLO PACIFIC MINERALS LTD.: PRODUCT PORTFOLIO
TABLE 124.OVERALL FINANCIAL STATUS ($MILLION)
TABLE 125.ANYANG JIULONG MINERAL INDUSTRY CO., LTD.:COMPANY SNAPSHOT
TABLE 126.ANYANG JIULONG MINERAL INDUSTRY CO., LTD OPERATING SEGMENTS
TABLE 127.ANYANG JIULONG MINERAL INDUSTRY CO., LTD: PRODUCT PORTFOLIO
TABLE 128.FINETON INDUSTRIAL MINERALS LIMITED: COMPANY SNAPSHOT
TABLE 129.FINETON INDUSTRIAL MINERALS LIMITED: OPERATING SEGMENTS
TABLE 130.FINETON INDUSTRIAL MINERALS LIMITED: PRODUCT PORTFOLIO
TABLE 131.NORTH CAPE MINERALS (SIBELCO NORDIC): COMPANY SNAPSHOT
TABLE 132.NORTH CAPE MINERALS (SIBELCO NORDIC): OPERATING SEGMENT
TABLE 133.NORTH CAPE MINERALS (SIBELCO NORDIC): PRODUCT PORTFOLIO
TABLE 134.PHOS AGRO GROUP OF COMPANIES: COMPANY SNAPSHOT
TABLE 135.PHOS AGRO GROUP OF COMPANIES: OPERATING SEGMENTS
TABLE 136.PHOS AGRO GROUP OF COMPANIES: PRODUCT PORTFOLIO
TABLE 137.OVERALL FINANCIAL STATUS ($MILLION)
TABLE 138.PHOS AGRO GROUP OF COMPANIES: KEY STRATEGIC MOVE AND DEVELOPMENT
TABLE 139.RUSAL PLC: COMPANY SNAPSHOT
TABLE 140.RUSAL PLC: OPERATING SEGMENTS
TABLE 141.RUSAL PLC: PRODUCT PORTFOLIO
TABLE 142.OVERALL FINANCIAL STATUS ($MILLION)
TABLE 143.RUSAL PLC: KEY STRATEGIC MOVE AND DEVELOPMENT
TABLE 144.SCR SIBELCO: COMPANY SNAPSHOT
TABLE 145.SCR SIBELCO: OPERATING SEGMENTS
TABLE 146.SCR SIBELCO: PRODUCT PORTFOLIO
TABLE 147.OVERALL FINANCIAL STATUS ($MILLION)
TABLE 148.THE 3M COMPANY: COMPANY SNAPSHOT
TABLE 149.THE 3M COMPANY: OPERATING SEGMENTS
TABLE 150.THE 3M COMPANY: PRODUCT PORTFOLIO
TABLE 151.OVERALL FINANCIAL STATUS ($MILLION)
TABLE 152.UNIMIN CORPORATION (COVIA): COMPANY SNAPSHOT
TABLE 153.UNIMIN CORPORATION (COVIA): OPERATING SEGMENTS
TABLE 154.UNIMIN CORPORATION (COVIA): PRODUCT PORTFOLIO
TABLE 155.OVERALL FINANCIAL STATUS ($MILLION)
TABLE 156.UNIMIN CORPORATION (COVIA): KEY STRATEGIC MOVE AND DEVELOPMENT

LIST OF FIGURES

FIGURE 01.GLOBAL NEPHELINE MARKET SNAPSHOT
FIGURE 02.GLOBAL NEPHELINE MARKET SEGMENTATION
FIGURE 03.TOP INVESTMENT POCKETS
FIGURE 04.HIGH BARGAINING POWER OF SUPPLIERS
FIGURE 05.MODERATE BARGAINING POWER OF BUYERS
FIGURE 06.MODERATE THREAT OF NEW ENTRANTS
FIGURE 07.MODERATE THREAT OF SUBSTITUTES
FIGURE 08.HIGH INTENSITY OF COMPETITIVE RIVALRY
FIGURE 09.GLOBAL NEPHELINE MARKET DYNAMICS
FIGURE 10.VALUE CHAIN ANALYSIS
FIGURE 11.PATENT ANALYSIS, BY COUNTRY, 2020
FIGURE 12.PATENT ANALYSIS, BY APPLICANT, 2012-2020
FIGURE 13.PATENT ANALYSIS, BY PUBLICATION DATE, 2012-2020
FIGURE 14.GLOBAL NEPHELINE MARKET, BY PRODUCT TYPE, 2019–2027 ($MILILION)
FIGURE 15.COMPARATIVE SHARE ANALYSIS OF NEPHELINE MARKET FOR NEPHELINE SYENITE, BY COUNTRY, 2019 & 2029 (%)
FIGURE 16.COMPARATIVE SHARE ANALYSIS OF NEPHELINE MARKET FOR NEPHELINE MONZONITE, BY COUNTRY, 2019 & 2027 (%)
FIGURE 17.COMPARATIVE SHARE ANALYSIS OF NEPHELINE MARKET FOR NEPHELINITES, BY COUNTRY, 2019 & 2027 (%)
FIGURE 18.GLOBAL NEPHELINE MARKET, BY APPLICATION, 2019–2027 ($MILILION)
FIGURE 19.COMPARATIVE SHARE ANALYSIS OF NEPHELINE MARKET FOR CERAMIC PRODUCTS, BY COUNTRY, 2019& 2027 (%)
FIGURE 20.COMPARATIVE SHARE ANALYSIS OF NEPHELINE MARKET FOR GLASS PRODUCTS, BY COUNTRY, 2019 & 2027 (%)
FIGURE 21.COMPARATIVE SHARE ANALYSIS OF NEPHELINE MARKET FOR REFRACTORIES, BY COUNTRY, 2019& 2027 (%)
FIGURE 22.COMPARATIVE SHARE ANALYSIS OF NEPHELINE MARKET FOR OTHERS, BY COUNTRY, 2019& 2027 (%)
FIGURE 23.U.S. NEPHELINE MARKET REVENUE, 2019–2027($MILLION)
FIGURE 24.CANADA NEPHELINE MARKET REVENUE, 2019–2027($MILLION)
FIGURE 25.MEXICO NEPHELINE MARKET REVENUE, 2019–2027($MILLION)
FIGURE 26.GERMANY NEPHELINE MARKET REVENUE, 2019–2027($MILLION)
FIGURE 27.UK NEPHELINE MARKET REVENUE, 2019–2027($MILLION)
FIGURE 28.FRANCE NEPHELINE MARKET REVENUE, 2019–2027($MILLION)
FIGURE 29.ITALY NEPHELINE MARKET REVENUE, 2019–2027($MILLION)
FIGURE 30.REST OF EUROPE NEPHELINE MARKET REVENUE, 2019–2027($MILLION)
FIGURE 31.CHINA NEPHELINE MARKET REVENUE, 2019–2027($MILLION)
FIGURE 32.JAPAN NEPHELINE MARKET REVENUE, 2019–2027($MILLION)
FIGURE 33.INDIA NEPHELINE MARKET REVENUE, 2019–2027($MILLION)
FIGURE 34.AUSTRALIA NEPHELINE MARKET REVENUE, 2019–2027($MILLION)
FIGURE 35.REST OF ASIA-PACIFIC NEPHELINE MARKET REVENUE, 2019–2027($MILLION)
FIGURE 36.BRAZIL NEPHELINE MARKET REVENUE, 2019–2027($MILLION)
FIGURE 37.SAUDI ARABIA NEPHELINE MARKET REVENUE, 2019–2027 ($MILLION)
FIGURE 38.UAE NEPHELINE MARKET REVENUE, 2019–2027($MILLION)
FIGURE 39.SOUTH AFRICA NEPHELINE MARKET REVENUE, 2019–2027($MILLION)
FIGURE 40.REST OF LAMEA MARKET REVENUE, 2019–2027($MILLION)
FIGURE 41.MARKET PLAYER POSITIONING, 2020
FIGURE 42.TOP WINNING STRATEGIES, BY YEAR, 2017–2021
FIGURE 43.TOP WINNING STRATEGIES, BY DEVELOPMENT, 2017–2021 (%)
FIGURE 44.TOP WINNING STRATEGIES, BY COMPANY, 2017–2021
FIGURE 45.PRODUCT MAPPING OF TOP 10 PLAYERS
FIGURE 46.COMPETITIVE DASHBOARD
FIGURE 47.COMPETITIVE HEATMAP OF KEY PLAYERS
FIGURE 48.ANGLO PACIFIC MINERALS LTD.: NET SALES, 2017–2019 ($MILLION)
FIGURE 49.ANGLO PACIFIC MINERALS LTD.: REVENUE SHARE BY SEGMENT, 2019 (%)
FIGURE 50.ANGLO PACIFIC MINERALS LTD.: REVENUE SHARE BY REGION, 2019 (%)
FIGURE 51.PHOS AGRO GROUP OF COMPANIES: REVENUE, 2018–2020 ($MILLION)
FIGURE 52.PHOS AGRO GROUP OF COMPANIES: REVENUE SHARE BY SEGMENT, 2020 (%)
FIGURE 53.PHOS AGRO GROUP OF COMPANIES: REVENUE SHARE BY REGION, 2020 (%)
FIGURE 54.RUSAL PLC: REVENUE, 2018–2020 ($MILLION)
FIGURE 55.RUSAL PLC: REVENUE SHARE BY SEGMENT, 2020 (%)
FIGURE 56.RUSAL PLC: REVENUE SHARE BY REGION, 2020 (%)
FIGURE 57.SCR SIBELCO: REVENUE, 2018–2020 ($MILLION)
FIGURE 58.SCR SIBELCO: REVENUE SHARE BY SEGMENT, 2020 (%)
FIGURE 59.SCR SIBELCO: REVENUE SHARE BY REGION, 2020 (%)
FIGURE 60.THE 3M COMPANY: REVENUE, 2018–2020 ($MILLION)
FIGURE 61.THE 3M COMPANY: REVENUE SHARE BY SEGMENT, 2020 (%)
FIGURE 62.THE 3M COMPANY: REVENUE SHARE BY REGION, 2020 (%)
FIGURE 63.UNIMIN CORPORATION (COVIA): REVENUE, 2017–2019 ($MILLION)
FIGURE 64.UNIMIN CORPORATION (COVIA): REVENUE SHARE BY SEGMENT, 2019 (%)
FIGURE 65.UNIMIN CORPORATION (COVIA): REVENUE SHARE BY REGION, 2019 (%)


The global nepheline market is expected to exhibit high growth potential due to its extensive use in ceramic products attributable to its properties such as UV resistance, high melting pressure, thermal & chemical stability, and nontoxicity. For instance, nepheline syenite that is extracted in parts of Sweden is rich in zirconium and rare earth elements (REE) such as eudialyte-group minerals (EGM). Glazed ceramic products are gaining importance owing to their distinctive color options, decorative appearance, and waterproof properties. Use of nepheline syenite for glazing of ceramic products is predicted to offer lucrative growth opportunities in the future. Moreover, nepheline syenite is an important raw material used during the production of ceramic bodies, owing to its use as a melting agent. Thus, all these factors are predicted to augment the growth of the global nepheline market.

However, impurities such as s iron, titanium, mica, and calcite minerals present in the nepheline syenite leads to quality problem in floor tile. Product development such as use of magnetic separation and flotation method during sintering process has enhanced the sintering properties and helps to improve quality of floor tile. This factor is not only gaining immense attention in the market but is also emerging as a key strategy in terms of gaining additional market demand.

PURCHASE OPTIONS

Call or Email us

U.S.-Canada Toll-free: +1-800-792-5285
Int'l : +1-503-894-6022
Europe : +44-845-528-1300
Email : help@alliedmarketresearch.com
 
FREQUENTLY ASKED QUESTIONS?

A. Nepheline syenite is widely used in paints & coatings, adhesives, plastics, and inks, owing to its ability to enhance performance. Brightness, tint retention, and weatherability are utmost important parameters in exterior paints that can be achieved by using nepheline syenite, are the other major growth factors in the nepheline market

A. The nepheline market size is projected to reach $195.03 million by 2027.

A. AGSCO Corporation, Unimin Corp. (COVIA), Phos Agro Group of Companies, Anglo Pacific Minerals Ltd., Anyang Country Mining Co Ltd., SCR Sibelco, RUSAL PLC, The 3M Company, Fineton Industrial Minerals Ltd., and North Cape Minerals AS are the most established players in global nepheline market

A. glass industry is projected to increase the demand of nepheline market

A. The global nepheline market is segmented into product type, application, and region. On the basis of product type, the market is categorized into nepheline syenite, nepheline monzonite, and nephelinites. The applications covered in the study include ceramic products, glass products, refractories, and others. Region wise, the global market is studied across North America, Europe, Asia-Pacific, and LAMEA.

A. rise in use of nepheline syenite in industrial process such as ceramic tile, refractories, filler, and extraction of rare earth elements (REE). It is the major growth factor in the nepheline market.

A. Glass and refractories applications are expected to drive the adoption of nepheline.

A. COVID-19 has impacted negatively on the nepheline market. This is attributed due to • The COVID-19 pandemic has negatively affected the global economy and is subsequent shrinking the GDP in global economies, thereby changing consumer spending patterns globally. • Several challenges have been faced by the glass industry due to the outbreak of the pandemic such as temporary closure of manufacturing sites and travel restrictions, which, in turn, has created logistical supply issue and delay is shipment. • Major ceramic and tile manufacturers across the world are facing problems despite of no construction ban. This is attributed to disruption in value chain and closure of other industries that are directly or indirectly linked with the ceramic sector. • The real estate sector is directly dependent on the growth of the ceramic tile sector. Owing to unavailability of raw materials, slowdown in the construction sector, and restrictions laid by government to prevent the spread of virus, the demand for ceramic tile has declined considerably. Thus, consumption and production of nepheline have been hampered during the COVID-19 pandemic. • In addition, other industries such as refractories and glass are hit due to the global health crisis, which, in turn, has negatively affected the global nepheline market.

Looking for Customization?

 Customization Request

Have a Question?

 Speak with Analyst

Any Confusion?

 Inquire Before Buying

Have a glance of the Report

  Request Sample
RELATED TAGS

Purchase Full Report of
Nepheline Market

Start reading instantly.
This Report and over 67,541+ more Reports, Available with Avenue Library. T&C*.

  • Online Only
  • $3,456
  • Online cloud access only
  • Restricted print, copy, paste & download
  • Read only
  • Free industry update
    (Within 180 days)
  • Free report update in next update cycle
    (May 2022 - May 2023)
  • Data Pack
  • $3,840
  • Restricted to one authorized user
  • One print only
  • Available in
    Excel
  • Free industry update
    (Within 180 days)
  •   Free report update in next update cycle
    (May 2022 - May 2023)
  • Single User
  • $5,769
  • Restricted to one authorized user
  • One print only
  • Available in
    PDF
  • Free industry update
    (Within 180 days)
  •   Free report update in next update cycle
    (May 2022 - May 2023)
  • Five Users
  • $6,450
  • Limited to five authorized users
  • Print upto five copies
  • Available in
    PDF
  • Free industry update
    (Within 180 days)
  •   Free report update in next update cycle
    (May 2022 - May 2023)
  • Enterprise
    License/PDF

  • $10,995
  • Unlimited
    within
    company/enterprise
  • Available in Excel & PDF
  • Free industry update
    (Within 180 days)
  •   Free report update in next update cycle
    (May 2022 - May 2023)
  • Library
    Membership

  • $999 $ 1,175
    Per User/ Per month/ Billed annually
  • Published Content
    E-access
  • Company Profiles
    E-access
  • Newly Added Content Access
  • 10 PDF
    Downloads
  • 5 Excel Data
    Pack Downloads
  • 250 Company Profiles PDF Downloads
  • Buy Now

*Taxes/Fees, if applicable will be added during checkout. All prices in USD

RELATED REPORTS
 

Why Allied Market Research?


Infallible Methodology

To ensure high-level data integrity, accurate analysis, and impeccable forecasts

Analyst Support

For complete satisfaction

Customization

On-demand customization of scope of the report to exactly meet your needs

TARGETED MARKET VIEW

Targeted market view to provide pertinent information and save time of readers

Get fresh content delivered

Get insights on topics that are crucial for your business. Stay abreast of your interest areas.

Get Industry Data Alerts

Why Allied Market Research?

Infallible Methodology

To ensure high-level data integrity, accurate analysis, and impeccable forecasts

Analyst Support

For complete satisfaction

Customization

On-demand customization of scope of the report to exactly meet your needs

TARGETED MARKET VIEW

Targeted market view to provide pertinent information and save time of readers