Report Code: A01995 | Feb 2022 | Pages: 253 | ||
Tables: 112 | Charts: 58 |
|
Pandemic disrupted the entire world and affected many industries.
Get detailed COVID-19 impact analysis on the Neural Network Market
Request Now !
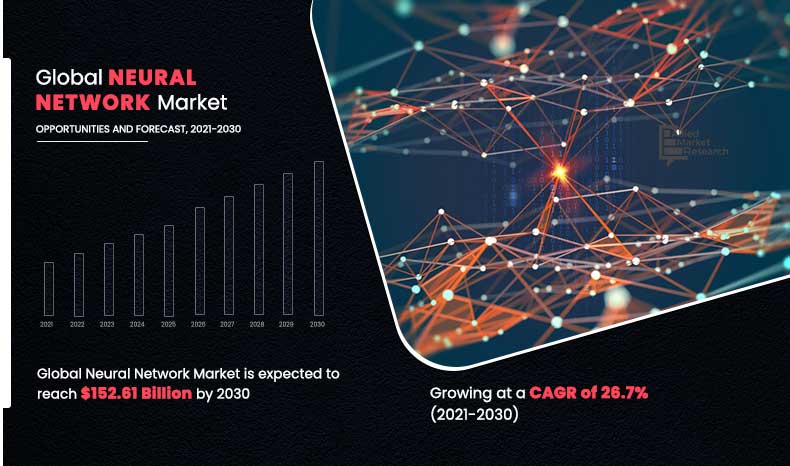
The global neural network market was valued at $14.35 billion in 2020, and is projected to reach $152.61 billion by 2030, registering a CAGR of 26.7% from 2021 to 2030. Neural network is defined as the system of hardware and software comprising simple and highly interconnected processing elements (neurons). Moreover, it is known as artificial neural network (ANN). It is a form of artificial intelligence involving a series of algorithms, and is used to understand the relationship between datasets to obtain a desired output. This network implements a process, which is designed to incorporate the functionalities of human brain through a variety of deep learning technologies to solve complex pattern recognition or signal processing problems. Applications of neural network includes weather prediction, handwriting recognition, oil-exploration data analysis, facial recognition, and speech-to-text transcription.
The adoption of neural network has increased with start of COVID-19 pandemic owing to surge in IT expenditure by the developing nations during the pandemic period and growing application of deep learning in various industries across the globe
Advancement in the field of artificial intelligence (AI) market and growth in cloud disruption in the modern industry boost the growth of the global neural network market. In addition, availability of advanced analytical tools and prediction solutions positively impacts the growth of the market. However, huge requirement & high dependency on data, lack of experienced professionals, and difficulties in training multilayer neural network hamper the market growth. On the contrary, surge in application areas for deep neural networks is expected to offer remunerative opportunities for expansion of the market during the forecast period.
According to component, the software segment holds the largest neural network market share, owing to increase in popularity of its key features such as accuracy and self-learning capacity across various industries. However, the services segment is expected to grow at the highest rate during the forecast period, owing to rise in adoption of various services such as, outsourced product development (OPD), call recording, email management, enterprise resource planning, chat platforms, project setup & forecast review, custom software development, and remote training.
Region wise, the neural network market share was dominated by North America in 2020, and is expected to retain its position during the forecast period, due to the early adoption of neural network and technological advancement in this region. However, Asia-Pacific is expected to witness significant growth during the forecast period, owing to rise in digitization and increase in data generated by internet of things (IoT) devices.
The neural network market is segmented on the basis of component, industry vertical, and region. Depending on component, it is bifurcated into software and services. According to industry vertical, it is classified into BFSI, IT & telecom, aerospace & defense, public sector, retail, healthcare, manufacturing, energy & utilities, and others. Region wise, the market is analyzed across North America, Europe, Asia-Pacific, and LAMEA.
The key players that operate in the neural network market are Afiniti, Alyuda Research, LLC, GMDH Inc., Neural Technologies Limited, NeuralWare, nDimensional, OLSOFT LLC, Starmind, SWIFTKEY (Microsoft Corporation), and Ward Systems Group, Inc.
The neural network industry has grown significantly in recent years; but, due to the outbreak of the COVID-19 pandemic, the market experienced a sharp decline in 2020. This is due to the governments implementing lockdown in the majority of countries and halt in travel across the globe to limit the spread of the virus. Neural network industry is expected to grow post-pandemic. Various firms across the globe have implemented a work-from-home culture for their staff, resulting in demand for cloud-based solutions, rise in demand for spatial data & analytical tools, and surge in market prediction solutions. Increase in volume of data generated by different industries and the need to manage this data are the key factors that drive the growth of the neural network market size.
In addition, healthcare organizations utilized ANN to anticipate recovery and death cases by using a majority of clinical characteristics, despite the fact that gathering such extensive information necessary for prediction purposes might be difficult. It was found to be satisfactory efficient based on the rich and specific input data required by their proposed model. Moreover, it will not give a prediction of probable confirmed cases in future. Therefore, the application of neural networks to detect the cases increased the demand for the market during the COVID-19 pandemic having a positive impact on the neural network market size.
Artificial intelligence (AI) system includes learning, reasoning, and self-correction powered by neural network. Particular applications of AI include expert systems, speech recognition, and machine vision. Presently, challenging project which includes big data infrastructure and cloud computing are responsible for increase of popularity of AI. Top companies in various sectors such as Software & IT (Google, Microsoft, and Amazon), Financial Services (Bloomberg and American Express), and Automotive (Tesla and Ford) have identified AI as core strategic driver and started investments in neural network to develop efficient systems, which will be more advanced. In addition, these top companies have also supported new start-ups, providing financial support to generate new innovative neural search platforms. For instance, in November 2021, Berlin-based Jina.ai, an open-source startup that uses neural search raised a $30 million series A funding round led by Canaan partners, which help its users find information in their unstructured data.
Cloud computing is one of the most powerful computing models. Cloud computing continues to be successful with the major IT providers and consumers compete to reap the benefits of this computing model and the capacity to utilize SaaS (Security as a Service), PaaS, and Iaas developments. New services including “Function as a Service” and “Backend as a Service” have been added to the mix in response to increase their profits. Furthermore, most of the cloud computing platforms are still built on operating systems that use basic Core Processing Unit (CPU) scheduling algorithms that lack the intelligence needed for such innovative computing model. The intelligence needed for cloud computing is provided by the use of ANN in cloud. Nowadays, use of cloud computing with ANN have increased among industries such as healthcare (for detection of cancer) and security (SaaS).
Neural Network Market Report Highlights
Aspects | Details |
---|---|
By Component |
|
By Industry Vertical |
|
By Region |
|
By Key Market Players |
|
CHAPTER 1:INTRODUCTION
1.1.Report Description
1.2.Key Market Segments
1.3.Key Benefits
1.4.Research Methodology
1.4.1. Primary Research
1.4.2. Secondary Research
1.4.3. Analyst Tools and Models
CHAPTER 2:EXECUTIVE SUMMARY
2.1.CXO Perspective
CHAPTER 3:MARKET LANDSCAPE
3.1.Market Definition and Scope
3.2.Key Findings
3.2.1. Top Investment Pockets
3.2.2. Top Winning Strategies
3.3.Porter's Five Forces Analysis
3.3.1. Bargaining Power of Suppliers
3.3.2. Threat of New Entrants
3.3.3. Threat of Substitutes
3.3.4. Competitive Rivalry
3.3.5. Bargaining Power among Buyers
3.4.Market Share Analysis/Top Player Positioning
3.4.1. Market Share Analysis/Top Player Positioning 2020
3.5.Market Dynamics
3.5.1. Drivers
3.5.2. Restraints
3.5.3. Opportunities
3.6. COVID-19 Impact Analysis
3.7. Competitive Heat map
CHAPTER 4:NEURAL NETWORK MARKET, BY COMPONENT
4.1.Market Overview
4.1.1Market Size and Forecast, By Component
4.2. Software
4.2.1. Key Market Trends, Growth Factors and Opportunities
4.2.2. Market Size and Forecast, By Region
4.2.3. Market Share Analysis, By Country
4.3. Service
4.3.1. Key Market Trends, Growth Factors and Opportunities
4.3.2. Market Size and Forecast, By Region
4.3.3. Market Share Analysis, By Country
CHAPTER 5:NEURAL NETWORK MARKET, BY INDUSTRY VERTICAL
5.1.Market Overview
5.1.1Market Size and Forecast, By Industry Vertical
5.2. BFSI
5.2.1. Key Market Trends, Growth Factors and Opportunities
5.2.2. Market Size and Forecast, By Region
5.2.3. Market Share Analysis, By Country
5.3. IT And Telecom
5.3.1. Key Market Trends, Growth Factors and Opportunities
5.3.2. Market Size and Forecast, By Region
5.3.3. Market Share Analysis, By Country
5.4. Aerospace and Defense
5.4.1. Key Market Trends, Growth Factors and Opportunities
5.4.2. Market Size and Forecast, By Region
5.4.3. Market Share Analysis, By Country
5.5. Public Sector
5.5.1. Key Market Trends, Growth Factors and Opportunities
5.5.2. Market Size and Forecast, By Region
5.5.3. Market Share Analysis, By Country
5.6. Retail
5.6.1. Key Market Trends, Growth Factors and Opportunities
5.6.2. Market Size and Forecast, By Region
5.6.3. Market Share Analysis, By Country
5.7. Healthcare
5.7.1. Key Market Trends, Growth Factors and Opportunities
5.7.2. Market Size and Forecast, By Region
5.7.3. Market Share Analysis, By Country
5.8. Manufacturing
5.8.1. Key Market Trends, Growth Factors and Opportunities
5.8.2. Market Size and Forecast, By Region
5.8.3. Market Share Analysis, By Country
5.9. Energy and Utilities
5.9.1. Key Market Trends, Growth Factors and Opportunities
5.9.2. Market Size and Forecast, By Region
5.9.3. Market Share Analysis, By Country
5.10. Others
5.10.1. Key Market Trends, Growth Factors and Opportunities
5.10.2. Market Size and Forecast, By Region
5.10.3. Market Share Analysis, By Country
CHAPTER 6:NEURAL NETWORK MARKET, BY REGION
6.1.Market Overview
6.1.1Market Size and Forecast, By Region
6.2.North America
6.2.1. Key Market Trends and Opportunities
6.2.2. Market Size and Forecast, By Component
6.2.3. Market Size and Forecast, By Industry Vertical
6.2.4. Market Size and Forecast, By Country
6.2.5. United States Neural Network Market
6.2.5.1. Market Size and Forecast, By Component
6.2.5.2. Market Size and Forecast, By Industry Vertical
6.2.6. Canada Neural Network Market
6.2.6.1. Market Size and Forecast, By Component
6.2.6.2. Market Size and Forecast, By Industry Vertical
6.3.Europe
6.3.1. Key Market Trends and Opportunities
6.3.2. Market Size and Forecast, By Component
6.3.3. Market Size and Forecast, By Industry Vertical
6.3.4. Market Size and Forecast, By Country
6.3.5. UK Neural Network Market
6.3.5.1. Market Size and Forecast, By Component
6.3.5.2. Market Size and Forecast, By Industry Vertical
6.3.6. Germany Neural Network Market
6.3.6.1. Market Size and Forecast, By Component
6.3.6.2. Market Size and Forecast, By Industry Vertical
6.3.7. France Neural Network Market
6.3.7.1. Market Size and Forecast, By Component
6.3.7.2. Market Size and Forecast, By Industry Vertical
6.3.8. Italy Neural Network Market
6.3.8.1. Market Size and Forecast, By Component
6.3.8.2. Market Size and Forecast, By Industry Vertical
6.3.9. Spain Neural Network Market
6.3.9.1. Market Size and Forecast, By Component
6.3.9.2. Market Size and Forecast, By Industry Vertical
6.3.10. Netherlands Neural Network Market
6.3.10.1. Market Size and Forecast, By Component
6.3.10.2. Market Size and Forecast, By Industry Vertical
6.3.11. Rest of Europe Neural Network Market
6.3.11.1. Market Size and Forecast, By Component
6.3.11.2. Market Size and Forecast, By Industry Vertical
6.4.Asia-Pacific
6.4.1. Key Market Trends and Opportunities
6.4.2. Market Size and Forecast, By Component
6.4.3. Market Size and Forecast, By Industry Vertical
6.4.4. Market Size and Forecast, By Country
6.4.5. China Neural Network Market
6.4.5.1. Market Size and Forecast, By Component
6.4.5.2. Market Size and Forecast, By Industry Vertical
6.4.6. Japan Neural Network Market
6.4.6.1. Market Size and Forecast, By Component
6.4.6.2. Market Size and Forecast, By Industry Vertical
6.4.7. India Neural Network Market
6.4.7.1. Market Size and Forecast, By Component
6.4.7.2. Market Size and Forecast, By Industry Vertical
6.4.8. South Korea Neural Network Market
6.4.8.1. Market Size and Forecast, By Component
6.4.8.2. Market Size and Forecast, By Industry Vertical
6.4.9. Australia Neural Network Market
6.4.9.1. Market Size and Forecast, By Component
6.4.9.2. Market Size and Forecast, By Industry Vertical
6.4.10. Rest of Asia Pacific Neural Network Market
6.4.10.1. Market Size and Forecast, By Component
6.4.10.2. Market Size and Forecast, By Industry Vertical
6.5.LAMEA
6.5.1. Key Market Trends and Opportunities
6.5.2. Market Size and Forecast, By Component
6.5.3. Market Size and Forecast, By Industry Vertical
6.5.4. Market Size and Forecast, By Country
6.5.5. Latin America Neural Network Market
6.5.5.1. Market Size and Forecast, By Component
6.5.5.2. Market Size and Forecast, By Industry Vertical
6.5.6. Middle East Neural Network Market
6.5.6.1. Market Size and Forecast, By Component
6.5.6.2. Market Size and Forecast, By Industry Vertical
6.5.7. Africa Neural Network Market
6.5.7.1. Market Size and Forecast, By Component
6.5.7.2. Market Size and Forecast, By Industry Vertical
CHAPTER 7:COMPANY PROFILES
7.1. Afiniti
7.1.1.Company Overview
7.1.2.Key Executives
7.1.3.Company snapshot
7.1.4.Operating business segments
7.1.5.Product portfolio
7.1.6.Business Performance
7.1.7.Key Strategic Moves and Developments
7.2. Alyuda Research, LLC
7.2.1.Company Overview
7.2.2.Key Executives
7.2.3.Company snapshot
7.2.4.Operating business segments
7.2.5.Product portfolio
7.2.6.Business Performance
7.2.7.Key Strategic Moves and Developments
7.3. GMDH Inc.
7.3.1.Company Overview
7.3.2.Key Executives
7.3.3.Company snapshot
7.3.4.Operating business segments
7.3.5.Product portfolio
7.3.6.Business Performance
7.3.7.Key Strategic Moves and Developments
7.4. Neural Technologies Limited
7.4.1.Company Overview
7.4.2.Key Executives
7.4.3.Company snapshot
7.4.4.Operating business segments
7.4.5.Product portfolio
7.4.6.Business Performance
7.4.7.Key Strategic Moves and Developments
7.5. NeuralWare
7.5.1.Company Overview
7.5.2.Key Executives
7.5.3.Company snapshot
7.5.4.Operating business segments
7.5.5.Product portfolio
7.5.6.Business Performance
7.5.7.Key Strategic Moves and Developments
7.6. NDimensional
7.6.1.Company Overview
7.6.2.Key Executives
7.6.3.Company snapshot
7.6.4.Operating business segments
7.6.5.Product portfolio
7.6.6.Business Performance
7.6.7.Key Strategic Moves and Developments
7.7. OLSOFT LLC
7.7.1.Company Overview
7.7.2.Key Executives
7.7.3.Company snapshot
7.7.4.Operating business segments
7.7.5.Product portfolio
7.7.6.Business Performance
7.7.7.Key Strategic Moves and Developments
7.8. Starmind
7.8.1.Company Overview
7.8.2.Key Executives
7.8.3.Company snapshot
7.8.4.Operating business segments
7.8.5.Product portfolio
7.8.6.Business Performance
7.8.7.Key Strategic Moves and Developments
7.9. SWIFTKEY (Microsoft Corporation)
7.9.1.Company Overview
7.9.2.Key Executives
7.9.3.Company snapshot
7.9.4.Operating business segments
7.9.5.Product portfolio
7.9.6.Business Performance
7.9.7.Key Strategic Moves and Developments
7.10. Ward Systems Group, Inc.
7.10.1.Company Overview
7.10.2.Key Executives
7.10.3.Company snapshot
7.10.4.Operating business segments
7.10.5.Product portfolio
7.10.6.Business Performance
7.10.7.Key Strategic Moves and Developments
Note: *Details on financial performance and strategic moves and developments may not be captured for
unlisted companies.
*List of companies profiled in this TOC is tentative and may change after detailed analysis.
*Market size and forecast will be provided from 2020-2030, and forecast period would be 2021-2030.
*The provided information and segments are for representation purpose only. The actual information
delivered would change significantly as per findings during the course of study and upon its
completion.
LIST OF TABLES
TABLE 1.GLOBAL NEURAL NETWORK MARKET, BY COMPONENT, 2020-2030 ($MILLION)
TABLE 2.GLOBAL NEURAL NETWORK MARKET FOR SOFTWARE, BY REGION, 2020-2030 ($MILLION)
TABLE 3.GLOBAL NEURAL NETWORK MARKET FOR SERVICE, BY REGION, 2020-2030 ($MILLION)
TABLE 4.GLOBAL NEURAL NETWORK MARKET, BY INDUSTRY VERTICAL, 2020-2030 ($MILLION)
TABLE 5.GLOBAL NEURAL NETWORK MARKET FOR BFSI, BY REGION, 2020-2030 ($MILLION)
TABLE 6.GLOBAL NEURAL NETWORK MARKET FOR IT AND TELECOM, BY REGION, 2020-2030 ($MILLION)
TABLE 7.GLOBAL NEURAL NETWORK MARKET FOR AEROPSACE AND DEFENCE, BY REGION, 2020-2030 ($MILLION)
TABLE 8.GLOBAL NEURAL NETWORK MARKET FOR PUBLIC SECTOR, BY REGION, 2020-2030 ($MILLION)
TABLE 9.GLOBAL NEURAL NETWORK MARKET FOR RETAIL, BY REGION, 2020-2030 ($MILLION)
TABLE 10.GLOBAL NEURAL NETWORK MARKET FOR HEALTHCARE, BY REGION, 2020-2030 ($MILLION)
TABLE 11.GLOBAL NEURAL NETWORK MARKET FOR MANUFACTURING, BY REGION, 2020-2030 ($MILLION)
TABLE 12.GLOBAL NEURAL NETWORK MARKET FOR ENERGY AND UTILITIES, BY REGION, 2020-2030 ($MILLION)
TABLE 13.GLOBAL NEURAL NETWORK MARKET FOR OTHERS, BY REGION, 2020-2030 ($MILLION)
TABLE 14.GLOBAL NEURAL NETWORK MARKET, BY REGION, 2020-2030 ($MILLION)
TABLE 15.NORTH AMERICA NEURAL NETWORK, BY Region, 2020-2030 ($MILLION)
TABLE 16.NORTH AMERICA NEURAL NETWORK, BY COMPONENT, 2020-2030 ($MILLION)
TABLE 17.NORTH AMERICA NEURAL NETWORK, BY INDUSTRY VERTICAL, 2020-2030 ($MILLION)
TABLE 18.UNITED STATES NEURAL NETWORK, BY COMPONENT, 2020-2030 ($MILLION)
TABLE 19.UNITED STATES NEURAL NETWORK, BY INDUSTRY VERTICAL, 2020-2030 ($MILLION)
TABLE 20.CANADA NEURAL NETWORK, BY COMPONENT, 2020-2030 ($MILLION)
TABLE 21.CANADA NEURAL NETWORK, BY INDUSTRY VERTICAL, 2020-2030 ($MILLION)
TABLE 22.EUROPE NEURAL NETWORK, BY Region, 2020-2030 ($MILLION)
TABLE 23.EUROPE NEURAL NETWORK, BY COMPONENT, 2020-2030 ($MILLION)
TABLE 24.EUROPE NEURAL NETWORK, BY INDUSTRY VERTICAL, 2020-2030 ($MILLION)
TABLE 25.UK NEURAL NETWORK, BY COMPONENT, 2020-2030 ($MILLION)
TABLE 26.UK NEURAL NETWORK, BY INDUSTRY VERTICAL, 2020-2030 ($MILLION)
TABLE 27.GERMANY NEURAL NETWORK, BY COMPONENT, 2020-2030 ($MILLION)
TABLE 28.GERMANY NEURAL NETWORK, BY INDUSTRY VERTICAL, 2020-2030 ($MILLION)
TABLE 29.FRANCE NEURAL NETWORK, BY COMPONENT, 2020-2030 ($MILLION)
TABLE 30.FRANCE NEURAL NETWORK, BY INDUSTRY VERTICAL, 2020-2030 ($MILLION)
TABLE 31.ITALY NEURAL NETWORK, BY COMPONENT, 2020-2030 ($MILLION)
TABLE 32.ITALY NEURAL NETWORK, BY INDUSTRY VERTICAL, 2020-2030 ($MILLION)
TABLE 33.SPAIN NEURAL NETWORK, BY COMPONENT, 2020-2030 ($MILLION)
TABLE 34.SPAIN NEURAL NETWORK, BY INDUSTRY VERTICAL, 2020-2030 ($MILLION)
TABLE 35.NETHERLANDS NEURAL NETWORK, BY COMPONENT, 2020-2030 ($MILLION)
TABLE 36.NETHERLANDS NEURAL NETWORK, BY INDUSTRY VERTICAL, 2020-2030 ($MILLION)
TABLE 37.REST OF EUROPE NEURAL NETWORK, BY COMPONENT, 2020-2030 ($MILLION)
TABLE 38.REST OF EUROPE NEURAL NETWORK, BY INDUSTRY VERTICAL, 2020-2030 ($MILLION)
TABLE 39.ASIA-PACIFIC NEURAL NETWORK, BY Region, 2020-2030 ($MILLION)
TABLE 40.ASIA-PACIFIC NEURAL NETWORK, BY COMPONENT, 2020-2030 ($MILLION)
TABLE 41.ASIA-PACIFIC NEURAL NETWORK, BY INDUSTRY VERTICAL, 2020-2030 ($MILLION)
TABLE 42.CHINA NEURAL NETWORK, BY COMPONENT, 2020-2030 ($MILLION)
TABLE 43.CHINA NEURAL NETWORK, BY INDUSTRY VERTICAL, 2020-2030 ($MILLION)
TABLE 44.JAPAN NEURAL NETWORK, BY COMPONENT, 2020-2030 ($MILLION)
TABLE 45.JAPAN NEURAL NETWORK, BY INDUSTRY VERTICAL, 2020-2030 ($MILLION)
TABLE 46.INDIA NEURAL NETWORK, BY COMPONENT, 2020-2030 ($MILLION)
TABLE 47.INDIA NEURAL NETWORK, BY INDUSTRY VERTICAL, 2020-2030 ($MILLION)
TABLE 48.SOUTH KOREA NEURAL NETWORK, BY COMPONENT, 2020-2030 ($MILLION)
TABLE 49.SOUTH KOREA NEURAL NETWORK, BY INDUSTRY VERTICAL, 2020-2030 ($MILLION)
TABLE 50.AUSTRALIA NEURAL NETWORK, BY COMPONENT, 2020-2030 ($MILLION)
TABLE 51.AUSTRALIA NEURAL NETWORK, BY INDUSTRY VERTICAL, 2020-2030 ($MILLION)
TABLE 52.REST OF ASIA PACIFIC NEURAL NETWORK, BY COMPONENT, 2020-2030 ($MILLION)
TABLE 53.REST OF ASIA PACIFIC NEURAL NETWORK, BY INDUSTRY VERTICAL, 2020-2030 ($MILLION)
TABLE 54.LAMEA NEURAL NETWORK, BY Region, 2020-2030 ($MILLION)
TABLE 55.LAMEA NEURAL NETWORK, BY COMPONENT, 2020-2030 ($MILLION)
TABLE 56.LAMEA NEURAL NETWORK, BY INDUSTRY VERTICAL, 2020-2030 ($MILLION)
TABLE 57.LATIN AMERICA NEURAL NETWORK, BY COMPONENT, 2020-2030 ($MILLION)
TABLE 58.LATIN AMERICA NEURAL NETWORK, BY INDUSTRY VERTICAL, 2020-2030 ($MILLION)
TABLE 59.MIDDLE EAST NEURAL NETWORK, BY COMPONENT, 2020-2030 ($MILLION)
TABLE 60.MIDDLE EAST NEURAL NETWORK, BY INDUSTRY VERTICAL, 2020-2030 ($MILLION)
TABLE 61.AFRICA NEURAL NETWORK, BY COMPONENT, 2020-2030 ($MILLION)
TABLE 62.AFRICA NEURAL NETWORK, BY INDUSTRY VERTICAL, 2020-2030 ($MILLION)
TABLE 63.AFINITI: KEY EXECUTIVES
TABLE 64.AFINITI: COMPANY SNAPSHOT
TABLE 65.AFINITI: OPERATING SEGMENTS
TABLE 66.AFINITI: PRODUCT PORTFOLIO
TABLE 67.AFINITI: KEY STRATEGIC MOVES AND DEVELOPMENTS
TABLE 68.ALYUDA RESEARCH, LLC: KEY EXECUTIVES
TABLE 69.ALYUDA RESEARCH, LLC: COMPANY SNAPSHOT
TABLE 70.ALYUDA RESEARCH, LLC: OPERATING SEGMENTS
TABLE 71.ALYUDA RESEARCH, LLC: PRODUCT PORTFOLIO
TABLE 72.ALYUDA RESEARCH, LLC: KEY STRATEGIC MOVES AND DEVELOPMENTS
TABLE 73.GMDH INC.: KEY EXECUTIVES
TABLE 74.GMDH INC.: COMPANY SNAPSHOT
TABLE 75.GMDH INC.: OPERATING SEGMENTS
TABLE 76.GMDH INC.: PRODUCT PORTFOLIO
TABLE 77.GMDH INC.: KEY STRATEGIC MOVES AND DEVELOPMENTS
TABLE 78.NEURAL TECHNOLOGIES LIMITED: KEY EXECUTIVES
TABLE 79.NEURAL TECHNOLOGIES LIMITED: COMPANY SNAPSHOT
TABLE 80.NEURAL TECHNOLOGIES LIMITED: OPERATING SEGMENTS
TABLE 81.NEURAL TECHNOLOGIES LIMITED: PRODUCT PORTFOLIO
TABLE 82.NEURAL TECHNOLOGIES LIMITED: KEY STRATEGIC MOVES AND DEVELOPMENTS
TABLE 83.NEURALWARE: KEY EXECUTIVES
TABLE 84.NEURALWARE: COMPANY SNAPSHOT
TABLE 85.NEURALWARE: OPERATING SEGMENTS
TABLE 86.NEURALWARE: PRODUCT PORTFOLIO
TABLE 87.NEURALWARE: KEY STRATEGIC MOVES AND DEVELOPMENTS
TABLE 88.NDIMENSIONAL: KEY EXECUTIVES
TABLE 89.NDIMENSIONAL: COMPANY SNAPSHOT
TABLE 90.NDIMENSIONAL: OPERATING SEGMENTS
TABLE 91.NDIMENSIONAL: PRODUCT PORTFOLIO
TABLE 92.NDIMENSIONAL: KEY STRATEGIC MOVES AND DEVELOPMENTS
TABLE 93.OLSOFT LLC: KEY EXECUTIVES
TABLE 94.OLSOFT LLC: COMPANY SNAPSHOT
TABLE 95.OLSOFT LLC: OPERATING SEGMENTS
TABLE 96.OLSOFT LLC: PRODUCT PORTFOLIO
TABLE 97.OLSOFT LLC: KEY STRATEGIC MOVES AND DEVELOPMENTS
TABLE 98.STARMIND: KEY EXECUTIVES
TABLE 99.STARMIND: COMPANY SNAPSHOT
TABLE 100.STARMIND: OPERATING SEGMENTS
TABLE 101.STARMIND: PRODUCT PORTFOLIO
TABLE 102.STARMIND: KEY STRATEGIC MOVES AND DEVELOPMENTS
TABLE 103.SWIFTKEY (MICROSOFT CORPORATION): KEY EXECUTIVES
TABLE 104.SWIFTKEY (MICROSOFT CORPORATION): COMPANY SNAPSHOT
TABLE 105.SWIFTKEY (MICROSOFT CORPORATION): OPERATING SEGMENTS
TABLE 106.SWIFTKEY (MICROSOFT CORPORATION): PRODUCT PORTFOLIO
TABLE 107.SWIFTKEY (MICROSOFT CORPORATION): KEY STRATEGIC MOVES AND DEVELOPMENTS
TABLE 108.WARD SYSTEMS GROUP, INC.: KEY EXECUTIVES
TABLE 109.WARD SYSTEMS GROUP, INC.: COMPANY SNAPSHOT
TABLE 110.WARD SYSTEMS GROUP, INC.: OPERATING SEGMENTS
TABLE 111.WARD SYSTEMS GROUP, INC.: PRODUCT PORTFOLIO
TABLE 112.WARD SYSTEMS GROUP, INC.: KEY STRATEGIC MOVES AND DEVELOPMENTS
LIST OF FIGURES
FIGURE 1.GLOBAL NEURAL NETWORK MARKET SEGMENTATION
FIGURE 2.GLOBAL NEURAL NETWORK MARKET
FIGURE 3.SEGMENTATION NEURAL NETWORK MARKET
FIGURE 4.TOP INVESTMENT POCKET IN NEURAL NETWORK MARKET
FIGURE 5.TOP WINNING STRATEGIES, 2019-2021*
FIGURE 6.TOP WINNING STRATEGIES, BY DEVELOPMENT, 2019-2021(%)
FIGURE 7.TOP WINNING STRATEGIES, BY COMPANY, 2019-2021*
FIGURE 8.MODERATE BARGAINING POWER OF BUYERS
FIGURE 9.MODERATE BARGAINING POWER OF SUPPLIERS
FIGURE 10.MODERATE THREAT OF NEW ENTRANTS
FIGURE 11.LOW THREAT OF SUBSTITUTION
FIGURE 12.HIGH COMPETITIVE RIVALRY
FIGURE 13.TOP PLAYER POSITIONING, 2020
FIGURE 14.MARKET SHARE ANALYSIS, 2020
FIGURE 15.RESTRAINTS AND DRIVERS: NEURAL NETWORK MARKET
FIGURE 16.NEURAL NETWORK MARKET SEGMENTATION, BY COMPONENT
FIGURE 17.NEURAL NETWORK MARKET FOR SOFTWARE, BY COUNTRY, 2020-2030 ($MILLION)
FIGURE 18.NEURAL NETWORK MARKET FOR SERVICE, BY COUNTRY, 2020-2030 ($MILLION)
FIGURE 19.NEURAL NETWORK MARKET SEGMENTATION, BY INDUSTRY VERTICAL
FIGURE 20.NEURAL NETWORK MARKET FOR BFSI, BY COUNTRY, 2020-2030 ($MILLION)
FIGURE 21.NEURAL NETWORK MARKET FOR IT AND TELECOM, BY COUNTRY, 2020-2030 ($MILLION)
FIGURE 22.NEURAL NETWORK MARKET FOR AEROPSACE AND DEFENCE, BY COUNTRY, 2020-2030 ($MILLION)
FIGURE 23.NEURAL NETWORK MARKET FOR PUBLIC SECTOR, BY COUNTRY, 2020-2030 ($MILLION)
FIGURE 24.NEURAL NETWORK MARKET FOR RETAIL, BY COUNTRY, 2020-2030 ($MILLION)
FIGURE 25.NEURAL NETWORK MARKET FOR HEALTHCARE, BY COUNTRY, 2020-2030 ($MILLION)
FIGURE 26.NEURAL NETWORK MARKET FOR MANUFACTURING, BY COUNTRY, 2020-2030 ($MILLION)
FIGURE 27.NEURAL NETWORK MARKET FOR ENERGY AND UTILITIES, BY COUNTRY, 2020-2030 ($MILLION)
FIGURE 28.NEURAL NETWORK MARKET FOR OTHERS, BY COUNTRY, 2020-2030 ($MILLION)
FIGURE 29.AFINITI: NET SALES, 2018-2020 ($MILLION)
FIGURE 30.AFINITI: REVENUE SHARE, BY SEGMENT, 2020 (%)
FIGURE 31.AFINITI: REVENUE SHARE, BY REGION, 2020 (%)
FIGURE 32.ALYUDA RESEARCH, LLC: NET SALES, 2018-2020 ($MILLION)
FIGURE 33.ALYUDA RESEARCH, LLC: REVENUE SHARE, BY SEGMENT, 2020 (%)
FIGURE 34.ALYUDA RESEARCH, LLC: REVENUE SHARE, BY REGION, 2020 (%)
FIGURE 35.GMDH INC.: NET SALES, 2018-2020 ($MILLION)
FIGURE 36.GMDH INC.: REVENUE SHARE, BY SEGMENT, 2020 (%)
FIGURE 37.GMDH INC.: REVENUE SHARE, BY REGION, 2020 (%)
FIGURE 38.NEURAL TECHNOLOGIES LIMITED: NET SALES, 2018-2020 ($MILLION)
FIGURE 39.NEURAL TECHNOLOGIES LIMITED: REVENUE SHARE, BY SEGMENT, 2020 (%)
FIGURE 40.NEURAL TECHNOLOGIES LIMITED: REVENUE SHARE, BY REGION, 2020 (%)
FIGURE 41.NEURALWARE: NET SALES, 2018-2020 ($MILLION)
FIGURE 42.NEURALWARE: REVENUE SHARE, BY SEGMENT, 2020 (%)
FIGURE 43.NEURALWARE: REVENUE SHARE, BY REGION, 2020 (%)
FIGURE 44.NDIMENSIONAL: NET SALES, 2018-2020 ($MILLION)
FIGURE 45.NDIMENSIONAL: REVENUE SHARE, BY SEGMENT, 2020 (%)
FIGURE 46.NDIMENSIONAL: REVENUE SHARE, BY REGION, 2020 (%)
FIGURE 47.OLSOFT LLC: NET SALES, 2018-2020 ($MILLION)
FIGURE 48.OLSOFT LLC: REVENUE SHARE, BY SEGMENT, 2020 (%)
FIGURE 49.OLSOFT LLC: REVENUE SHARE, BY REGION, 2020 (%)
FIGURE 50.STARMIND: NET SALES, 2018-2020 ($MILLION)
FIGURE 51.STARMIND: REVENUE SHARE, BY SEGMENT, 2020 (%)
FIGURE 52.STARMIND: REVENUE SHARE, BY REGION, 2020 (%)
FIGURE 53.SWIFTKEY (MICROSOFT CORPORATION): NET SALES, 2018-2020 ($MILLION)
FIGURE 54.SWIFTKEY (MICROSOFT CORPORATION): REVENUE SHARE, BY SEGMENT, 2020 (%)
FIGURE 55.SWIFTKEY (MICROSOFT CORPORATION): REVENUE SHARE, BY REGION, 2020 (%)
FIGURE 56.WARD SYSTEMS GROUP, INC.: NET SALES, 2018-2020 ($MILLION)
FIGURE 57.WARD SYSTEMS GROUP, INC.: REVENUE SHARE, BY SEGMENT, 2020 (%)
FIGURE 58.WARD SYSTEMS GROUP, INC.: REVENUE SHARE, BY REGION, 2020 (%)
Neural network is a computational learning system that provides users with a network of functions to understand and translate data input of one form into a desired output, usually in another form. In addition, this concept of the artificial neural network is basically inspired by human biology and the way neurons of the human brain function together to understand inputs from human senses. In addition, it helps in simplifying many real-life problems in day to day lifestyle, including speech and image recognition, spam email filtering, finance, and medical diagnosis.
Key providers of the market, such as SWIFTKEY (Microsoft Corporation), GMDH Inc., and NeuralWare account for a significant share in the market. Various companies are partnering to increase the neural network capabilities with the larger requirement for neural network. For instance, in January 2021, OpenAI API introduced text and code embeddings, which makes it easy to perform natural language and code tasks such assemantic search, clustering, topic modeling, and classification. Embeddings are numerical representations of concepts converted to number sequences, which make it easy for computers to understand the relationships between those concepts. In addition, the new endpoint uses neural network models, which are descendants of GPT-3, to map text and code to a vector representation “embedding” them in a high-dimensional space. Each dimension captures some aspect of the input.
Moreover, market players expand their business operations and customers by increasing their acquisition. For instance, in June 2021, Lumine Group, a division of Volaris Group focused in the communications and media vertical, acquired Neural Technologies Ltd., a provider of modular revenue protection, signaling, machine learning (ML), and artificial intelligence (AI) software for telecom operators. Its revenue assurance suite includes capabilities for fraud management, revenue assurance, credit-risk management, business assurance, and anti-money laundering. Its ML and AI capabilities assist telecom operators with data integration and customer engagement. Neural is Lumine’s 19th acquisition, further establishing Lumine’s position as a leading global acquirer of communications and media software businesses.
Furthermore, with intensive investment market players in neural network drive the market growth with innovative developments. For instance, in January 2022, Uniquify, a Silicon Valley neural network and AI edge computing company, launched neural network 2.0 technology. In addition, with Uniquify’s second-generation neural network 2.0 technology, neural networks shrink neurons by using proprietary AI processing elements (AIPEs) in place of MAC operations.
Start reading instantly.
This Report and over 67,068+ more Reports, Available with Avenue Library. T&C*.
Enterprise
License/PDF
Library
Membership
*Taxes/Fees, if applicable will be added during checkout. All prices in USD
To ensure high-level data integrity, accurate analysis, and impeccable forecasts
For complete satisfaction
On-demand customization of scope of the report to exactly meet your needs
Targeted market view to provide pertinent information and save time of readers
Get insights on topics that are crucial for your business. Stay abreast of your interest areas.
Get Industry Data AlertsTo ensure high-level data integrity, accurate analysis, and impeccable forecasts
For complete satisfaction
On-demand customization of scope of the report to exactly meet your needs
Targeted market view to provide pertinent information and save time of readers