
Neurosurgery Devices Market Research, 2033
Market Introduction and Definition
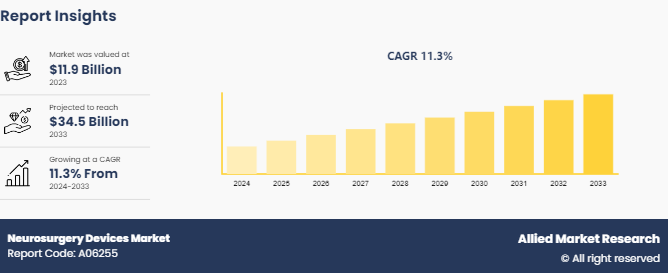
The global neurosurgery devices market size was valued at $11.9 billion in 2023, and is projected to reach $34.5 billion by 2033, growing at a CAGR of 11.3% from 2024 to 2033. The growth of the neurosurgery devices market is driven by several key factors, including the increasing prevalence of neurological disorders such as brain tumors, Parkinson's disease, and epilepsy. Technological advancements in minimally invasive surgical techniques and the development of innovative neurosurgical devices also contribute to market expansion. Additionally, the rising demand for precision and safety in complex neurosurgical procedures, along with increased healthcare expenditure and better access to healthcare services in emerging economies, further fuels the market's growth. Neurosurgery devices are specialized tools and instruments used in surgical procedures involving the brain, spinal cord, and peripheral nerves. These devices play a critical role in diagnosing, treating, and managing various neurological conditions, such as brain tumors, aneurysms, spinal disorders, and traumatic brain injuries. The range of neurosurgery devices includes neuroendoscopes, neuromodulation devices, stereotactic systems, and cerebrospinal fluid management devices, among others. Their applications are vast, encompassing minimally invasive surgeries, deep brain stimulation, and the precise removal of brain tumors. The advancements in these devices have significantly improved the precision, safety, and outcomes of neurosurgical procedures, which enable better patient recovery and reduce the risks associated with complex neurological surgeries.
Key Takeaways
- The Neurosurgery Devices market share study covers 20 countries. The research includes a segment analysis of each country in terms of value for the projected period.
- More than 1, 500 product literatures, industry releases, annual reports, and other such documents of major Neurosurgery Devices industry participants along with authentic industry journals, trade associations' releases, and government websites have been reviewed for generating high-value industry insights.
- The study integrated high-quality data, professional opinions and analysis, and critical independent perspectives. The research approach is intended to provide a balanced view of global markets and assist stakeholders in making educated decisions to achieve their most ambitious growth objectives.
Key Market Dynamics
According to neurosurgery devices market forecast analysis the key factors driving the growth of the market are rise in prevalence of neurological disorders, growing geriatric population, technological advancement in the neurosurgery devices. Neurological disorders, such as Parkinson's disease, Alzheimer's disease, epilepsy, and brain tumors, are becoming increasingly common due to factors like an aging population, lifestyle changes, and improved diagnostic capabilities. According to 2023 article by Parkinson’s Europe, around 10 million people have the condition worldwide. As these conditions often require surgical treatment to manage symptoms or address underlying causes, the need for specialized neurosurgery devices has surged. Thus, the surge in neurological disorders is expected to drive the neurosurgery devices market growth.
Furthermore, according to 2022 article by World Health Organization, the global geriatric population is expected to increase by 10% from 2015 to 2050. As the global population ages, conditions such as Alzheimer's disease, Parkinson's disease, stroke, and other neurodegenerative disorders are becoming more common. These conditions often require surgical interventions, thus driving the demand for advanced neurosurgery devices. Additionally, older adults are more prone to traumatic brain injuries from falls, which further necessitates the use of neurosurgical procedures.
Disability-Adjusted Life Years (DALYs) , Caused by Neurological Conditions
According to neurosurgery devices market opportunity analysis the rise in disability-adjusted life years (DALYs) caused by neurological conditions significantly impacts the neurosurgery devices market. DALYs are a measure of overall disease burden, reflecting years lost due to premature death and years lived with disability. As neurological conditions such as stroke, epilepsy, neurodegenerative diseases, and traumatic brain injuries contribute to an increase in DALYs, there is a corresponding surge in demand for advanced neurosurgery devices. These conditions often require complex surgical interventions for diagnosis, treatment, and management, driving the need for innovative and effective neurosurgical tools and technologies. The growing prevalence of neurological disorders heightens the urgency for more precise, minimally invasive surgical options and advanced imaging systems to improve patient outcomes, thus driving the growth of neurosurgery devices market size

Market Segmentation
The neurosurgery devices industry is segmented into product, application, end user, and region. By product, the market is classified into neurostimulation devices, neurointerventional devices, neurosurgical navigation systems, cerebral spinal fluid (CSF) management devices, and others. By application, the market is divided into spinal cord stimulation, deep brain stimulation, and neuroendoscopy. By end user, it is segregated into hospitals, ambulatory surgical centers, and others. Region wise, the market is analyzed across North America, Europe, Asia-Pacific, and LAMEA.
Regional/Country Market Outlook
North America dominated the neurosurgery devices market share in 2023 owing to substantial research and development activities, a strong presence of major key players, well-established healthcare infrastructure, and surge in prevalence of neurological disease. In the Asia-Pacific region, rapid market expansion is anticipated due to improving healthcare infrastructure, rise in geriatric population, and growing medical device industry.
- According to 2024 article by National Health Service, more than 9, 000 people are diagnosed with primary brain tumors in the UK each year, of which about half are benign and half are malignant.
- According to Alzheimer's Association, by 2050, around 50 million peoples will be living with Alzheimer's disease in U.S.
- According to Center of Disease Control and Prevention, around 69, 473 traumatic brain injury related deaths occurred in U.S. in 2021
Industry Trends
- According to the article by American Cancer Society, an estimated 25, 400 malignant tumors of the brain or spinal cord is expected to be diagnosed in 2024.
- According to 2024 article by National Library of Medicine, Glioblastoma multiforme (GBM) is the most malignant and pervasive subtype of glioma and is the most common primary brain tumor in adults. Glioblastoma multiforme accounting for 45.2% of primary malignant brain and central nervous system (CNS) tumors.
- According to Center of Disease Control and Prevention, there were over 69, 000 traumatic brain injury & concussion related deaths in the U.S. in 2021.
- According to 2022 article by National Library of Medicine, Artificial intelligence (AI) and machine learning (ML) algorithms are on the tremendous rise for being incorporated into the field of neurosurgery.
Competitive Landscape
The major players operating in the neurosurgery devices market include as Abbott Laboratories, Ackermann Instrumente GmbH, Adeor Medical AG, B. Braun Melsungen AG, Biotronik, Boston Scientific Corporation, DePuy Synthes Inc., Integra LifeSciences Corporation, Johnson & Johnson, Medtronic Plc. Other players in the neurosurgery devices market are Nevro Corporation, Nihon Kohden Corporation, Penumbra Inc., Stryker Corporation.
Recent Key Strategies and Developments
- In May 2024, AiM Medical Robotics Inc. (AiM) , developer of MRI-compatible intraoperative robotics for neurosurgery and other applications, announced a collaboration with Brigham and Women’s Hospital (BWH) and the Surgical Navigation and Robotics (SNR) Lab at Harvard to validate their cutting-edge robot for deep brain stimulation in Parkinson’s patients
- In August 2022, AiM Medical Robotics announced that it has received funding from Sontag Innovation Fund, a wholly owned venture subsidiary of The Sontag Foundation, one of the largest private funders of brain cancer research in the U.S.
Key Benefits for Stakeholders
- This report provides a quantitative analysis of the market segments, current trends, estimations, and dynamics of the neurosurgery devices market analysis from 2024 to 2033 to identify the prevailing neurosurgery devices market opportunities.
- The market research is offered along with information related to key drivers, restraints, and opportunities.
- Porter's five forces analysis highlights the potency of buyers and suppliers to enable stakeholders make profit-oriented business decisions and strengthen their supplier-buyer network.
- In-depth analysis of the neurosurgery devices market segmentation assists to determine the prevailing market opportunities.
- Major countries in each region are mapped according to their revenue contribution to the global market.
- Market player positioning facilitates benchmarking and provides a clear understanding of the present position of the market players.
- The report includes the analysis of the regional as well as global neurosurgery devices market trends, key players, market segments, application areas, and market growth strategies.
Neurosurgery Devices Market Report Highlights
| Aspects | Details |
| Market Size By 2033 | USD 34.5 Billion |
| Growth Rate | CAGR of 11.3% |
| Forecast period | 2024 - 2033 |
| Report Pages | 280 |
| By Product |
|
| By Application |
|
| By End User |
|
| By Region |
|
| Key Market Players | Biotronik SE & Co. KG, Abbott Laboratories, Boston Scientific Corporation, B. Braun Melsungen AG, Stryker Corporation., Integra Lifesciences Corporation., Adeor Medical AG, Ackermann Instrumente GmbH, Johnson and Johnson, Medtronic plc |
Analyst Review
The global neurosurgery devices market size was valued at $11.9 billion in 2023
The market value of Neurosurgery Devices Market is projected to reach $34.5 billion by 2033
The forecast period for Neurosurgery Devices Market is 2024-2033.
Major key players that operate in the Neurosurgery Devices Market are Abbott Laboratories, Ackermann Instrumente GmbH, Adeor Medical AG, B. Braun Melsungen AG.
The base year is 2023 in Neurosurgery Devices Market
Loading Table Of Content...

