Report Code: A04926 | May 2019 | Pages: 275 | ||
Tables: 120 | Charts: 78 |
|
Pandemic disrupted the entire world and affected many industries.
Get detailed COVID-19 impact analysis on the Next-generation Firewall Market
Request Now !The global next-generation firewall market size was valued at $2,570.49 million in 2017, and is projected to reach $6,719.56 million by 2025, registering a CAGR of 12.9% from 2018 to 2025. The next-generation firewall (NGFW) refers to the third-generation of network firewall technology, which integrates additional capabilities such as in-line deep packet inspection (DPI), application-level traffic inspection, and intrusion prevention (IPS). Increase in IoT-based complex threat landscape, rise in number of data breach cases, and surge in demand for NGFW solutions supported by stringent government regulations for data safety & security boost the next-generation firewall market growth. However, certain factors such as shortage of cyber security skills and performance issues associated with cloud protection restrain the growth of the next-generation firewall industry.
The growth of the global next-generation firewall market size is driven by rise in demand for advanced cyber security solutions, development of IoT-based complex threat landscape, and enforcement of stringent government regulations for data security. Furthermore, performance issues associated with next-generation firewall solutions in cloud protection and lack of skilled professionals are expected to considerably impact the growth of the next-generation firewall market during the forecast period. Moreover, continuous increase in digital security spending and the emergence of firewall as a service are expected to be opportunistic for the global market during the forecast period.
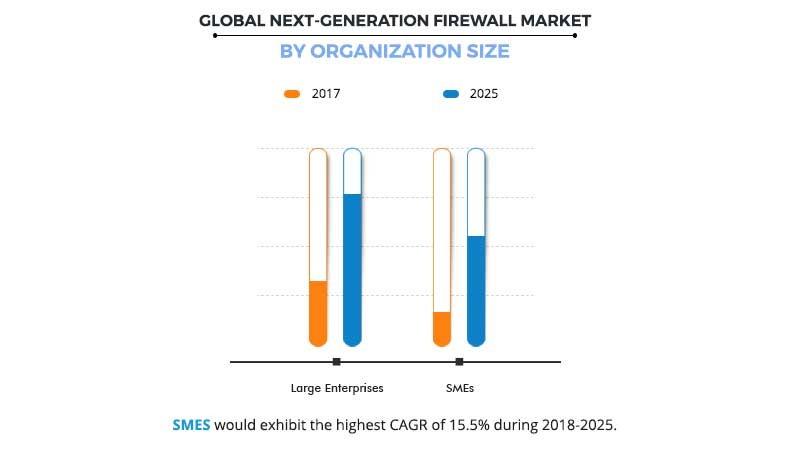
The large enterprises segment dominated the overall next-generation firewall market share in 2017, owing to significant adoption of advanced security solution among large-sized organizations. Digital security has become a complex process in large-sized organizations to manage and secure massive volume of data, which promotes the adoption of NGFW solutions among them. However, the SMEs are expected to exhibit the highest growth rate during the forecast period, owing to growth in the need to implement advanced firewall technology, which can perform multiple functions and rise in IT security spending among these organizations.
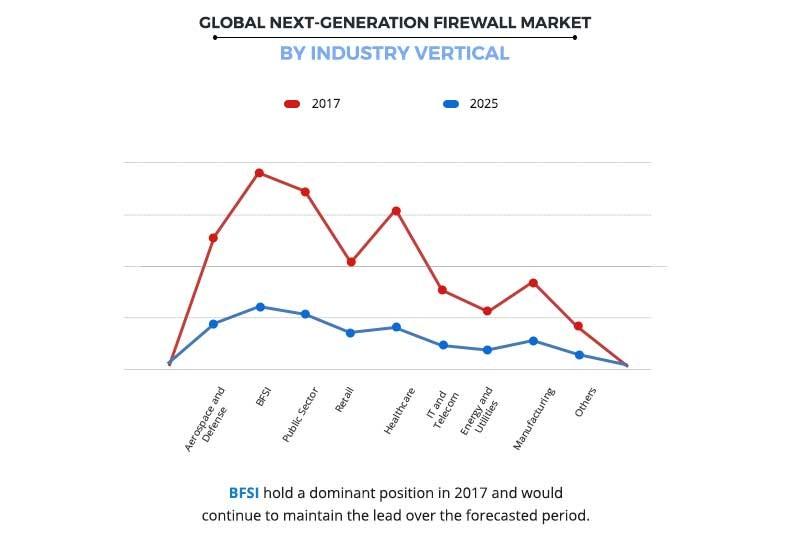
The BFSI segment dominated the global NGFW market in 2017, owing to rise in need to protect customer data with the increase in data volume and the large number of endpoints and mobile devices, which are vulnerable to brand-damaging threats. However, the healthcare segment is expected to grow at the highest rate, due to the ongoing trend of digitalization of healthcare industry and increase in security breaches related to medical records, medical devices, and its data in healthcare organizations, which fuel the demand for these firewall solutions, and drive the next-generation firewall market.
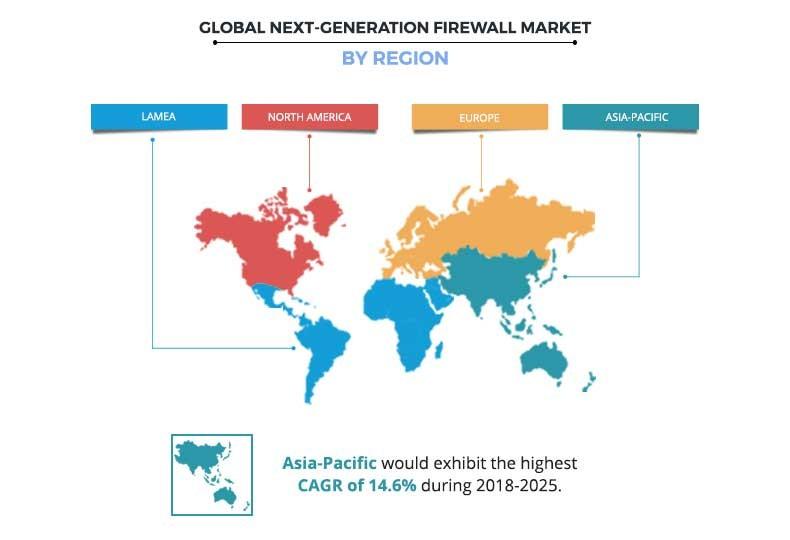
North America governed the overall next-generation firewall market share, in terms of revenue, in 2017, due to significant adoption of advanced cyber security solutions, supported by factors such as rise in cases of cyberattacks, significant adoption of BYOD and IoT-based devices in the region. However, Asia-Pacific is expected to witness the highest growth rate during the next-generation firewall market forecast period, owing to factors such as increase in IT modernization, surge in penetration of internet, and rise in need to protect corporate & personal information from cyberattacks. Moreover, upsurge in adoption of IoT-based devices in countries such as Taiwan & South Korea and development of smart cities are expected to provide remunerative opportunities for market expansion during the forecast period.
The report focuses on the growth prospects, restraints, and trends of the global next-generation firewall market analysis. Moreover, the study includes the Porter’s five forces analysis of the industry to understand the impact of various factors such as bargaining power of suppliers, competitive intensity of competitors, threat of new entrants, threat of substitutes, and bargaining power of buyers on the growth of the market.
Segment review
The global next-generation firewall market is segmented based on component, type, organization size, industry vertical, and region. Based on component, it is bifurcated into solution and services. Depending on type, the market is divided into hardware, virtual, and cloud. On the basis of organization size, it is bifurcated into large enterprises and SMEs. By industry vertical, it is classified into aerospace & defense, BFSI, public sector, retail, healthcare, IT & telecom, energy & utilities, manufacturing, and others. Region wise, it is analyzed across North America, Europe, Asia-Pacific, and LAMEA.
The key players operating in the global next-generation firewall market include Barracuda Networks, Check Point, Cisco, Forcepoint, Fortinet, Huawei, Juniper Networks, Palo Alto Networks, SonicWall, and Sophos.
Top impacting factors
Increase in sophisticated cyberattacks
Cyberattacks continue to increase, recording about 159,700 attacks in 2017, almost twice from 82,000 incidents of 2016. More than two-thirds of SMBs have reported rise in sophistication in cyberattacks. Presently, cyber criminals have access to a variety of plug-and-play options that are generally pieced together for complicated malware campaigns. More specifically, exploit builder kits such as GandCrab and ThreadKit are regularly updated on the latest attack strategies that make normal security tools incapable of protecting businesses and their data. Such sophisticated attacks are expected to continue, owing to increase in usage of bring-your-own-device (BYOD), smartphones, social media, and cloud services globally. Thus, rise in instances of advanced attacks are motivating companies to adopt advanced methods for data protection such as next-generation firewalls, thus playing a major role in NGFW market growth.
Enforcement of stringent government regulations for data safety and security
Governments across the world have taken several initiatives in the form of regulations regarding data security to overcome the issue of data breaches. These cyber security regulations aim to mandate the organizations to defend their systems and information from cyberattacks. Industry regulations such as Health Insurance Portability and Accountability Act (HIPAA), Gramm-Leach Biley Act, and Homeland Security Act promote the adoption of advanced cyber security solutions in critical industries such as BFSI, healthcare, and government. Similarly, the Financial Services Modernization Act, 1999 in the U.S. defines regulations related to data security for financial information of customers collected by financial institutions. These regulations in turn build pressure on organizations to set up enhanced security infrastructure and promote the adoption of advanced security solutions such as next-generation firewalls. Thus, these regulations significantly boost the growth of the global next-generation firewall market.
Rise in cyber security spending
There has been an increase in the cybersecurity budget across the globe in the recent years. Business and public organizations are investing more on securing their data, as they have been continuously trying to build comprehensive solutions to prevent hackers from attacking their networks. Rise in economic losses due to cyberattacks led to 23% increase in cyber security spending among in 2017. According to cyber security report from Vodafone, the awareness of rising cyber threats and more demanding customer requirements are driving an increase in cyber security budgets. About 87% of businesses are expected to increase spending on cyber security in the next three years, and almost 10% of companies are anticipated to double their cybersecurity budgets. Furthermore, developing countries such as India and China are continuously improving their cybersecurity spending for better safeguarding against advanced threats. This growth in cybersecurity spending is expected to create significant opportunities for the next-generation firewall market during the forecast period.
Impact of COVID-19 on Next-Generation Firewall Market:
Next-generation Firewall Market Report Highlights
Aspects | Details |
---|---|
By Component |
|
By Type |
|
By Organization Size |
|
By Industry Vertical |
|
By Region |
|
Key Market Players | PALO ALTO NETWORKS, INC., CHECK POINT SOFTWARE TECHNOLOGIES LTD., JUNIPER NETWORKS, INC., FORCEPOINT LLC, CISCO SYSTEMS, INC., SONICWALL INC., FORTINET, INC., SOPHOS LTD., BARRACUDA NETWORKS, INC., HUAWEI TECHNOLOGIES CO., LTD. |
CHAPTER 1:Â Â Â INTRODUCTION
1.1.   REPORT DESCRIPTION
1.2.   KEY BENEFITS FOR STAKEHOLDERS
1.3.   KEY MARKET SEGMENTS
1.4.   RESEARCH METHODOLOGY
1.4.1.   Secondary research
1.4.2.   Primary research
1.4.3.   Analyst tools & models
CHAPTER 2:Â Â Â EXECUTIVE SUMMARY
2.1.   KEY FINDINGS
2.1.1.   Top impacting factors
2.1.2.   Top investment pockets
CXO PERSPECTIVE
CHAPTER 3:Â Â Â MARKET OVERVIEW
3.1.   MARKET DEFINITION AND SCOPE
3.2.   KEY FORCES SHAPING NEXT-GENERATION FIREWALL MARKET
3.2.1.   Moderate-to-high bargaining power of suppliers
3.2.2.   Moderate bargaining power of buyers
3.2.3.   Moderate-to-high threat of substitutes
3.2.4.   Moderate-to-high threat of new entrants
3.2.5.   High competitive rivalry
3.3.   CASE STUDIES
3.3.1.   Privalia
3.3.2.   U.S. Federal Government
3.4.   MARKET DYNAMICS
3.4.1.   Drivers
3.4.1.1.   Increase in sophisticated cyberattacks
3.4.1.2.   Development in IoT-based complex threat landscape
3.4.1.3.   Enforcement of stringent government regulations for data safety and security
3.4.2.   Restraints
3.4.2.1.   Lack of skilled professionals
3.4.2.2.   Performance issues associated with cloud protection
3.4.3.   Opportunities
3.4.3.1.   Rise in cyber security spending
3.4.3.2.   Emergence of firewall as a service
CHAPTER 4:Â Â Â NEXT-GENERATION FIREWALL MARKET, BY COMPONENT
4.1.   OVERVIEW
4.2.   SOLUTION
4.2.1.   Key market trends, growth factors, and opportunities
4.2.2.   Market size and forecast, by region
4.2.3.   Market analysis, by country
4.3.   SERVICE
4.3.1.   Key market trends, growth factors, and opportunities
4.3.2.   Market size and forecast, by region
4.3.3.   Market analysis, by country
CHAPTER 5:Â Â Â NEXT-GENERATION FIREWALL MARKET, BY TYPE
5.1.   OVERVIEW
5.2.   HARDWARE
5.2.1.   Key market trends, growth factors, and opportunities
5.2.2.   Market size and forecast, by region
5.2.3.   Market analysis, by country
5.3.   VIRTUAL
5.3.1.   Key market trends, growth factors, and opportunities
5.3.2.   Market size and forecast, by region
5.3.3.   Market analysis, by country
5.4.   CLOUD BASED
5.4.1.   Key market trends, growth factors, and opportunities
5.4.2.   Market size and forecast, by region
5.4.3.   Market analysis, by country
CHAPTER 6:Â Â Â NEXT-GENERATION FIREWALL MARKET, BY ORGANIZATION SIZE
6.1.   OVERVIEW
6.2.   LARGE ENTERPRISES
6.2.1.   Key market trends, growth factors, and opportunities
6.2.2.   Market size and forecast, by region
6.2.3.   Market analysis, by country
6.3.   SMES
6.3.1.   Key market trends, growth factors, and opportunities
6.3.2.   Market size and forecast, by region
6.3.3.   Market analysis, by country
CHAPTER 7:Â Â Â NEXT-GENERATION FIREWALL MARKET, BY INDUSTRY VERTICAL
7.1.   OVERVIEW
7.2.   AEROSPACE & DEFENSE
7.2.1.   Key market trends, growth factors, and opportunities
7.2.2.   Market size and forecast, by region
7.2.3.   Market analysis, by country
7.3.   BFSI
7.3.1.   Key market trends, growth factors, and opportunities
7.3.2.   Market size and forecast, by region
7.3.3.   Market analysis, by country
7.4.   ENERGY & UTILITIES
7.4.1.   Key market trends, growth factors, and opportunities
7.4.2.   Market size and forecast, by region
7.4.3.   Market analysis, by country
7.5.   PUBLIC SECTOR
7.5.1.   Key market trends, growth factors, and opportunities
7.5.2.   Market size and forecast, by region
7.5.3.   Market analysis, by country
7.6.   HEALTHCARE
7.6.1.   Key market trends, growth factors, and opportunities
7.6.2.   Market size and forecast, by region
7.6.3.   Market analysis, by country
7.7.   IT & TELECOM
7.7.1.   Key market trends, growth factors, and opportunities
7.7.2.   Market size and forecast, by region
7.7.3.   Market analysis, by country
7.8.   MANUFACTURING
7.8.1.   Key market trends, growth factors, and opportunities
7.8.2.   Market size and forecast, by region
7.8.3.   Market analysis, by country
7.9.   RETAIL
7.9.1.   Key market trends, growth factors, and opportunities
7.9.2.   Market size and forecast, by region
7.9.3.   Market analysis, by country
7.10.   OTHERS
7.10.1.   Key market trends, growth factors, and opportunities
7.10.2.   Market size and forecast, by region
7.10.3.   Market analysis, by country
CHAPTER 8:Â Â Â NEXT-GENERATION FIREWALL MARKET, BY REGION
8.1.   OVERVIEW
8.2.   NORTH AMERICA
8.2.1.   Key market trends, growth factors, and opportunities
8.2.2.   Market size and forecast
8.2.2.1.   Market size and forecast, by component
8.2.2.2.   Market size and forecast, by type
8.2.2.3.   Market size and forecast, by organization size
8.2.2.4.   Market size and forecast, by industry vertical
8.2.2.5.   Market size and forecast, by country
8.2.2.6.   U.S.
8.2.2.6.1.   Market size and forecast, by component
8.2.2.6.2.   Market size and forecast, by type
8.2.2.6.3.   Market size and forecast, by organization size
8.2.2.6.4.   Market size and forecast, by industry vertical
8.2.2.7.   Canada
8.2.2.7.1.   Market size and forecast, by component
8.2.2.7.2.   Market size and forecast, by type
8.2.2.7.3.   Market size and forecast, by organization size
8.2.2.7.4.   Market size and forecast, by industry vertical
8.3.   EUROPE
8.3.1.   Key market trends, growth factors, and opportunities
8.3.2.   Market size and forecast
8.3.2.1.   Market size and forecast, by component
8.3.2.2.   Market size and forecast, by type
8.3.2.3.   Market size and forecast, by organization size
8.3.2.4.   Market size and forecast, by industry vertical
8.3.2.5.   Market size and forecast, by country
8.3.2.6.   UK
8.3.2.6.1.   Market size and forecast, by component
8.3.2.6.2.   Market size and forecast, by type
8.3.2.6.3.   Market size and forecast, by organization size
8.3.2.6.4.   Market size and forecast, by industry vertical
8.3.2.7.   Germany
8.3.2.7.1.   Market size and forecast, by component
8.3.2.7.2.   Market size and forecast, by type
8.3.2.7.3.   Market size and forecast, by organization size
8.3.2.7.4.   Market size and forecast, by industry vertical
8.3.2.8.   France
8.3.2.8.1.   Market size and forecast, by component
8.3.2.8.2.   Market size and forecast, by type
8.3.2.8.3.   Market size and forecast, by organization size
8.3.2.8.4.   Market size and forecast, by industry vertical
8.3.2.9.   Italy
8.3.2.9.1.   Market size and forecast, by component
8.3.2.9.2.   Market size and forecast, by type
8.3.2.9.3.   Market size and forecast, by organization size
8.3.2.9.4.   Market size and forecast, by industry vertical
8.3.2.10.   Russia
8.3.2.10.1Â Â Â Â Â Â Market size and forecast, by component
8.3.2.10.2.    Market size and forecast, by type
8.3.2.10.3.   Market size and forecast, by organization size
8.3.2.10.4.  Market size and forecast, by industry vertical
8.3.2.11.   Rest of Europe
8.3.2.11.1.    Market size and forecast, by component
8.3.2.11.2.   Market size and forecast, by type
8.3.2.11.3.   Market size and forecast, by organization size
8.3.2.11.4.  Market size and forecast, by industry vertical
8.4.   ASIA-PACIFIC
8.4.1.   Key market trends, growth factors, and opportunities
8.4.2.   Market size and forecast
8.4.2.1.   Market size and forecast, by component
8.4.2.2.   Market size and forecast, by type
8.4.2.3.   Market size and forecast, by organization size
8.4.2.4.   Market size and forecast, by industry vertical
8.4.2.5.   Market size and forecast, by country
8.4.2.6.   China
8.4.2.6.1.       Market size and forecast, by component
8.4.2.6.2.       Market size and forecast, by type
8.4.2.6.3.      Market size and forecast, by organization size
8.4.2.6.4.   Market size and forecast, by industry vertical
8.4.2.7.   India
8.4.2.7.1.   Market size and forecast, by component
8.4.2.7.2.   Market size and forecast, by type
8.4.2.7.3.   Market size and forecast, by organization size
8.4.2.7.4.   Market size and forecast, by industry vertical
8.4.2.8.   Japan
8.4.2.8.1.   Market size and forecast, by component
8.4.2.8.2.   Market size and forecast, by type
8.4.2.8.3.   Market size and forecast, by organization size
8.4.2.8.4.   Market size and forecast, by industry vertical
8.4.2.9.   Australia
8.4.2.9.1.   Market size and forecast, by component
8.4.2.9.2.   Market size and forecast, by type
8.4.2.9.3.   Market size and forecast, by organization size
8.4.2.9.4.   Market size and forecast, by industry vertical
8.4.2.10.   Rest of Asia-Pacific
8.4.2.10.1.   Market size and forecast, by component
8.4.2.10.2.   Market size and forecast, by type
8.4.2.10.3.   Market size and forecast, by organization size
8.4.2.10.4.   Market size and forecast, by industry vertical
8.5.   LAMEA
8.5.1.   Key market trends, growth factors, and opportunities
8.5.2.   Market size and forecast
8.5.2.1.   Market size and forecast, by component
8.5.2.2.   Market size and forecast, by type
8.5.2.3.   Market size and forecast, by organization size
8.5.2.4.   Market size and forecast, by industry vertical
8.5.2.5.   Market size and forecast, by country
8.5.2.6.   Latin America
8.5.2.6.1.   Market size and forecast, by component
8.5.2.6.2.   Market size and forecast, by type
8.5.2.6.3.   Market size and forecast, by organization size
8.5.2.6.4.   Market size and forecast, by industry vertical
8.5.2.7.   Middle East
8.5.2.7.1.   Market size and forecast, by component
8.5.2.7.2.   Market size and forecast, by type
8.5.2.7.3.   Market size and forecast, by organization size
8.5.2.7.4.   Market size and forecast, by industry vertical
8.5.2.8.   Africa
8.5.2.8.1.   Market size and forecast, by component
8.5.2.8.2.   Market size and forecast, by type
8.5.2.8.3.   Market size and forecast, by organization size
8.5.2.8.4.   Market size and forecast, by industry vertical
CHAPTER 9:Â Â Â COMPETITIVE LANDSCAPE
9.1.   INTRODUCTION
9.1.1.   MARKET PLAYER POSITIONING, 2017
9.2.   TOP WINNING STRATEGIES
9.2.1.   Top winning strategies, by year
9.2.2.   Top winning strategies, by development
9.2.3.   Top winning strategies, by company
CHAPTER 10:Â Â Â COMPANY PROFILES
10.1.   BARRACUDA NETWORKS, INC.
10.1.1.   Company overview
10.1.2.   Key Executives
10.1.3.   Company snapshot
10.1.4.   Product portfolio
10.1.5.   Key strategic moves and developments
10.2.   CHECK POINT SOFTWARE TECHNOLOGIES LTD.
10.2.1.   Company overview
10.2.2.   Key Executives
10.2.3.   Company snapshot
10.2.4.   Product portfolio
10.2.5.   R&D Expenditure
10.2.6.   Business performance
10.2.7.   Key strategic moves and developments
10.3.   CISCO SYSTEMS, INC.
10.3.1.   Company overview
10.3.2.   Key Executives
10.3.3.   Company snapshot
10.3.4.   Operating business segments
10.3.5.   Product portfolio
10.3.6.   Business performance
10.3.7.   Key strategic moves and developments
10.4.   FORCEPOINT LLC
10.4.1.   Company overview
10.4.2.   Key Executives
10.4.3.   Company snapshot
10.4.4.   Product portfolio
10.4.5.   Key strategic moves and developments
10.5.   FORTINET, INC.
10.5.1.   Company overview
10.5.2.   Key Executives
10.5.3.   Company snapshot
10.5.4.   Product portfolio
10.5.5.   R&D Expenditure
10.5.6.   Business performance
10.5.7.   Key strategic moves and developments
10.6.   HUAWEI TECHNOLOGIES CO., LTD.
10.6.1.   Company overview
10.6.2.   Key Executives
10.6.3.   Company snapshot
10.6.4.   Operating business segments
10.6.5.   Product portfolio
10.6.6.   R&D Expenditure
10.6.7.   Business performance
10.6.8.   Key strategic moves and developments
10.7.   JUNIPER NETWORKS, INC.
10.7.1.   Company overview
10.7.2.   Key Executives
10.7.3.   Company snapshot
10.7.4.   Product portfolio
10.7.5.   R&D Expenditure
10.7.6.   Business performance
10.7.7.   Key strategic moves and developments
10.8.   PALO ALTO NETWORKS, INC.
10.8.1.   Company overview
10.8.2.   Key Executives
10.8.3.   Company snapshot
10.8.4.   Product portfolio
10.8.5.   R&D Expenditure
10.8.6.   Business performance
10.8.7.   Key strategic moves and developments
10.9.   SONICWALL INC.
10.9.1.   Company overview
10.9.2.   Key Executives
10.9.3.   Company snapshot
10.9.4.   Product portfolio
10.9.5.   Key strategic moves and developments
10.10.   SOPHOS LTD.
10.10.1. Company overview
10.10.2. Key Executives
10.10.3. Company snapshot
10.10.4. Product portfolio
10.10.5. R&D Expenditure
10.10.6. Business performance
10.10.7. Key strategic moves and developments
LIST OF TABLES
TABLE 01.   GLOBAL NEXT-GENERATION FIREWALL MARKET REVENUE, BY COMPONENT, 2017–2025 ($MILLION)
TABLE 02.   NEXT-GENERATION FIREWALL MARKET REVENUE FOR SOLUTION, BY REGION, 2017–2025 ($MILLION)
TABLE 03.   NEXT-GENERATION FIREWALL MARKET REVENUE FOR SERVICE, BY REGION, 2017–2025 ($MILLION)
TABLE 04.   GLOBAL NEXT-GENERATION FIREWALL MARKET REVENUE, BY TYPE, 2017–2025 ($MILLION)
TABLE 05.   NEXT-GENERATION FIREWALL MARKET REVENUE FOR HARDWARE, BY REGION, 2017–2025 ($MILLION)
TABLE 06.   NEXT-GENERATION FIREWALL MARKET REVENUE FOR GS SERIES, BY REGION, 2017–2025 ($MILLION)
TABLE 07.   NEXT-GENERATION FIREWALL MARKET REVENUE FOR CLOUD-BASED FIREWALLS, BY REGION, 2017–2025 ($MILLION)
TABLE 08.   GLOBAL NEXT-GENERATION FIREWALL MARKET REVENUE, BY ORGANIZATION SIZE, 2017–2025 ($MILLION)
TABLE 09.   NEXT-GENERATION FIREWALL MARKET REVENUE FOR LARGE ENTERPRISES, BY REGION, 2017–2025 ($MILLION)
TABLE 10.   NEXT-GENERATION FIREWALL MARKET REVENUE FOR SMES, BY REGION, 2017–2025 ($MILLION)
TABLE 11.   GLOBAL NEXT-GENERATION FIREWALL MARKET REVENUE, BY INDUSTRY VERTICAL, 2017–2025 ($MILLION)
TABLE 12.   NEXT-GENERATION FIREWALL MARKET REVENUE FOR AEROSPACE & DEFENSE, BY REGION, 2017–2025 ($MILLION)
TABLE 13.   NEXT-GENERATION FIREWALL MARKET REVENUE FOR BFSI, BY REGION, 2017–2025 ($MILLION)
TABLE 14.   NEXT-GENERATION FIREWALL MARKET REVENUE FOR ENERGY & UTILITIES, BY REGION, 2017–2025 ($MILLION)
TABLE 15.   NEXT-GENERATION FIREWALL MARKET REVENUE FOR PUBLIC SECTOR, BY REGION, 2017–2025 ($MILLION)
TABLE 16.   NEXT-GENERATION FIREWALL MARKET REVENUE FOR HEALTHCARE, BY REGION, 2017–2025 ($MILLION)
TABLE 17.   NEXT-GENERATION FIREWALL MARKET REVENUE FOR IT & TELEOCM, BY REGION, 2017–2025 ($MILLION)
TABLE 18.   NEXT-GENERATION FIREWALL MARKET REVENUE FOR MANUFACTURING, BY REGION, 2017–2025 ($MILLION)
TABLE 19.   NEXT-GENERATION FIREWALL MARKET REVENUE FOR RETAIL, BY REGION, 2017–2025 ($MILLION)
TABLE 20.   NEXT-GENERATION FIREWALL MARKET REVENUE FOR OTHERS, BY REGION, 2017–2025 ($MILLION)
TABLE 21.   NEXT-GENERATION FIREWALL MARKET REVENUE, BY REGION, 2017–2025 ($MILLION)
TABLE 22.   NORTH AMERICA NEXT-GENERATION FIREWALL MARKET, BY COMPONENT, 2017–2025 ($MILLION)
TABLE 23.   NORTH AMERICA NEXT-GENERATION FIREWALL MARKET, BY TYPE, 2017–2025 ($MILLION)
TABLE 24.   NORTH AMERICA NEXT-GENERATION FIREWALL MARKET, BY ORGANIZATION SIZE, 2017–2025 ($MILLION)
TABLE 25.   NORTH AMERICA NEXT-GENERATION FIREWALL MARKET, BY INDUSTRY VERTICAL, 2017–2025 ($MILLION)
TABLE 26.   NORTH AMERICA NEXT-GENERATION FIREWALL MARKET, BY COUNTRY, 2017–2025 ($MILLION)
TABLE 27.   U.S. NEXT-GENERATION FIREWALL MARKET, BY COMPONENT, 2017–2025 ($MILLION)
TABLE 28.   U.S. NEXT-GENERATION FIREWALL MARKET, BY TYPE, 2017–2025 ($MILLION)
TABLE 29.   U.S. NEXT-GENERATION FIREWALL MARKET, BY ORGANIZATION SIZE, 2017–2025 ($MILLION)
TABLE 30.   U.S. NEXT-GENERATION FIREWALL MARKET, BY INDUSTRY VERTICAL, 2017–2025 ($MILLION)
TABLE 31.   CANADA NEXT-GENERATION FIREWALL MARKET, BY COMPONENT, 2017–2025 ($MILLION)
TABLE 32.   CANADA NEXT-GENERATION FIREWALL MARKET, BY TYPE, 2017–2025 ($MILLION)
TABLE 33.   CANADA NEXT-GENERATION FIREWALL MARKET, BY ORGANIZATION SIZE, 2017–2025 ($MILLION)
TABLE 34.   CANADA NEXT-GENERATION FIREWALL MARKET, BY INDUSTRY VERTICAL, 2017–2025 ($MILLION)
TABLE 35.   EUROPE NEXT-GENERATION FIREWALL MARKET, BY COMPONENT, 2017–2025 ($MILLION)
TABLE 36.   EUROPE NEXT-GENERATION FIREWALL MARKET, BY TYPE, 2017–2025 ($MILLION)
TABLE 37.   EUROPE NEXT-GENERATION FIREWALL MARKET, BY ORGANIZATION SIZE, 2017–2025 ($MILLION)
TABLE 38.   EUROPE NEXT-GENERATION FIREWALL MARKET, BY INDUSTRY VERTICAL, 2017–2025 ($MILLION)
TABLE 39.   EUROPE NEXT-GENERATION FIREWALL MARKET, BY COUNTRY, 2017–2025 ($MILLION)
TABLE 40.   UK NEXT-GENERATION FIREWALL MARKET, BY COMPONENT, 2017–2025 ($MILLION)
TABLE 41.   UK NEXT-GENERATION FIREWALL MARKET, BY TYPE, 2017–2025 ($MILLION)
TABLE 42.   UK NEXT-GENERATION FIREWALL MARKET, BY ORGANIZATION SIZE, 2017–2025 ($MILLION)
TABLE 43.   UK NEXT-GENERATION FIREWALL MARKET, BY INDUSTRY VERTICAL, 2017–2025 ($MILLION)
TABLE 44.   GERMANY NEXT-GENERATION FIREWALL MARKET, BY COMPONENT, 2017–2025 ($MILLION)
TABLE 45.   GERMANY NEXT-GENERATION FIREWALL MARKET, BY TYPE, 2017–2025 ($MILLION)
TABLE 46.   GERMANY NEXT-GENERATION FIREWALL MARKET, BY ORGANIZATION SIZE, 2017–2025 ($MILLION)
TABLE 47.   GERMANY NEXT-GENERATION FIREWALL MARKET, BY INDUSTRY VERTICAL, 2017–2025 ($MILLION)
TABLE 48.   FRANCE NEXT-GENERATION FIREWALL MARKET, BY COMPONENT, 2017–2025 ($MILLION)
TABLE 49.   FRANCE NEXT-GENERATION FIREWALL MARKET, BY TYPE, 2017–2025 ($MILLION)
TABLE 50.   FRANCE NEXT-GENERATION FIREWALL MARKET, BY ORGANIZATION SIZE, 2017–2025 ($MILLION)
TABLE 51.   FRANCE NEXT-GENERATION FIREWALL MARKET, BY INDUSTRY VERTICAL, 2017–2025 ($MILLION)
TABLE 52.   ITALY NEXT-GENERATION FIREWALL MARKET, BY COMPONENT, 2017–2025 ($MILLION)
TABLE 53.   ITALY NEXT-GENERATION FIREWALL MARKET, BY TYPE, 2017–2025 ($MILLION)
TABLE 54.   ITALY NEXT-GENERATION FIREWALL MARKET, BY ORGANIZATION SIZE, 2017–2025 ($MILLION)
TABLE 55.   ITALY NEXT-GENERATION FIREWALL MARKET, BY INDUSTRY VERTICAL, 2017–2025 ($MILLION)
TABLE 56.   RUSSIA NEXT-GENERATION FIREWALL MARKET, BY COMPONENT, 2017–2025 ($MILLION)
TABLE 57.   RUSSIA NEXT-GENERATION FIREWALL MARKET, BY TYPE, 2017–2025 ($MILLION)
TABLE 58.   RUSSIA NEXT-GENERATION FIREWALL MARKET, BY ORGANIZATION SIZE, 2017–2025 ($MILLION)
TABLE 59.   RUSSIA NEXT-GENERATION FIREWALL MARKET, BY INDUSTRY VERTICAL, 2017–2025 ($MILLION)
TABLE 60.   REST OF EUROPE NEXT-GENERATION FIREWALL MARKET, BY COMPONENT, 2017–2025 ($MILLION)
TABLE 61.   REST OF EUROPE NEXT-GENERATION FIREWALL MARKET, BY TYPE, 2017–2025 ($MILLION)
TABLE 62.   REST OF EUROPE NEXT-GENERATION FIREWALL MARKET, BY ORGANIZATION SIZE, 2017–2025 ($MILLION)
TABLE 63.   REST OF EUROPE NEXT-GENERATION FIREWALL MARKET, BY INDUSTRY VERTICAL, 2017–2025 ($MILLION)
TABLE 64.   ASIA-PACIFIC NEXT-GENERATION FIREWALL MARKET, BY COMPONENT, 2017–2025 ($MILLION)
TABLE 65.   ASIA-PACIFIC NEXT-GENERATION FIREWALL MARKET, BY TYPE, 2017–2025 ($MILLION)
TABLE 66.   ASIA-PACIFIC NEXT-GENERATION FIREWALL MARKET, BY ORGANIZATION SIZE, 2017–2025 ($MILLION)
TABLE 67.   ASIA-PACIFIC NEXT-GENERATION FIREWALL MARKET, BY INDUSTRY VERTICAL, 2017–2025 ($MILLION)
TABLE 68.   ASIA-PACIFIC NEXT-GENERATION FIREWALL MARKET, BY COUNTRY, 2017–2025 ($MILLION)
TABLE 69.   CHINA NEXT-GENERATION FIREWALL MARKET, BY COMPONENT, 2017–2025 ($MILLION)
TABLE 70.   CHINA NEXT-GENERATION FIREWALL MARKET, BY TYPE, 2017–2025 ($MILLION)
TABLE 71.   CHINA NEXT-GENERATION FIREWALL MARKET, BY ORGANIZATION SIZE, 2017–2025 ($MILLION)
TABLE 72.   CHINA NEXT-GENERATION FIREWALL MARKET, BY INDUSTRY VERTICAL, 2017–2025 ($MILLION)
TABLE 73.   INDIA NEXT-GENERATION FIREWALL MARKET, BY COMPONENT, 2017–2025 ($MILLION)
TABLE 74.   INDIA NEXT-GENERATION FIREWALL MARKET, BY TYPE, 2017–2025 ($MILLION)
TABLE 75.   INDIA NEXT-GENERATION FIREWALL MARKET, BY ORGANIZATION SIZE, 2017–2025 ($MILLION)
TABLE 76.   INDIA NEXT-GENERATION FIREWALL MARKET, BY INDUSTRY VERTICAL, 2017–2025 ($MILLION)
TABLE 77.   JAPAN NEXT-GENERATION FIREWALL MARKET, BY COMPONENT, 2017–2025 ($MILLION)
TABLE 78.   JAPAN NEXT-GENERATION FIREWALL MARKET, BY TYPE, 2017–2025 ($MILLION)
TABLE 79.   JAPAN NEXT-GENERATION FIREWALL MARKET, BY ORGANIZATION SIZE, 2017–2025 ($MILLION)
TABLE 80.   JAPAN NEXT-GENERATION FIREWALL MARKET, BY INDUSTRY VERTICAL, 2017–2025 ($MILLION)
TABLE 81.   AUSTRALIA NEXT-GENERATION FIREWALL MARKET, BY COMPONENT, 2017–2025 ($MILLION)
TABLE 82.   AUSTRALIA NEXT-GENERATION FIREWALL MARKET, BY TYPE, 2017–2025 ($MILLION)
TABLE 83.   AUSTRALIA NEXT-GENERATION FIREWALL MARKET, BY ORGANIZATION SIZE, 2017–2025 ($MILLION)
TABLE 84.   AUSTRALIA NEXT-GENERATION FIREWALL MARKET, BY INDUSTRY VERTICAL, 2017–2025 ($MILLION)
TABLE 85.   REST OF ASIA-PACIFIC NEXT-GENERATION FIREWALL MARKET, BY COMPONENT, 2017–2025 ($MILLION)
TABLE 86.   REST OF ASIA-PACIFIC NEXT-GENERATION FIREWALL MARKET, BY TYPE, 2017–2025 ($MILLION)
TABLE 87.   REST OF ASIA-PACIFIC NEXT-GENERATION FIREWALL MARKET, BY ORGANIZATION SIZE, 2017–2025 ($MILLION)
TABLE 88.   REST OF ASIA-PACIFIC NEXT-GENERATION FIREWALL MARKET, BY INDUSTRY VERTICAL, 2017–2025 ($MILLION)
TABLE 89.   LAMEA NEXT-GENERATION FIREWALL MARKET, BY COMPONENT, 2017–2025 ($MILLION)
TABLE 90.   LAMEA NEXT-GENERATION FIREWALL MARKET, BY TYPE, 2017–2025 ($MILLION)
TABLE 91.   LAMEA NEXT-GENERATION FIREWALL MARKET, BY ORGANIZATION SIZE, 2017–2025 ($MILLION)
TABLE 92.   LAMEA NEXT-GENERATION FIREWALL MARKET, BY INDUSTRY VERTICAL, 2017–2025 ($MILLION)
TABLE 93.   LAMEA NEXT-GENERATION FIREWALL MARKET, BY COUNTRY, 2017–2025 ($MILLION)
TABLE 94.   LATIN AMERICA NEXT-GENERATION FIREWALL MARKET, BY COMPONENT, 2017–2025 ($MILLION)
TABLE 95.   CANADA NEXT-GENERATION FIREWALL MARKET, BY TYPE, 2017–2025 ($MILLION)
TABLE 96.   LATIN AMERICA NEXT-GENERATION FIREWALL MARKET, BY ORGANIZATION SIZE, 2017–2025 ($MILLION)
TABLE 97.   LATIN AMERICA NEXT-GENERATION FIREWALL MARKET, BY INDUSTRY VERTICAL, 2017–2025 ($MILLION)
TABLE 98.   MIDDLE EAST NEXT-GENERATION FIREWALL MARKET, BY COMPONENT, 2017–2025 ($MILLION)
TABLE 99.   MIDDLE EAST NEXT-GENERATION FIREWALL MARKET, BY TYPE, 2017–2025 ($MILLION)
TABLE 100.   MIDDLE EAST NEXT-GENERATION FIREWALL MARKET, BY ORGANIZATION SIZE, 2017–2025 ($MILLION)
TABLE 101.   MIDDLE EAST NEXT-GENERATION FIREWALL MARKET, BY INDUSTRY VERTICAL, 2017–2025 ($MILLION)
TABLE 102.   AFRICA NEXT-GENERATION FIREWALL MARKET, BY COMPONENT, 2017–2025 ($MILLION)
TABLE 103.   AFRICA NEXT-GENERATION FIREWALL MARKET, BY TYPE, 2017–2025 ($MILLION)
TABLE 104.   AFRICA NEXT-GENERATION FIREWALL MARKET, BY ORGANIZATION SIZE, 2017–2025 ($MILLION)
TABLE 105.   AFRICA NEXT-GENERATION FIREWALL MARKET, BY INDUSTRY VERTICAL, 2017–2025 ($MILLION)
TABLE 106.   BARRACUDA NETWORKS, INC.: COMPANY SNAPSHOT
TABLE 107.   BARRACUDA NETWORKS, INC.: PRODUCT PORTFOLIO
TABLE 108.   CHECK POINT SOFTWARE TECHNOLOGIES LTD.: COMPANY SNAPSHOT
TABLE 109.   CHECK POINT SOFTWARE TECHNOLOGIES LTD.: PRODUCT PORTFOLIO
TABLE 110.   CISCO SYSTEMS, INC.: COMPANY SNAPSHOT
TABLE 111.   CISCO SYSTEMS, INC.: OPERATING SEGMENTS
TABLE 112.   CISCO SYSTEMS, INC.: PRODUCT PORTFOLIO
TABLE 113.   FORCEPOINT LLC: COMPANY SNAPSHOT
TABLE 114.   FORCEPOINT LLC: PRODUCT PORTFOLIO
TABLE 115.   FORTINET, INC.: COMPANY SNAPSHOT
TABLE 116.   FORTINET, INC.: PRODUCT PORTFOLIO
TABLE 117.   HUAWEI TECHNOLOGIES CO., LTD.: COMPANY SNAPSHOT
TABLE 118.   HUAWEI TECHNOLOGIES CO., LTD.: OPERATING SEGMENTS
TABLE 119.   HUAWEI TECHNOLOGIES CO., LTD.., LTD.: PRODUCT PORTFOLIO
TABLE 120.   JUNIPER NETWORKS, INC.: COMPANY SNAPSHOT
TABLE 121.   JUNIPER NETWORKS, INC.: PRODUCT PORTFOLIO
TABLE 122.   PALO ALTO NETWORKS, INC.: COMPANY SNAPSHOT
TABLE 123.   PALO ALTO NETWORKS, INC.: PRODUCT PORTFOLIO
TABLE 124.   SONICWALL INC.: COMPANY SNAPSHOT
TABLE 125.   SONICWALL INC.: PRODUCT PORTFOLIO
TABLE 126.   SOPHOS LTD.: COMPANY SNAPSHOT
TABLE 127.   SOPHOS LTD.: PRODUCT PORTFOLIO
LIST OF FIGURES
FIGURE 01.   KEY MARKET SEGMENTS
FIGURE 02.   GLOBAL NEXT-GENERATION FIREWALL MARKET, 2017–2025
FIGURE 03.   NEXT-GENERATION FIREWALL MARKET, BY REGION, 2017–2025
FIGURE 04.   GLOBAL NEXT-GENERATION FIREWALL MARKET: KEY PLAYERS
FIGURE 05.   TOP IMPACTING FACTORS
FIGURE 06.   TOP INVESTMENT POCKETS
FIGURE 07.   GLOBAL NEXT-GENERATION FIREWALL MARKET REVENUE, BY COMPONENT, 2017–2025 ($MILLION)
FIGURE 08.   COMPARATIVE SHARE ANALYSIS OF NEXT-GENERATION FIREWALL MARKET FOR SOLUTION, BY COUNTRY, 2017 & 2025(%)
FIGURE 09.   COMPARATIVE SHARE ANALYSIS OF NEXT-GENERATION FIREWALL MARKET FOR SERVICE, BY COUNTRY, 2017 & 2025(%)
FIGURE 10.   GLOBAL NEXT-GENERATION FIREWALL MARKET REVENUE, BY TYPE, 2017–2025($MILLION)
FIGURE 11.   COMPARATIVE SHARE ANALYSIS OF NEXT-GENERATION FIREWALL MARKET FOR HARDWARE, BY COUNTRY, 2017 & 2025(%)
FIGURE 12.   COMPARATIVE SHARE ANALYSIS OF NEXT-GENERATION FIREWALL MARKET FOR VIRTUAL FIREWALLS, BY COUNTRY, 2017 & 2025(%)
FIGURE 13.   COMPARATIVE SHARE ANALYSIS OF NEXT-GENERATION FIREWALL MARKET FOR CLOUD-BASED FIREWALLS, BY COUNTRY, 2017 & 2025(%)
FIGURE 14.   GLOBAL NEXT-GENERATION FIREWALL MARKET REVENUE, BY ORGANIZATION SIZE, 2017–2025($MILLION)
FIGURE 15.   COMPARATIVE SHARE ANALYSIS OF NEXT-GENERATION FIREWALL MARKET FOR LARGE ENTERPRISES, BY COUNTRY, 2017 & 2025(%)
FIGURE 16.   COMPARATIVE SHARE ANALYSIS OF NEXT-GENERATION FIREWALL MARKET FOR SMES, BY COUNTRY, 2017 & 2025(%)
FIGURE 17.   GLOBAL NEXT-GENERATION FIREWALL MARKET REVENUE, BY INDUSTRY VERTICAL, 2017–2025($MILLION)
FIGURE 18.   COMPARATIVE SHARE ANALYSIS OF NEXT-GENERATION FIREWALL MARKET FOR AEROSPACE & DEFENSE, BY COUNTRY, 2017 & 2025(%)
FIGURE 19.   COMPARATIVE SHARE ANALYSIS OF NEXT-GENERATION FIREWALL MARKET FOR BFSI, BY COUNTRY, 2017 & 2025(%)
FIGURE 20.   COMPARATIVE SHARE ANALYSIS OF NEXT-GENERATION FIREWALL MARKET FOR ENERGY & UTILITIES, BY COUNTRY, 2017 & 2025(%)
FIGURE 21.   COMPARATIVE SHARE ANALYSIS OF NEXT-GENERATION FIREWALL MARKET FOR PUBLIC SECTOR, BY COUNTRY, 2017 & 2025(%)
FIGURE 22.   COMPARATIVE SHARE ANALYSIS OF NEXT-GENERATION FIREWALL MARKET FOR HEALTHCARE, BY COUNTRY, 2017 & 2025(%)
FIGURE 23.   COMPARATIVE SHARE ANALYSIS OF NEXT-GENERATION FIREWALL MARKET FOR IT & TELECOM, BY COUNTRY, 2017 & 2025(%)
FIGURE 24.   COMPARATIVE SHARE ANALYSIS OF NEXT-GENERATION FIREWALL MARKET FOR MANUFACTURING, BY COUNTRY, 2017 & 2025(%)
FIGURE 25.   COMPARATIVE SHARE ANALYSIS OF NEXT-GENERATION FIREWALL MARKET FOR RETAIL, BY COUNTRY, 2017 & 2025(%)
FIGURE 26.   COMPARATIVE SHARE ANALYSIS OF NEXT-GENERATION FIREWALL MARKET FOR OTHERS, BY COUNTRY, 2017 & 2025(%)
FIGURE 27.   U.S. NEXT-GENERATION FIREWALL MARKET, 2017–2025 ($MILLION)
FIGURE 28.   CANADA NEXT-GENERATION FIREWALL MARKET, 2017–2025 ($MILLION)
FIGURE 29.   UK NEXT-GENERATION FIREWALL MARKET, 2017–2025 ($MILLION)
FIGURE 30.   GERMANY NEXT-GENERATION FIREWALL MARKET, 2017–2025 ($MILLION)
FIGURE 31.   FRANCE NEXT-GENERATION FIREWALL MARKET, 2017–2025 ($MILLION)
FIGURE 32.   ITALY NEXT-GENERATION FIREWALL MARKET, 2017–2025 ($MILLION)
FIGURE 33.   RUSSIA NEXT-GENERATION FIREWALL MARKET, 2017–2025 ($MILLION)
FIGURE 34.   REST OF EUROPE NEXT-GENERATION FIREWALL MARKET, 2017–2025 ($MILLION)
FIGURE 35.   CHINA NEXT-GENERATION FIREWALL MARKET, 2017–2025 ($MILLION)
FIGURE 36.   INDIA NEXT-GENERATION FIREWALL MARKET, 2017–2025 ($MILLION)
FIGURE 37.   JAPAN NEXT-GENERATION FIREWALL MARKET, 2017–2025 ($MILLION)
FIGURE 38.   AUSTRALIA NEXT-GENERATION FIREWALL MARKET, 2017–2025 ($MILLION)
FIGURE 39.   REST OF ASIA-PACIFIC NEXT-GENERATION FIREWALL MARKET, 2017–2025 ($MILLION)
FIGURE 40.   LATIN AMERICA NEXT-GENERATION FIREWALL MARKET, 2017–2025 ($MILLION)
FIGURE 41.   MIDDLE EAST NEXT-GENERATION FIREWALL MARKET, 2017–2025 ($MILLION)
FIGURE 42.   AFRICA NEXT-GENERATION FIREWALL MARKET, 2017–2025 ($MILLION)
FIGURE 43.   MARKET PLAYER POSITIONING, 2017
FIGURE 44.   TOP WTOP WINNING STRATEGIES, BY YEAR, 2015–2019*
FIGURE 45.   TOP WINNING STRATEGIES, BY DEVELOPMENT, 2015–2019* (%)
FIGURE 46.   TOP WINNING STRATEGIES, BY COMPANY, 2015–2018
FIGURE 47.   KEY EXECUTIVES
FIGURE 48.   CHECK POINT SOFTWARE TECHNOLOGIES LTD.: KEY EXECUTIVES
FIGURE 49.   R&D EXPENDITURE, 2016–2018 ($MILLION)
FIGURE 50.   CHECK POINT SOFTWARE TECHNOLOGIES LTD.: REVENUE, 2016–2018 ($MILLION)
FIGURE 51.   CHECK POINT SOFTWARE TECHNOLOGIES LTD.: REVENUE SHARE BY REGION, 2018 (%)
FIGURE 52.   CISCO SYSTEMS, INC.: KEY EXECUTIVES
FIGURE 53.   CISCO SYSTEMS, INC.: REVENUE, 2015–2017 ($MILLION)
FIGURE 54.   CISCO SYSTEMS, INC.: REVENUE SHARE BY SEGMENT, 2018 (%)
FIGURE 55.   CISCO SYSTEMS, INC.: REVENUE SHARE BY REGION, 2018 (%)
FIGURE 56.   FORCEPOINT LLC; KEY EXECUTIVES
FIGURE 57.   FORTINET, INC.: KEY EXECUTIVES
FIGURE 58.   R&D EXPENDITURE, 2016–2017 ($MILLION)
FIGURE 59.   FORTINET, INC.: REVENUE, 2016–2018 ($MILLION)
FIGURE 60.   FORTINET, INC.: REVENUE SHARE BY REGION, 2018 (%)
FIGURE 61.   HUAWEI TECHNOLOGIES CO., LTD.: KEY EXECUTIVES
FIGURE 62.   R&D EXPENDITURE, 2016–2018 ($MILLION)
FIGURE 63.   HUAWEI TECHNOLOGIES CO., LTD.., LTD.: REVENUE, 2016–2018 ($MILLION)
FIGURE 64.   HUAWEI TECHNOLOGIES CO., LTD., LTD.: REVENUE SHARE BY SEGMENT, 2018 (%)
FIGURE 65.   HUAWEI TECHNOLOGIES CO., LTD., LTD.: REVENUE SHARE BY REGION, 2018 (%)
FIGURE 66.   JUNIPER NETWORKS, INC.: KEY EXECUTIVES
FIGURE 67.   R&D EXPENDITURE, 2016–2018 ($MILLION)
FIGURE 68.   JUNIPER NETWORKS, INC.: REVENUE, 2016–2018 ($MILLION)
FIGURE 69.   JUNIPER NETWORKS, INC.: REVENUE SHARE BY REGION, 2018 (%)
FIGURE 70.   PALO ALTO NETWORKS, INC.: KEY EXECUTIVES
FIGURE 71.   R&D EXPENDITURE, 2016–2018 ($MILLION)
FIGURE 72.   PALO ALTO NETWORKS, INC.: REVENUE, 2016–2018 ($MILLION)
FIGURE 73.   PALO ALTO NETWORKS, INC.: REVENUE SHARE BY REGION, 2018 (%)
FIGURE 74.   SONICWALL INC.: KEY EXECUTIVES
FIGURE 75.   SOPHOS LTD.: KEY EXECUTIVES
FIGURE 76.   R&D EXPENDITURE, 2016–2018 ($MILLION)
FIGURE 77.   SOPHOS LTD.: REVENUE, 2016–2018 ($MILLION)
FIGURE 78.   SOPHOS LTD.: REVENUE SHARE BY REGION, 2018 (%)
A next-generation firewall (NGFW) is the third-generation firewall technology, which offers a deep-packet inspection function by inspecting the data carried in network packets. The adoption of NGFW has increased in the recent years, owing to rise in need of handling data breaches and other cyber threats. According to the CXOs of the leading companies, the firewall technology is a crucial component of organizations’ cyber security ecosystem, and a series of developments are continuing in the industry. The growth of IoT-based complex threat landscape and stringent cyber security regulations fuel the demand for next-generation firewall technology for deep inspection and threat blocking. In addition, surge in adoption of firewall as a service and increase in cyber security spending are expected to have a significant impact on the market during the forecast period. However, lack of cyber security professionals and performance issues associated with these solutions in cloud protection are the factors that majorly hinder the growth of the market.
Â
The NGFW market is consolidated with the presence of key vendors such as Palo Alto Networks, Juniper Networks, Checkpoint, and others that constitute large market share. North America and Europe are the prime consumers of NGFW solutions. However, Asia-Pacific is expected to experience significant growth in the near future, owing to increase in IoT landscape, development of smart cities, and rise in in cyber security spending in the developing countries such as China, South Korea, India, Japan, and more. Some of the key players profiled in the report include Barracuda Networks, Check Point, Cisco, Forcepoint, Fortinet, Huawei, Juniper Networks, Palo Alto Networks, SonicWall, and Sophos. These players have adopted various strategies to increase their market penetration and strengthen their position in the industry. For instance, Fortinet launched new intent-based NGFWs in February 2019, which doesn’t rely on a single enforcement point and provide a robust security architecture. The new offerings result in granular access control, end-to-end visibility, continuous trust assessment, and automated threat protection, which helps organizations to secure their organizations through segmentation of its IT assets.
Start reading instantly.
This Report and over 66,905+ more Reports, Available with Avenue Library. T&C*.
Enterprise
License/PDF
Library
Membership
*Taxes/Fees, if applicable will be added during checkout. All prices in USD
To ensure high-level data integrity, accurate analysis, and impeccable forecasts
For complete satisfaction
On-demand customization of scope of the report to exactly meet your needs
Targeted market view to provide pertinent information and save time of readers
Get insights on topics that are crucial for your business. Stay abreast of your interest areas.
Get Industry Data AlertsTo ensure high-level data integrity, accurate analysis, and impeccable forecasts
For complete satisfaction
On-demand customization of scope of the report to exactly meet your needs
Targeted market view to provide pertinent information and save time of readers