Report Code: A11863 | Jun 2021 | Pages: 250 | ||
Tables: 112 | Charts: 66 |
|
Pandemic disrupted the entire world and affected many industries.
Get detailed COVID-19 impact analysis on the Next-generation Industrial Metrology And Inspection Market
Request Now !
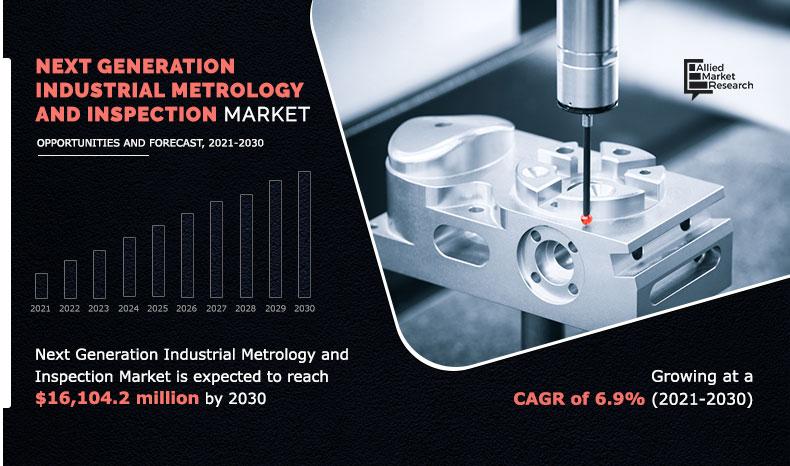
The next-generation industrial metrology and inspection market size is expected to reach $16,104.2 million by 2030, from $8,125.0 million in 2020, registering a CAGR of 6.9% from 2021 to 2030. Industrial metrology is a concept used in production and manufacturing sector to check dimensional conformity, quality control, and all methods to obtain measurement. Industrial metrology is compulsory implemented by the company to check whether validity of production, and confirm the products quality. Industrial metrology used to improve the product life cycle in appropriate manner.
The COVID-19 outbreak had a mixed effect on the growth of the next generation industrial metrology and inspection market as the lockdown during the COVID-19 has enabled wide adoption of newer technologies to allow projects to continue in a virtual and digital environment even when participants were unable to meet in person. The pandemic has forced to find safer and smarter ways for operating smoothly and effectively in manufacturing industries. On the other hand, the market was hampered owing to limited manufacturing activities carried out due to lockdown.
Increase in global R&D spending on developing and launching new metrology products and solutions offers business opportunities to measurement companies. Nikon Corp, FARO Technologies, Hexagon AB, and Carl Zeiss AB are spending on R&D activities on industrial metrology products and services, as observed from annual reports published by these companies. All these companies have spent 10% on their research and development activities. In addition, rise in adoption of big data analytics in industrial applications, owing to generate and operate large volume of data in appropriate manner.
Major players such as ACCRETECH, Innovalia Metrology Systems and Solutions, and others are offering platform-as-a-service for manufacturing industry. For instance, ACCRETECH offered platform-as-a service. It is engaged in offering services such as specialized contract measurement, training, addition & updates, calibration, repair and maintenance, and installation services for industrial metrology products.
A rise in demand for coordinate measuring machine, owing to features such as high accuracy, 3D model, flexible, and scalable. Coordinate measuring machine is machine form an integral part of manufacturing processes, and used for quality assurance during manufacturing activities such as aerospace, defense, plastic & rubber, medical devices, and machine manufacturing sectors. The global growth in automation and smart manufacturing drives the demand for coordinate measuring machine (CMM). In addition, rise in spending on R&D in manufacturing industries fuels the next-generation industrial metrology and inspection market growth in France. For instance, the spending on R&S in France grew by 4.5% from 2018 to 2019.
Hence, the advantage of bolstered productivity in manufacturing industries drives the growth of next-generation industrial metrology and inspection market. High investment for setting up for metrological systems and increased security threats while using internet-enabled devices in industrial application is anticipated to restrain the growth of the market. Data-driven decision-making at the planning stage of construction projects is likely to anticipate better management of resources; thereby, improving project efficiency. However, adoption of cloud-based services to integrate large amount of data is anticipated to provide lucrative opportunities for market growth.
The next-generation industrial metrology and inspection market is segmented on the basis of offering, equipment, application, and region. Based on offering, the market is divided into hardware, software, and services. The hardware segment dominated the market in 2020. By equipment, the market is divided into coordinate measuring machine, measuring instruments, optical digitizer and scanner, and others.
Coordinate measuring machine (CMM) generated the highest revenue in 2020. Based on application, the market is divided into automotive and transportation, aerospace and defense, semiconductor & electronics, industrial machinery, and others. The automotive & transportation segment generated the highest revenue in 2020.
Region wise, the next-generation industrial metrology and inspection market analysis is conducted across North America (the U.S., Canada, and Mexico), Europe (Germany, the UK, Italy, France, and rest of Europe), Asia-Pacific (China, India, Japan, Australia, and rest of Asia-Pacific), and LAMEA (Latin America, the Middle East, and Africa). In 2020, North America was the highest contributor to the next-generation industrial metrology and inspection market share.
The key players profiled in the next-generation industrial metrology and inspection industry report include Hexagon AB, Renishaw PLC, Carl Zeiss AG, FARO Technologies, Jenoptik AG, Automated Precision Inc, KLA Corporation, Applied Materials Inc, Nikon Metrology, and Trimet Group.
Major players are adopting acquisition, products launch, and business expansion as key developmental strategy to improve the product portfolio of digital manufacturing products. For instance, in October 2020, Nikon Corporation launched a new APDIS laser radar inspection system from Nikon metrology as its twice as other inspection system. It maintains accuracy and precision control.
Key Benefits For Stakeholders
Key Market Segments
By Offering
By Equipment
By Application
By Region
Key Players
Next-Generation Industrial Metrology and Inspection Market Report Highlights
Aspects | Details |
---|---|
By Offering |
|
By Equipment |
|
By Application |
|
By Region |
|
Key Market Players | AUTOMATED PRECISION, INC., FARO TECHNOLOGIES, INC., .NIKON CORPORATION, CARL ZEISS AG, KLA CORPORATION, JENOPTIK AG, RENISHAW PLC, TRIMET GROUP, APPLIED METROLOGY SERVICES (PTY) LTD, HEXAGON AB |
CHAPTER 1:INTRODUCTION
1.1.Report description
1.2.Key benefits for stakeholders
1.3.Key market segments
1.4.Research methodology
1.4.1.Primary research
1.4.2.Secondary research
1.4.3.Analyst tools and models
CHAPTER 2:EXECUTIVE SUMMARY
2.1.Key findings of the study
2.2.CXO perspective
CHAPTER 3:MARKET OVERVIEW
3.1.Market definition and scope
3.2.Key findings
3.2.1.Top investment pockets
3.2.2.Top winning strategies
3.3.Market player positioning, 2020
3.4.Porter's five forces analysis
3.5.Market dynamics
3.5.1.Drivers
3.5.1.1.Rise in demand for big data analytics
3.5.1.2.Increased R&D spending on industrial metrology
3.5.1.3.Increase in adoption of industrial metrology in quality control and inspection applications.
3.5.2.Restraint
3.5.2.1.Increased security threats in connected devices
3.5.2.2.High investment for setting up for metrological systems
3.5.3.Opportunity
3.5.3.1.Adoption of cloud-based services to integrate metrological data
3.6.COVID-19 Impact Analysis
CHAPTER 4:NEXT-GENERATION INDUSTRIAL METROLOGY AND INSPECTION MARKET, BY OFFERING
4.1.Overview
4.1.1.Market size and forecast, by offering
4.2.Hardware
4.2.1.Key market trends, growth factors, and opportunities
4.2.2.Market size and forecast, by region
4.2.3.Market size and forecast, by type
4.2.4.Market size and forecast, by country
4.3.Software
4.3.1.Key market trends, growth factors, and opportunities
4.3.2.Market size and forecast, by region
4.3.3.Market size and forecast, by type
4.3.4.Market size and forecast, by country
4.4.Services
4.4.1.Key market trends, growth factors, and opportunities
4.4.2.Market size and forecast, by region
4.4.3.Market size and forecast, by type
4.4.4.Market size and forecast, by country
CHAPTER 5:NEXT-GENERATION INDUSTRIAL METROLOGY AND INSPECTION MARKET, BY EQUIPMENT
5.1.Overview
5.1.1.Market size and forecast, by equipment
5.2.Coordinate measuring machine
5.2.1.Key market trends, growth factors, and opportunities
5.2.2.Market size and forecast, by region
5.2.3.Market size and forecast, by country
5.3.Measuring instruments
5.3.1.Key market trends, growth factors, and opportunities
5.3.2.Market size and forecast, by region
5.3.3.Market size and forecast, by country
5.4.Optical digitizer and scanner (ODS)
5.4.1.Key market trends, growth factors, and opportunities
5.4.2.Market size and forecast, by region
5.4.3.Market size and forecast, by country
5.5.Others
5.5.1.Key market trends, growth factors, and opportunities
5.5.2.Market size and forecast, by region
5.5.3.Market size and forecast, by country
CHAPTER 6:NEXT-GENERATION INDUSTRIAL METROLOGY AND INSPECTION MARKET, BY APPLICATION
6.1.Overview
6.1.1.Market size and forecast, by application
6.2.Automotive & transportation
6.2.1.Key market trends, growth factors, and opportunities
6.2.2.Market size and forecast, by region
6.2.3.Market size and forecast, by equipment
6.2.4.Market size and forecast, by country
6.3.Aerospace & defense
6.3.1.Key market trends, growth factors, and opportunities
6.3.2.Market size and forecast, by region
6.3.3.Market size and forecast, by equipment
6.3.4.Market size and forecast, by country
6.4.Semiconductor & electronics
6.4.1.Key market trends, growth factors, and opportunities
6.4.2.Market size and forecast, by region
6.4.3.Market size and forecast, by equipment
6.4.4.Market size and forecast, by country
6.5.Industrial machinery
6.5.1.Key market trends, growth factors, and opportunities
6.5.2.Market size and forecast, by region
6.5.3.Market size and forecast, by equipment
6.5.4.Market size and forecast, by country
6.6.Others
6.6.1.Key market trends, growth factors, and opportunities
6.6.2.Market size and forecast, by region
6.6.3.Market size and forecast, by equipment
6.6.4.Market size and forecast, by country
CHAPTER 7:NEXT-GENERATION INDUSTRIAL METROLOGY AND INSPECTION MARKET, BY REGION
7.1.Market overview
7.1.1.Market size and forecast, by region
7.2.North America
7.2.1.Key market trends, growth factors, and opportunities
7.2.2.North America market size and forecast, by offering
7.2.2.1.North America market size and forecast, by hardware
7.2.2.2.North America market size and forecast, by software
7.2.2.3.North America market size and forecast, by services
7.2.3.North America market size and forecast, by equipment
7.2.4.North America market size and forecast, by application
7.2.5.North America market size and forecast, by country
7.2.5.1.U.S.
7.2.5.1.1.U.S. market size and forecast, by offering
7.2.5.1.2.U.S. market size and forecast, by equipment
7.2.5.1.3.U.S. market size and forecast, by application
7.2.5.2.Canada
7.2.5.2.1.Canada market size and forecast, by offering
7.2.5.2.2.Canada market size and forecast, by equipment
7.2.5.2.3.Canada market size and forecast, by application
7.2.5.3.Mexico
7.2.5.3.1.Mexico market size and forecast, by offering
7.2.5.3.2.Mexico market size and forecast, by equipment
7.2.5.3.3.Mexico market size and forecast, by application
7.3.Europe
7.3.1.Key market trends, growth factors, and opportunities
7.3.2.Europe market size and forecast, by offering
7.3.2.1.Europe market size and forecast, by hardware
7.3.2.2.Europe market size and forecast, by software
7.3.2.3.Europe market size and forecast, by services
7.3.3.Europe market size and forecast, by equipment
7.3.4.Europe market size and forecast, by application
7.3.5.Europe market size and forecast, by country
7.3.5.1.Germany
7.3.5.1.1.Germany market size and forecast, by offering
7.3.5.1.2.Germany market size and forecast, by equipment
7.3.5.1.3.Germany market size and forecast, by application
7.3.5.2.UK
7.3.5.2.1.UK market size and forecast, by offering
7.3.5.2.2.UK market size and forecast, by equipment
7.3.5.2.3.UK market size and forecast, by application
7.3.5.3.France
7.3.5.3.1.France market size and forecast, by offering
7.3.5.3.2.France market size and forecast, by equipment
7.3.5.3.3.France market size and forecast, by application
7.3.5.4.Italy
7.3.5.4.1.Italy market size and forecast, by offering
7.3.5.4.2.Italy market size and forecast, by equipment
7.3.5.4.3.Italy market size and forecast, by application
7.3.5.5.Rest of Europe
7.3.5.5.1.Rest of Europe market size and forecast, by offering
7.3.5.5.2.Rest of Europe market size and forecast, by equipment
7.3.5.5.3.Rest of Europe market size and forecast, by application
7.4.Asia-Pacific
7.4.1.Key market trends, growth factors, and opportunities
7.4.2.Asia-Pacific market size and forecast, by offering
7.4.2.1.Asia-Pacific market size and forecast, by hardware
7.4.2.2.Asia-Pacific market size and forecast, by software
7.4.2.3.Asia-Pacific market size and forecast, by services
7.4.3.Asia-Pacific market size and forecast, by equipment
7.4.4.Asia-Pacific market size and forecast, by application
7.4.5.Asia-Pacific market size and forecast, by country
7.4.5.1.China
7.4.5.1.1.China market size and forecast, by offering
7.4.5.1.2.China market size and forecast, by equipment
7.4.5.1.3.China market size and forecast, by application
7.4.5.2.India
7.4.5.2.1.India market size and forecast, by offering
7.4.5.2.2.India market size and forecast, by equipment
7.4.5.2.3.India market size and forecast, by application
7.4.5.3.Japan
7.4.5.3.1.Japan market size and forecast, by offering
7.4.5.3.2.Japan market size and forecast, by equipment
7.4.5.3.3.Japan market size and forecast, by application
7.4.5.4.Australia
7.4.5.4.1.Australia market size and forecast, by offering
7.4.5.4.2.Australia market size and forecast, by equipment
7.4.5.4.3.Australia market size and forecast, by application
7.4.5.5.Rest of Asia-Pacific
7.4.5.5.1.Rest of Asia-Pacific market size and forecast, by offering
7.4.5.5.2.Rest of Asia-Pacific market size and forecast, by equipment
7.4.5.5.3.Rest of Asia-Pacific market size and forecast, by application
7.5.LAMEA
7.5.1.Key market trends, growth factors, and opportunities
7.5.2.LAMEA market size and forecast, by component
7.5.2.1.LAMEA market size and forecast, by hardware
7.5.2.2.LAMEA market size and forecast, by software
7.5.2.3.LAMEA market size and forecast, by services
7.5.3.LAMEA market size and forecast, by equipment
7.5.4.LAMEA market size and forecast, by application
7.5.5.LAMEA market size and forecast, by country
7.5.6.Latin America
7.5.6.1.1.Latin America market size and forecast, by component
7.5.6.1.2.Latin America market size and forecast, by equipment
7.5.6.1.3.Latin America market size and forecast, by application
7.5.6.2.Middle East
7.5.6.2.1.Middle East market size and forecast, by component
7.5.6.2.2.Middle East market size and forecast, by equipment
7.5.6.2.3.Middle East market size and forecast, by application
7.5.6.3.Africa
7.5.6.3.1.Africa market size and forecast, by component
7.5.6.3.2.Africa market size and forecast, by equipment
7.5.6.3.3.Africa market size and forecast, by application
CHAPTER 8:COMPANY PROFILES
8.1.APPLIED METROLOGY SERVICES (PTY) LTD
8.1.1.Company overview
8.1.2.Key executives
8.1.3.Company snapshot
8.1.4.Product portfolio
8.2.AUTOMATED PRECISION, INC.
8.2.1.Company overview
8.2.2.Key executives
8.2.3.Company snapshot
8.2.4.Product portfolio
8.3.CARL ZEISS AG
8.3.1.Company overview
8.3.2.Key executives
8.3.3.Company snapshot
8.3.4.Product portfolio
8.3.5.Research and development expenses
8.3.6.Business performance
8.3.7.Key strategic moves and developments
8.4.FARO TECHNOLOGIES, INC.
8.4.1.Company overview
8.4.2.Key executives
8.4.3.Company snapshot
8.4.4.Product portfolio
8.4.5.Research and development expenses
8.4.6.Business performance
8.5.HEXAGON AB
8.5.1.Company overview
8.5.2.Key executives
8.5.3.Company snapshot
8.1.1.Operating business segments
8.5.4.Product portfolio
8.5.5.Research and development expenses
8.5.6.Business performance
8.6.JENOPTIK AG
8.6.1.Company overview
8.6.2.Key executives
8.6.3.Company snapshot
8.1.2.Operating business segments
8.6.4.Product portfolio
8.6.5.Research and development expenses
8.6.6.Business performance
8.7.KLA CORPORATION
8.7.1.Company overview
8.7.2.Key executives
8.7.3.Company snapshot
8.1.3.Operating business segments
8.7.4.Product portfolio
8.7.5.Research and development expenses
8.7.6.Business performance
8.8.NIKON CORPORATION
8.8.1.Company overview
8.8.2.Key executives
8.8.3.Company snapshot
8.1.4.Operating business segments
8.8.4.Product portfolio
8.8.5.Key strategic moves and developments
8.9.RENISHAW PLC
8.9.1.Company overview
8.9.2.Key executives
8.9.3.Company snapshot
8.9.4.Product portfolio
8.9.5.Research and development expenses
8.9.6.Business performance
8.10.TRIMET GROUP
8.10.1.Company overview
8.10.2.Key executives
8.10.3.Company snapshot
8.10.4.Product portfolio
8.10.5.Key strategic moves and developments
LIST OF TABLES
TABLE 01.NEXT-GENERATION INDUSTRIAL METROLOGY AND INSPECTION MARKET REVENUE, BY OFFERING, 2020–2030 ($MILLION)
TABLE 02.NEXT-GENERATION INDUSTRIAL METROLOGY AND INSPECTION MARKET REVENUE FOR HARDWARE, BY REGION, 2020–2030 ($MILLION)
TABLE 03.NEXT-GENERATION INDUSTRIAL METROLOGY AND INSPECTION MARKET REVENUE FOR HARDWARE, BY TYPE, 2020–2030 ($MILLION)
TABLE 04.NEXT-GENERATION INDUSTRIAL METROLOGY AND INSPECTION MARKET REVENUE FOR SOFTWARE, BY REGION, 2020–2030 ($MILLION)
TABLE 05.NEXT-GENERATION INDUSTRIAL METROLOGY AND INSPECTION MARKET REVENUE FOR SOFTWARE, BY TYPE, 2020–2030 ($MILLION)
TABLE 06.NEXT-GENERATION INDUSTRIAL METROLOGY AND INSPECTION MARKET REVENUE FOR SERVICES, BY REGION, 2020–2030 ($MILLION)
TABLE 07.NEXT-GENERATION INDUSTRIAL METROLOGY AND INSPECTION MARKET REVENUE FOR SERVICES, BY TYPE, 2020–2030 ($MILLION)
TABLE 08.NEXT-GENERATION INDUSTRIAL METROLOGY AND INSPECTION MARKET REVENUE, BY EQUIPMENT, 2020–2030 ($MILLION)
TABLE 09.NEXT-GENERATION INDUTRIAL METROLOGY AND INSPECTION MARKET REVENUE FOR COORDINATE MEASURING MACHINE (CMM), BY REGION, 2020–2030 ($MILLION)
TABLE 10.NEXT-GENERATION INDUSTRIAL METROLOGY AND INSPECTION MARKET REVENUE FOR MEASURING INSTRUMENTS, BY REGION, 2020–2030 ($MILLION)
TABLE 11.NEXT-GENERATION INDUSTRIAL METROLOGY AND INSPECTION MARKET REVENUE FOR OPTICAL DIGITIZER AND SCANNER (ODS), BY REGION, 2020–2030 ($MILLION)
TABLE 12.NEXT-GENERATION INDUSTRIAL METROLOGY AND INSPECTION MARKET REVENUE FOR OTHERS, BY REGION, 2020–2030 ($MILLION)
TABLE 13.NEXT-GENERATION INDUSTRIAL METROLOGY AND INSPECTION MARKET REVENUE, BY APPLICATION, 2020–2030 ($MILLION)
TABLE 14.NEXT-GENERATION INDUSTRIAL METROLOGY AND INSPECTION MARKET REVENUE FOR AUTOMOTIVE AND TRANSPORTATION, BY REGION, 2020–2030 ($MILLION)
TABLE 15.NEXT-GENERATION INDUSTRIAL METROLOGY AND INSPECTION MARKET REVENUE FOR AUTOMOTIVE AND TRANSPORTATION, BY EQUIPMENT, 2020–2030 ($MILLION)
TABLE 16.NEXT-GENERATION INDUSTRIAL METROLOGY AND INSPECTION MARKET REVENUE FOR AEROSPACE AND DEFENSE, BY REGION, 2020–2030 ($MILLION)
TABLE 17.NEXT-GENERATION INDUSTRIAL METROLOGY AND INSPECTION MARKET REVENUE FOR AEROSPACE AND DEFENSE, BY EQUIPMENT, 2020–2030 ($MILLION)
TABLE 18.NEXT-GENERATION INDUSTRIAL METROLOGY AND INSPECTION MARKET REVENUE FOR SEMICONDUCTOR AND ELECTRONICS, BY REGION, 2020–2030 ($MILLION)
TABLE 19.NEXT-GENERATION INDUSTRIAL METROLOGY AND INSPECTION MARKET REVENUE FOR SEMICONDUCTOR AND ELECTRONICS, BY EQUIPMENT, 2020–2030 ($MILLION)
TABLE 20.NEXT-GENERATION INDUSTRIAL METROLOGY AND INSPECTION MARKET REVENUE FOR INDUSTRIAL MACHINERY, BY REGION, 2020–2030 ($MILLION)
TABLE 21.NEXT-GENERATION INDUSTRIAL METROLOGY AND INSPECTION MARKET REVENUE FOR INDUSTRIAL MACHINERY, BY EQUIPMENT, 2020–2030 ($MILLION)
TABLE 22.NEXT-GENERATION INDUSTRIAL METROLOGY AND INSPECTION MARKET REVENUE FOR OTHERS, BY REGION, 2020–2030 ($MILLION)
TABLE 23.NEXT-GENERATION INDUSTRIAL METROLOGY AND INSPECTION MARKET REVENUE FOR OTHERS, BY EQUIPMENT, 2020–2030 ($MILLION)
TABLE 24.NEXT-GENERATION INDUSTRIAL METROLGOY AND INSPECTION MARKET, BY REGION, 2020–2030 ($MILLION)
TABLE 25.NORTH AMERICA NEXT-GENERATION INDUSTRIAL METROLOGY AND INSPECTION MARKET, BY OFFERING, 2020–2030 ($MILLION)
TABLE 26.NORTH AMERICA NEXT-GENERATION INDUSTRIAL METROLOGY AND INSPECTION MARKET, BY HARDWARE, 2020–2030 ($MILLION)
TABLE 27.NORTH AMERICA NEXT-GENERATION INDUSTRIAL METROLOGY AND INSPECTION MARKET, BY SOFTWARE, 2020–2030 ($MILLION)
TABLE 28.NORTH AMERICA NEXT-GENERATION INDUSTRIAL METROLOGY AND INSPECTION MARKET, BY SERVICES, 2020–2030 ($MILLION)
TABLE 29.NORTH AMERICA NEXT-GENERATION INDUSTRIAL METROLOGY AND INSPECTION MARKET, BY EQUIPMENT, 2020–2030 ($MILLION)
TABLE 30.NORTH AMERICA NEXT-GENERATION INDUSTRIAL METROLOGY AND INSPECTION MARKET, BY APPLICATION, 2020–2030 ($MILLION)
TABLE 31.NORTH AMERICA NEXT-GENERATION INDUSTRIAL METROLOGY AND INSPECTION MARKET, BY COUNTRY, 2020–2030 ($MILLION)
TABLE 32.U.S. NEXT-GENERATION INDUSTRIAL METROLOGY AND INSPECTION MARKET, BY OFFERING, 2020–2030 ($MILLION)
TABLE 33.U.S. NEXT-GENERATION INDUSTRIAL METROLOGY AND INSPECTION MARKET, BY EQUIPMENT, 2020–2030 ($MILLION)
TABLE 34.U.S. NEXT-GENERATION INDUSTRIAL METROLOGY AND INSPECTION MARKET, BY APPLICATION, 2020–2030 ($MILLION)
TABLE 35.CANADA NEXT-GENERATION INDUSTRIAL METROLOGY AND INSPECTION MARKET, BY OFFERING, 2020–2030 ($MILLION)
TABLE 36.CANADA NEXT-GENERATION INDUSTRIAL METROLOGY AND INSPECTION MARKET, BY EQUIPMENT, 2020–2030 ($MILLION)
TABLE 37.CANADA NEXT-GENERATION INDUSTRIAL METROLOGY AND INSPECTION MARKET, BY APPLICATION, 2020–2030 ($MILLION)
TABLE 38.MEXICO NEXT-GENERATION INDUSTRIAL METROLOGY AND INSPECTION MARKET, BY OFFERING, 2020–2030 ($MILLION)
TABLE 39.MEXICO NEXT-GENERATION INDUSTRIAL METROLOGY AND INSPECTION MARKET, BY EQUIPMENT, 2020–2030 ($MILLION)
TABLE 40.MEXICO NEXT-GENERATION INDUSTRIAL METROLOGY AND INSPECTION MARKET, BY APPLICATION, 2020–2030 ($MILLION)
TABLE 41.EUROPE NEXT-GENERATION INDUSTRIAL METROLOGY AND INSPECTION MARKET, BY OFFERING, 2020–2030 ($MILLION)
TABLE 42.EUROPE NEXT-GENERATION INDUSTRIAL METROLOGY AND INSPECTION MARKET, BY HARDWARE, 2020–2030 ($MILLION)
TABLE 43.EUROPE NEXT-GENERATION INDUSTRIAL METROLOGY AND INSPECTION MARKET, BY SOFTWARE, 2020–2030 ($MILLION)
TABLE 44.EUROPE NEXT-GENERATION INDUSTRIAL METROLOGY AND INSPECTION MARKET, BY SERVICES, 2020–2030 ($MILLION)
TABLE 45.EUROPE NEXT-GENERATION INDUSTRIAL METROLOGY AND INSPECTION MARKET, BY EQUIPMENT, 2020–2030 ($MILLION)
TABLE 46.EUROPE NEXT-GENERATION INDUSTRIAL METROLOGY AND INSPECTION MARKET, BY APPLICATION, 2020–2030 ($MILLION)
TABLE 47.EUROPE NEXT-GENERATION INDUSTRIAL METROLOGY AND INSPECTION MARKET, BY COUNTRY, 2020–2030 ($MILLION)
TABLE 48.GERMANY NEXT-GENERATION INDUSTRIAL METROLOGY AND INSPECTION MARKET, BY OFFERING, 2020–2030 ($MILLION)
TABLE 49.GERMANY NEXT-GENERATION INDUSTRIAL METROLOGY AND INSPECTION MARKET, BY EQUIPMENT, 2020–2030 ($MILLION)
TABLE 50.GERMANY NEXT-GENERATION INDUSTRIAL METROLOGY AND INSPECTION MARKET, BY APPLICATION, 2020–2030 ($MILLION)
TABLE 51.UK NEXT-GENERATION INDUSTRIAL METROLOGY AND INSPECTION MARKET, BY OFFERING, 2020–2030 ($MILLION)
TABLE 52.UK NEXT-GENERATION INDUSTRIAL METROLOGY AND INSPECTION MARKET, BY EQUIPMENT, 2020–2030 ($MILLION)
TABLE 53.UK NEXT-GENERATION INDUSTRIAL METROLOGY AND INSPECTION MARKET, BY APPLICATION, 2020–2030 ($MILLION)
TABLE 54.FRANCE NEXT-GENERATION INDUSTRIAL METROLOGY AND INSPECTION MARKET, BY OFFERING, 2020–2030 ($MILLION)
TABLE 55.FRANCE NEXT-GENERATION INDUSTRIAL METROLOGY AND INSPECTION MARKET, BY EQUIPMENT, 2020–2030 ($MILLION)
TABLE 56.FRANCE NEXT-GENERATION INDUSTRIAL METROLOGY AND INSPECTION MARKET, BY APPLICATION, 2020–2030 ($MILLION)
TABLE 57.ITALY NEXT-GENERATION INDUSTRIAL METROLOGY AND INSPECTION MARKET, BY OFFERING, 2020–2030 ($MILLION)
TABLE 58.ITALY NEXT-GENERATION INDUSTRIAL METROLOGY AND INSPECTION MARKET, BY EQUIPMENT, 2020–2030 ($MILLION)
TABLE 59.ITALY NEXT-GENERATION INDUSTRIAL METROLOGY AND INSPECTION MARKET, BY APPLICATION, 2020–2030 ($MILLION)
TABLE 60.REST OF EUROPE NEXT-GENERATION INDUSTRIAL METROLOGY AND INSPECTION MARKET, BY OFFERING, 2020–2030 ($MILLION)
TABLE 61.REST OF EUROPE NEXT-GENERATION INDUSTRIAL METROLOGY AND INSPECTION MARKET, BY EQUIPMENT, 2020–2030 ($MILLION)
TABLE 62.REST OF EUROPE NEXT-GENERATION INDUSTRIAL METROLOGY AND INSPECTION MARKET, BY APPLICATION, 2020–2030 ($MILLION)
TABLE 63.ASIA-PACIFIC NEXT-GENERATION INDUSTRIAL METROLOGY AND INSPECTION MARKET, BY OFFERING, 2020–2030 ($MILLION)
TABLE 64.ASIA-PACIFIC NEXT-GENERATION INDUSTRIAL METROLOGY AND INSPECTION MARKET, BY HARDWARE, 2020–2030 ($MILLION)
TABLE 65.ASIA-PACIFIC NEXT-GENERATION INDUSTRIAL METROLOGY AND INSPECTION MARKET, BY SOFTWARE, 2020–2030 ($MILLION)
TABLE 66.ASIA-PACIFIC NEXT-GENERATION INDUSTRIAL METROLOGY AND INSPECTION MARKET, BY SERVICES, 2020–2030 ($MILLION)
TABLE 67.ASIA-PACIFIC NEXT-GENERATION INDUSTRIAL METROLOGY AND INSPECTION MARKET, BY EQUIPMENT, 2020–2030 ($MILLION)
TABLE 68.ASIA-PACIFIC NEXT-GENERATION INDUSTRIAL METROLOGY AND INSPECTION MARKET, BY APPLICATION, 2020–2030 ($MILLION)
TABLE 69.ASIA-PACIFIC NEXT-GENERATION INDUSTRIAL METROLOGY AND INSPECTION MARKET, BY COUNTRY, 2020–2030 ($MILLION)
TABLE 70.CHINA NEXT-GENERATION INDUSTRIAL METROLOGY AND INSPECTION MARKET, BY OFFERING, 2020–2030 ($MILLION)
TABLE 71.CHINA NEXT-GENERATION INDUSTRIAL METROLOGY AND INSPECTION MARKET, BY EQUIPMENT, 2020–2030 ($MILLION)
TABLE 72.CHINA NEXT-GENERATION INDUSTRIAL METROLOGY AND INSPECTION MARKET, BY APPLICATION, 2020–2030 ($MILLION)
TABLE 73.INDIA NEXT-GENERATION INDUSTRIAL METROLOGY AND INSPECTION MARKET, BY OFFERING, 2020–2030 ($MILLION)
TABLE 74.INDIA NEXT-GENERATION INDUSTRIAL METROLOGY AND INSPECTION MARKET, BY EQUIPMENT, 2020–2030 ($MILLION)
TABLE 75.INDIA NEXT-GENERATION INDUSTRIAL METROLOGY AND INSPECTION MARKET, BY APPLICATION, 2020–2030 ($MILLION)
TABLE 76.JAPAN NEXT-GENERATION INDUSTRIAL METROLOGY AND INSPECTION MARKET, BY OFFERING, 2020–2030 ($MILLION)
TABLE 77.JAPAN NEXT-GENERATION INDUSTRIAL METROLOGY AND INSPECTION MARKET, BY EQUIPMENT, 2020–2030 ($MILLION)
TABLE 78.JAPAN NEXT-GENERATION INDUSTRIAL METROLOGY AND INSPECTION MARKET, BY APPLICATION, 2020–2030 ($MILLION)
TABLE 79.AUSTRALIA NEXT-GENERATION INDUSTRIAL METROLOGY AND INSPECTION MARKET, BY OFFERING, 2020–2030 ($MILLION)
TABLE 80.AUSTRALIA NEXT-GENERATION INDUSTRIAL METROLOGY AND INSPECTION MARKET, BY EQUIPMENT, 2020–2030 ($MILLION)
TABLE 81.AUSTRALIA NEXT-GENERATION INDUSTRIAL METROLOGY AND INSPECTION MARKET, BY APPLICATION, 2020–2030 ($MILLION)
TABLE 82.REST OF ASIA-PACIFIC NEXT-GENERATION INDUSTRIAL METROLOGY AND INSPECTION MARKET, BY OFFERING, 2020–2030 ($MILLION)
TABLE 83.REST OF ASIA-PACIFIC NEXT-GENERATION INDUSTRIAL METROLOGY AND INSPECTION MARKET, BY EQUIPMENT, 2020–2030 ($MILLION)
TABLE 84.REST OF ASIA-PACIFIC NEXT-GENERATION INDUSTRIAL METROLOGY AND INSPECTION MARKET, BY APPLICATION, 2020–2030 ($MILLION)
TABLE 85.LAMEA NEXT-GENERATION INDUSTRIAL METROLOGY AND INSPECTION MARKET, BY COMPONENT, 2020–2030 ($MILLION)
TABLE 86.LAMEA NEXT-GENERATION INDUSTRIAL METROLOGY AND INSPECTION MARKET, BY HARDWARE, 2020–2030 ($MILLION)
TABLE 87.LAMEA NEXT-GENERATION INDUSTRIAL METROLOGY AND INSPECTION MARKET, BY SOFTWARE, 2020–2030 ($MILLION)
TABLE 88.LAMEA NEXT-GENERATION INDUSTRIAL METROLOGY AND INSPECTION MARKET, BY SERVICES, 2020–2030 ($MILLION)
TABLE 89.LAMEA NEXT-GENERATION INDUSTRIAL METROLOGY AND INSPECTION MARKET, BY EQUIPMENT, 2020–2030 ($MILLION)
TABLE 90.LAMEA NEXT-GENERATION INDUSTRIAL METROLOGY AND INSPECTION MARKET, BY APPLICATION, 2020–2030 ($MILLION)
TABLE 91.LAMEA NEXT-GENERATION INDUSTRIAL METROLOGY AND INSPECTION MARKET, BY COUNTRY, 2020–2030 ($MILLION)
TABLE 92.LATIN AMERICA NEXT-GENERATION INDUSTRIAL METROLOGY AND INSPECTION MARKET, BY COMPONENT, 2020–2030 ($MILLION)
TABLE 93.LATIN AMERICA NEXT-GENERATION INDUSTRIAL METROLOGY AND INSPECTION MARKET, BY EQUIPMENT, 2020–2030 ($MILLION)
TABLE 94.LATIN AMERICA NEXT-GENERATION INDUSTRIAL METROLOGY AND INSPECTION MARKET, BY APPLICATION, 2020–2030 ($MILLION)
TABLE 95.MIDDLE EAST NEXT-GENERATION INDUSTRIAL METROLOGY AND INSPECTION MARKET, BY COMPONENT, 2020–2030 ($MILLION)
TABLE 96.MIDDLE EAST NEXT-GENERATION INDUSTRIAL METROLOGY AND INSPECTION MARKET, BY EQUIPMENT, 2020–2030 ($MILLION)
TABLE 97.MIDDLE EAST NEXT-GENERATION INDUSTRIAL METROLOGY AND INSPECTION MARKET, BY APPLICATION, 2020–2030 ($MILLION)
TABLE 98.AFRICA NEXT-GENERATION INDUSTRIAL METROLOGY AND INSPECTION MARKET, BY COMPONENT, 2020–2030 ($MILLION)
TABLE 99.AFRICA NEXT-GENERATION INDUSTRIAL METROLOGY AND INSPECTION MARKET, BY EQUIPMENT, 2020–2030 ($MILLION)
TABLE 100.AFRICA NEXT-GENERATION INDUSTRIAL METROLOGY AND INSPECTION MARKET, BY APPLICATION, 2020–2030 ($MILLION)
TABLE 101.APPLIED METROLOGY SERVICES (PTY LTD): KEY EXECUTIVE
TABLE 102.APPLIED METROLOGY SERVICES: COMPANY SNAPSHOT
TABLE 103.APPLIED METROLOGY SERVICES: PRODUCT PORTFOLIO
TABLE 104.API: KEY EXECUTIVE
TABLE 105.API: COMPANY SNAPSHOT
TABLE 106.API: PRODUCT PORTFOLIO
TABLE 107.CARL ZEISS AG: KEY EXECUTIVE
TABLE 108.CARL ZEISS AG: COMPANY SNAPSHOT
TABLE 109.CARL ZEISS AG: PRODUCT PORTFOLIO
TABLE 110.FARO: KEY EXECUTIVE
TABLE 111.FARO: COMPANY SNAPSHOT
TABLE 112.FARO: PRODUCT PORTFOLIO
TABLE 113.HEXAGON AB: KEY EXECUTIVE
TABLE 114.HEXAGON AB: COMPANY SNAPSHOT
TABLE 115.HEXAGON AB: OPERATING SEGMENTS
TABLE 116.HEXAGON AB: PRODUCT PORTFOLIO
TABLE 117.JENOPTIK AG: KEY EXECUTIVE
TABLE 118.JENOPTIK AG: COMPANY SNAPSHOT
TABLE 119.JENOPTIK AG: OPERATING SEGMENTS
TABLE 120.JENOPTIK AG: PRODUCT PORTFOLIO
TABLE 121.KLA CORPORATION: KEY EXECUTIVE
TABLE 122.KLA CORPORATION: COMPANY SNAPSHOT
TABLE 123.KLA CORPORATION: OPERATING SEGMENTS
TABLE 124.KLA CORPORATION: PRODUCT PORTFOLIO
TABLE 125.NIKON CORPORATION: KEY EXECUTIVE
TABLE 126.NIKON CORPORATION: COMPANY SNAPSHOT
TABLE 127.NIKON CORPORATION: OPERATING SEGMENTS
TABLE 128.NIKON CORPORATION: PRODUCT PORTFOLIO
TABLE 129.RENISHAW PLC: KEY EXECUTIVE
TABLE 130.RENISHAW PLC: COMPANY SNAPSHOT
TABLE 131.RENISHAW PLC: PRODUCT PORTFOLIO
TABLE 132.TRIMET GROUP: KEY EXECUTIVE
TABLE 133.TRIMET GROUP: COMPANY SNAPSHOT
TABLE 134.TRIMET GROUP: PRODUCT PORTFOLIO
LIST OF FIGURES
FIGURE 01.KEY MARKET SEGMENTS
FIGURE 02.EXECUTIVE SUMMARY
FIGURE 03.TOP INVESTMENT POCKETS
FIGURE 04.TOP WINNING STRATEGIES, BY YEAR, 2018–2021
FIGURE 05.TOP WINNING STRATEGIES, BY DEVELOPMENT, 2018–2021 (%)
FIGURE 06.TOP WINNING STRATEGIES, BY COMPANY, 2018–2021
FIGURE 07.MARKET PLAYER POSITIONING, 2020
FIGURE 08.LOW TO MODERATE BARGAINING POWER OF SUPPLIERS
FIGURE 09.MODERATE-TO-HIGH BARGAINING POWER OF BUYERS
FIGURE 10.MODERATE-TO-HIGH THREAT OF SUBSTITUTES
FIGURE 11.MODERATE-TO-HIGH THREAT OF NEW ENTRANTS
FIGURE 12.MODERATE TO HIGH INTENSITY OF RIVALRY
FIGURE 13.NEXT-GENERATION INDUSTRIAL METROLOGY AND INSPECTION MARKET, BY OFFERING, 2020–2030 (%)
FIGURE 14.COMAPARATIVE SHARE ANALYSIS OF NEXT-GENERATION INDUSTRIAL METROLOGY AND INSPECTION MARKET FOR HARDWARE, BY COUNTRY, 2020–2030 (%)
FIGURE 15.COMPARATIVE SHARE ANALYSIS OF NEXT-GENERATION INDUSTRIAL METROLOGY AND INSPECTION MARKET, FOR SOFTWARE, BY COUNTRY, 2020–2030 (%)
FIGURE 16.COMAPARATIVE SHARE ANALYSIS OF NEXT-GENERATION INDUSTRIAL METROLOGY AND INSPECTION MARKET, FOR SERVICES, BY COUNTRY, 2020–2030 (%)
FIGURE 17.NEXT-GENERATION INDUSTRIAL METROLOGY AND INSPECTION MARKET, BY EQUIPMENT, 2020–2030 (%)
FIGURE 18.COMAPARATIVE SHARE ANALYSIS OF NEXT-GENERATION INDUTRIAL METROLOGY AND INSPECTION MARKET REVENUE FOR COORDINATE MEASURING MACHINE (CMM), BY COUNTRY, 2020–2030 (%)
FIGURE 19.COMPARATIVE SHARE ANALYSIS OF NEXT-GENERATION INDUSTRIAL METROLOGY AND INSPECTION MARKET REVENUE FOR MEASURING INSTRUMENTS, BY COUNTRY, 2020–2030 (%)
FIGURE 20.COMAPARATIVE SHARE ANALYSIS OF NEXT-GENERATION INDUSTRIAL METROLOGY AND INSPECTION MARKET FOR OPTICAL DIGITIZER AND SCANNNER, BY COUNTRY, 2020–2030 (%)
FIGURE 21.COMAPARATIVE SHARE ANALYSIS OF NEXT-GENERATION INDUSTRIAL METROLOGY AND INSPECTION MARKET, FOR OTHERS, BY COUNTRY, 2020–2030 (%)
FIGURE 22.NEXT-GENERATION INDUSTRIAL METROLOGY AND INSPECTION MARKET, BY APPLICATION, 2020–2030 (%)
FIGURE 23.COMAPARATIVE SHARE ANALYSIS OF NEXT-GENERATION INDUSTRIAL METROLOGY AND INSPECTION MARKET REVENUE FOR AUTOMOTIVE AND TRANSPORTATION, BY COUNTRY, 2020–2030 (%)
FIGURE 24.COMPARATIVE SHARE ANALYSIS OF NEXT-GENERATION INDUSTRIAL METROLOGY AND INSPECTION MARKET REVENUE FOR AEROSPACE AND DEFENSE, BY COUNTRY, 2020–2030 (%)
FIGURE 25.COMAPARATIVE SHARE ANALYSIS OF NEXT-GENERATION INDUSTRIAL METROLOGY AND INSPECTION MARKET, FOR SEMICONDUCTOR AND ELECTRONICS, BY COUNTRY, 2020–2030 (%)
FIGURE 26.COMAPARATIVE SHARE ANALYSIS OF NEXT-GENERATION INDUSTRIAL METROLOGY AND INSPECTION MARKET, FOR INDUSTRIAL MACHINERY, BY COUNTRY, 2020–2030 (%)
FIGURE 27.COMAPARATIVE SHARE ANALYSIS OF NEXT-GENERATION INDUSTRIAL METROLOGY AND INSPECTION MARKET, FOR OTHERS, BY COUNTRY, 2020–2030 (%)
FIGURE 28.NEXT-GENERATION INDUSTRIAL METROLOGY AND INSPECTION MARKET, BY REGION, 2020–2030
FIGURE 29.U.S. NEXT-GENERATION INDUSTRIAL METROLOGY AND INSPECTION MARKET REVENUE, 2020-2030 ($MILLION)
FIGURE 30.CANADA NEXT-GENERATION INDUSTRIAL METROLOGY AND INSPECTION MARKET REVENUE, 2020-2030 ($MILLION)
FIGURE 31.MEXICO NEXT-GENERATION INDUSTRIAL METROLOGY AND INSPECTION MARKET REVENUE, 2020-2030 ($MILLION)
FIGURE 32.GERMANY NEXT-GENERATION INDUSTRIAL METROLOGY AND INSPECTION MARKET REVENUE, 2020-2030 ($MILLION)
FIGURE 33.UK NEXT-GENERATION INDUSTRIAL METROLOGY AND INSPECTION MARKET REVENUE, 2020-2030 ($MILLION)
FIGURE 34.FRANCE NEXT-GENERATION INDUSTRIAL METROLOGY AND INSPECTION MARKET REVENUE, 2020-2030 ($MILLION)
FIGURE 35.ITALY NEXT-GENERATION INDUSTRIAL METROLOGY AND INSPECTION MARKET REVENUE, 2020-2030 ($MILLION)
FIGURE 36.REST OF EUROPE NEXT-GENERATION INDUSTRIAL METROLOGY AND INSPECTION MARKET REVENUE, 2020-2030 ($MILLION)
FIGURE 37.CHINA NEXT-GENERATION INDUSTRIAL METROLOGY AND INSPECTION MARKET REVENUE, 2020-2030 ($MILLION)
FIGURE 38.INDIA NEXT-GENERATION INDUSTRIAL METROLOGY AND INSPECTION MARKET REVENUE, 2020-2030 ($MILLION)
FIGURE 39.JAPAN NEXT-GENERATION INDUSTRIAL METROLOGY AND INSPECTION MARKET REVENUE, 2020-2030 ($MILLION)
FIGURE 40.AUSTRALIA NEXT-GENERATION INDUSTRIAL METROLOGY AND INSPECTION MARKET REVENUE, 2020-2030 ($MILLION)
FIGURE 41.REST OF ASIA-PACIFIC NEXT-GENERATION INDUSTRIAL METROLOGY AND INSPECTION MARKET REVENUE, 2020-2030 ($MILLION)
FIGURE 42.LATIN AMERICA NEXT-GENERATION INDUSTRIAL METROLOGY AND INSPECTION MARKET REVENUE, 2020-2030 ($MILLION)
FIGURE 43.MIDDLE EAST NEXT-GENERATION INDUSTRIAL METROLOGY AND INSPECTION MARKET REVENUE, 2020-2030 ($MILLION)
FIGURE 44.AFRICA NEXT-GENERATION INDUSTRIAL METROLOGY AND INSPECTION MARKET REVENUE, 2020-2030 ($MILLION)
FIGURE 45.CARL ZEISS AG: RESEARCH AND DEVELOPMENT EXPENSES, 2018–2020($MILLION)
FIGURE 46.CARL ZEISS AG: REVENUE, 2018–2020 ($MILLION)
FIGURE 47.CARL ZEISS AG: REVENUE SHARE BY REGION, 2020 (%)
FIGURE 48.FARO: RESEARCH AND DEVELOPMENT EXPENSES, 2018–2020($MILLION)
FIGURE 49.FARO: REVENUE, 2018–2020 ($MILLION)
FIGURE 50.FARO: REVENUE SHARE BY REGION, 2020 (%)
FIGURE 51.HEXAGON AB: RESEARCH AND DEVELOPMENT EXPENSES, 2018–2020($MILLION)
FIGURE 52.HEXAGON AB: REVENUE, 2018–2020 ($MILLION)
FIGURE 53.HEXAGON AB: REVENUE SHARE BY SEGMENT, 2020 (%)
FIGURE 54.HEXAGON AB: REVENUE SHARE BY REGION, 2020 (%)
FIGURE 55.JENOPTIK AG: RESEARCH AND DEVELOPMENT EXPENSES, 2019–2020($MILLION)
FIGURE 56.JENOPTIK AG: REVENUE, 2018–2020 ($MILLION)
FIGURE 57.JENOPTIK AG: REVENUE SHARE BY SEGMENT, 2020 (%)
FIGURE 58.JENOPTIK AG: REVENUE SHARE BY REGION, 2020 (%)
FIGURE 59.KLA CORPORATION: RESEARCH AND DEVELOPMENT EXPENSES, 2018–2020($MILLION)
FIGURE 60.KLA CORPORATION: REVENUE, 2018–2020 ($MILLION)
FIGURE 61.KLA CORPORATION: REVENUE SHARE BY SEGMENT, 2020 (%)
FIGURE 62.KLA CORPORATION: REVENUE SHARE BY REGION, 2020 (%)
FIGURE 63.RENISHAW PLC: RESEARCH AND DEVELOPMENT EXPENSES, 2018–2020($MILLION)
FIGURE 64.RENISHAW PLC: REVENUE, 2018–2020 ($MILLION)
FIGURE 65.RENISHAW PLC: REVENUE SHARE BY SEGMENT, 2020 (%)
FIGURE 66.RENISHAW PLC: REVENUE SHARE BY REGION, 2020 (%)
The industrial metrology is the use of science of measurement, theoretically and practically in the manufacturing process, ensuring accuracy and quality of manufactures parts and components. It is used for calibration and quality control standards. Industrial metrology is largely used in automotive, transportation, defense, and manufacturing industries. North America is the largest shareholder of the next-generation industrial metrology industry, owing to the large manufacturing and connectivity infrastructure and a strong foothold in the construction and manufacturing industry. In addition, the South Korean government is also promoting inclusion of smart manufacturing technologies in industries such as automotive, consumer packaged goods, and others to operate production smoothly and effectively.
Increase in use of mobiles, smart phones, and connected devices technologies across business processes and manufacturing departments fuels the growth of the next-generation industrial metrology and inspection market. In addition, rise in adoption of industrial metrology solutions in the food, defense sectors, and smart city initiatives boosts the growth of the market.
Moreover, inclusion of IoT, machine learning, metrology equipment, and robotics in automotive and general manufacturing sectors and electric motor vehicles is anticipated to provide lucrative opportunities for growth of the next-generation industrial metrology and inspection market.
A. The Next Generation industrial metrology and inspection market size was $8,125.0 million in 2020 and is projected to reach $16,104.2 million in 2030, growing at a CAGR of 6.9% from 2021 to 2030.
A. The forecast period considered for the Next Generation industrial metrology and inspection market is 2021 to 2030, wherein, 2020 is the base year, 2021 is the estimated year, and 2030 is the forecast year.
A. The base year considered in the Next Generation industrial metrology and inspection market is 2021.
A. The report for Next Generation industrial metrology and inspection market doesn’t provides Value Chain Analysis, but if there is a requirement for the same, it could be added as an additional customization.
A. On the basis of equipment, the coordinate measuring machine (CMM) segment is expected to be the most influencing segment growing in the Next Generation industrial metrology and inspection market report.
A. Based on application, automotive & transportation segment generated the highest revenue, accounting for 26.12% of the market share, and is projected to grow at a CAGR of 7.8% from 2021 to 2030.
A. The report contains an exclusive company profile section, where the leading 10 companies in the market are profiled. These profiles typically cover company overview, geographical presence, and market dominance (in terms of revenue and volume sales).
A. North America is expected to provide more business opportunities for Next Generation industrial metrology and inspection market in the future.
Start reading instantly.
This Report and over 66,783+ more Reports, Available with Avenue Library. T&C*.
Enterprise
License/PDF
Library
Membership
*Taxes/Fees, if applicable will be added during checkout. All prices in USD
To ensure high-level data integrity, accurate analysis, and impeccable forecasts
For complete satisfaction
On-demand customization of scope of the report to exactly meet your needs
Targeted market view to provide pertinent information and save time of readers
Get insights on topics that are crucial for your business. Stay abreast of your interest areas.
Get Industry Data AlertsTo ensure high-level data integrity, accurate analysis, and impeccable forecasts
For complete satisfaction
On-demand customization of scope of the report to exactly meet your needs
Targeted market view to provide pertinent information and save time of readers