0
2022
Nitrile Gloves Market

Nitrile gloves Market

by Type (Powdered, Powder-free), by Product (Disposable, Durable), by End-use (Medical and Healthcare, Automotive, Oil and Gas, Food and Beverage, Metal and Machinery, Chemical and Petrochemical, Pharmaceutical, Cleanroom, Others): Global Opportunity Analysis and Industry Forecast, 2021-2031

Report Code: A16783
Aug 2022 | Pages: 279
Tables: 292
Charts: 57
  • Formats*:

  • pdf

    Single User License, Five User
    License & Enterprise User License

  • xls

    Data Pack Excel License

  • ppt

    It comes with the additional cost
    of $2500.00 contact sales.


Nitrile Gloves Market Research, 2031

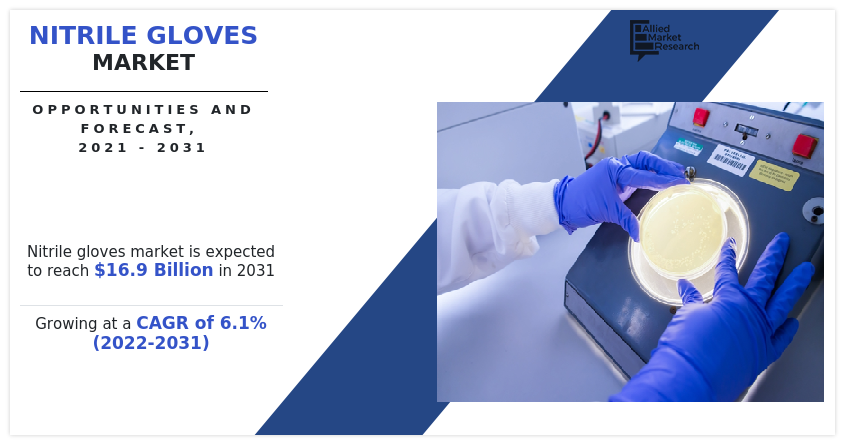
The global nitrile gloves market was valued at $9.4 billion in 2021, and is projected to reach $16.9 billion by 2031, growing at a CAGR of 6.1% from 2022 to 2031.

The nitrile gloves market has been positively impacted due to the wake of COVID-19. Growing COVID-19 infections has increased demand for primary protective equipment such as medical gloves, masks, and others. Medical gloves and masks play a crucial role in curbing the spread of viruses and help to protect health care professionals and patients from the spread of infection

Powder-free and powdered nitrile gloves are two major types of gloves available in the market. Powdered nitrile gloves consist of cornstarch powder that acts as donning agent. The powder content in nitrile gloves depend upon its intended application. For instance, nitrile gloves used in hospitals and healthcare centers uses high amount of powder content.

Nitrile gloves Market, Nitrile gloves Industry, Nitrile gloves Market Size, Nitrile gloves Market Share, Nitrile gloves Market Growth, Nitrile gloves Market Analysis, Nitrile gloves Market Trend, Nitrile gloves Market Forecast

Nitrile gloves are anti-static in nature. They offer improved solvent resistance, are odor free, making them viable to be used across food and dairy applications. Nitrile gloves are capable of withstanding ISO Propyl Alcohol thus making them commonly used in food industry. Moreover, latex free origin and production technology make these gloves ideal for surgeons or doctors that tend to have latex allergy. Disposable nitrile gloves are synthetic gloves that are mainly used in dental application. Nitrile gloves are capable of withstanding or offering resistance with solvents and chemicals, making them viable and most widely used gloves by dental specialists and surgeons. In addition, these gloves are manufactured and tested through series of abrasion resistance tests and are approved by Food and Drug Administration for medical use. All these factors drive the growth of the global market.

However, less tactile sensitivity than latex gloves is anticipated to hamper the market growth. Conversely, surge in demand for durable nitrile gloves is anticipated to offer new growth opportunities in the global nitrile gloves market. Durable nitrile gloves offer high durability and improved safety in comparison to disposable nitrile gloves. Durable nitrile gloves offer high protection level against rips, snags, and wear & tear. In addition, this type of nitrile gloves offer advanced protection owing to low acceptable quality level (AQL). Durable nitrile gloves are recommended and widely used by healthcare professionals engaged in cancer treatment. Chemotherapy, a type of cancer treatment, includes use of several cytotoxic drugs and some medical devices that tend to emit harmful rays causing skin associated risk to healthcare professionals. Hence, use of durable nitrile gloves minimizes occupational illness.

The nitrile gloves market is segmented into Type, Product and End-use, and region. On the basis of type, the market is bifurcated into powdered and powder-free. By product, the market is divided into disposable and durable. By end-user, the nitrile gloves market is categorized into medical & healthcare, automotive, oil & gas, food & beverage, metal & machinery, chemical & petrochemical, pharmaceutical, cleanroom, and others. Region wise, the market is studied across North America, Europe, Asia-Pacific, and LAMEA.
The major companies profiled in this report include Adventa Berhad, ANSELL LTD, Carolina Glove & Safety Company, Dynarex Corporation, Kossan Rubber Industries Bhd, MCR Safety, Medline Industries, LP, Rubberex Corporation (M) Berhad, Superior Glove, Top Glove Corporation Bhd, Unigloves (Uk), and Hartalega Holdings Berhad.

Nitrile gloves Market

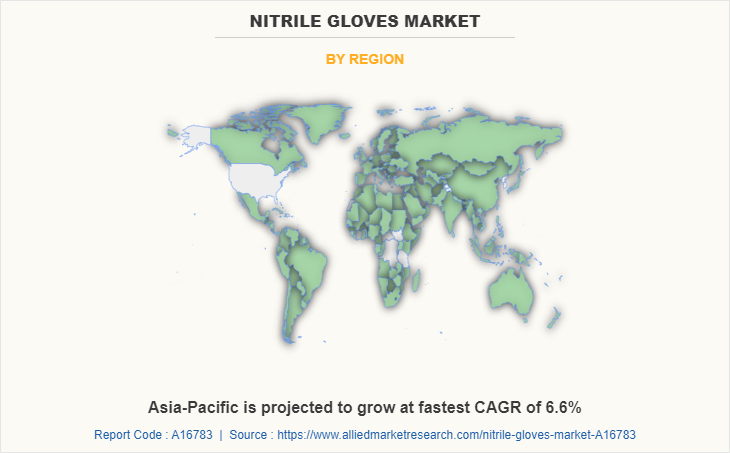
The Asia-Pacific nitrile gloves market size is projected to grow at the highest CAGR of 6.6% during the forecast period and accounted for 28.6% of the nitrile gloves market share in 2021. Nitrile gloves are gaining importance in medical and healthcare industry owing to their health associated benefits is the key market trend. Health professional tend to wear gloves and are prone to increased risk of hand dermatitis. In addition, keeping hand clean and healthy hand skin condition is challenging for clinicians. In order to follow all the cleaning regulatory guidelines, health professional tend to use sanitizers and follow other convectional method for hand sanitizing. Thus, in order to prevent frequent hand sanitizing and cleaning, health professional tend to use hand gloves. Healthcare industry in Asia-Pacific is growing rapidly owing to change in demographics, technological developments, and support from governmental bodies. This factor is further anticipated to offer new growth opportunities in the nitrile gloves market.

Nitrile gloves Market

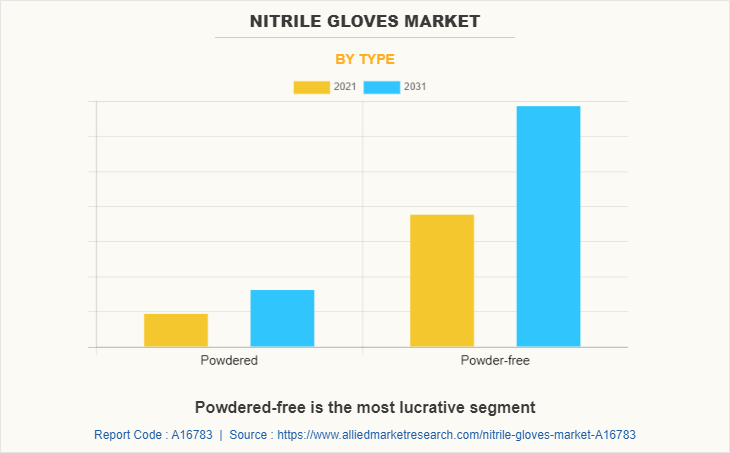
In 2021, the powder-free segment dominated the global market in terms of revenue in 2021, with over 80% of the total share. Powder-free nitrile gloves are anti-static in nature, offers improved solvent resistance, odor free, making them viable to be used across food and dairy applications. These nitrile gloves are capable of withstanding ISO Propyl Alcohol thus making them commonly used nitrile gloves in food industry. Moreover, latex free origin and production technology makes them ideal to be used for surgeons or doctors that tend have latex allergy.
Nitrile gloves Market

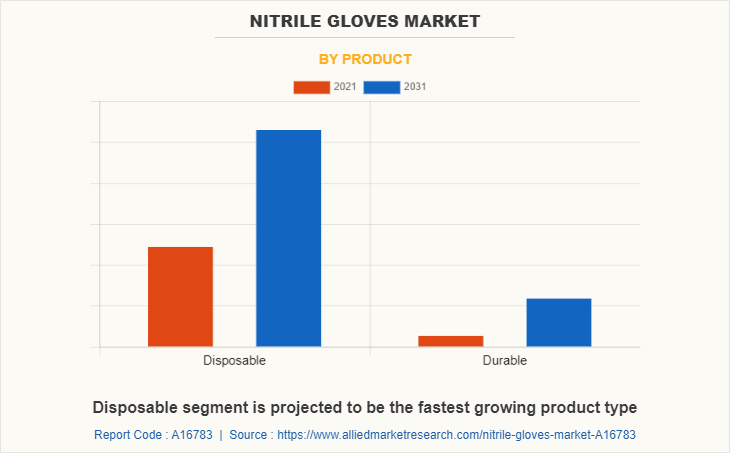
By product, the disposable product dominated the global market in terms of revenue in 2021 and is anticipated to grow at highest CAGR of 6.3% in the forecast period. Disposable nitrile gloves offer high level of protection, improved puncture resistance, and minimal abrasion for easier donning & doffing. Disposable nitrile gloves are synthetic gloves that are mainly used in dental application.  Disposables gloves are capable of withstanding or offering resistance with solvents and chemicals making them viable and most widely used gloves by dental specialists and surgeons. In addition, disposable gloves are manufactured and tested through series of abrasion resistance tests and are approves by Food and Drug Administration for medical use.
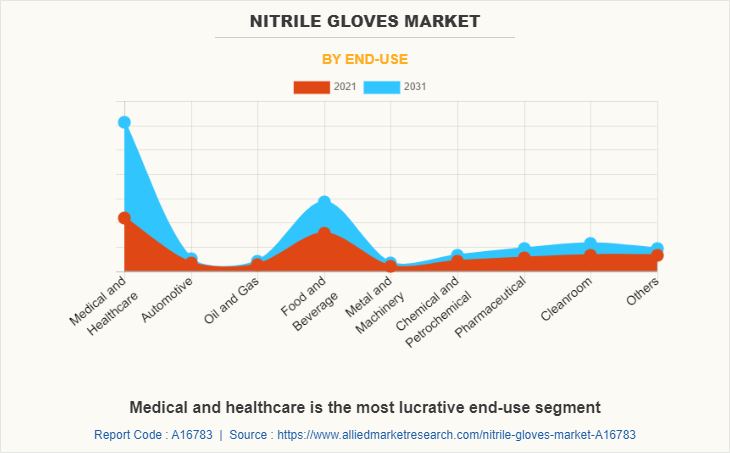
Nitrile gloves Market

By end use industry, medical & healthcare industry dominated the global market in terms of revenue in 2021, with over 76% of the total share. Nitrile gloves that are used in medical and healthcare industry are formulated differently. Medical and healthcare nitrile gloves are proven to offers resistance with bodily fluids, microorganisms, and chemicals. In addition, owing to latex-free formulation, nitrile gloves are suitable to be used with health professional that are prone to Type I allergies. Majorly, powder-free nitrile gloves are used in medical and healthcare industry as these offers flexibility, tactility, tear and chemical resistance. Moreover, nitrile gloves can be formulated using special Nitrile formulation that makes them ideal to be used by healthcare professionals. Nitrile gloves used in medical & healthcare industry are ultra soft, latex and BPA free, stronger, and are tested & approved by ASTM D6319.

IMPACT OF COVID-19 ON THE NITRILE GLOVES MARKET

  • The novel coronavirus is an incomparable global pandemic that has spread to over 180 countries and caused huge losses of lives and the economy across the globe.
  • The nitrile gloves market has been positively and moderately impacted due to the wake of COVID-19. Growing COVID-19 infections has increased demand for primary protective equipment such as medical gloves, masks, and others. Medical gloves and mask play a crucial role in curbing the spread of virus and help to protect health care professionals and patients from the spread of infection.
  • Furthermore, to control the surge of novel coronavirus cases, there is a drastic shift of investments from other sectors toward healthcare.  
  • Several countries across the globe are speeding up the import and sales of PPE kits specifically nitrile based medical gloves in order to mitigate the spread of virus. Thus, some governmental bodies are approving new production facilities license for medical gloves despite of COVID-19 pandemic situation.    
  • Growth in demand for medical gloves in the pandemic situation has created counterfeit and non-licensed medical gloves globally. Thus, in order to mitigate and prohibit sales and use of un-licensed and unsafe medical gloves, FDA has been actively engaged in investigating, examining, and reviewing medical gloves and other PPE products at ports of entry and within domestic commerce.
  • Moreover, in order to meet the global demand for medical gloves, FDA is providing regulatory flexibility under certain circumstances that are listed under enforcement policy for gloves during the COVID-19 public health emergency act. All these factors have created new growth opportunities for key-players in nitrile gloves market despite of pandemic situation.

Key Benefits For Stakeholders

  • This report provides a quantitative analysis of the market segments, current trends, estimations, and dynamics of the nitrile gloves market analysis from 2021 to 2031 to identify the prevailing nitrile gloves market opportunities.
  • The market research is offered along with information related to key drivers, restraints, and opportunities.
  • Porter's five forces analysis highlights the potency of buyers and suppliers to enable stakeholders make profit-oriented business decisions and strengthen their supplier-buyer network.
  • In-depth analysis of the nitrile gloves market segmentation assists to determine the prevailing market opportunities.
  • Major countries in each region are mapped according to their revenue contribution to the global market.
  • Market player positioning facilitates benchmarking and provides a clear understanding of the present position of the market players.
  • The report includes the analysis of the regional as well as global nitrile gloves market trends, key players, market segments, application areas, and market growth strategies.

Nitrile gloves Market Report Highlights

Aspects Details
By Type
  • Powdered
  • Powder-free
By Product
  • Disposable
  • Durable
By End-use
  • Medical and Healthcare
  • Automotive
  • Oil and Gas
  • Food and Beverage
  • Metal and Machinery
  • Chemical and Petrochemical
  • Pharmaceutical
  • Cleanroom
  • Others
By Region
  • North America  (U.S., Canada, Mexico)
  • Europe  (Germany, UK, France, Spain, Italy, Rest Of Europe)
  • Asia-Pacific  (China, India, Japan, South Korea, Australia, Rest Of Asia-Pacific)
  • LAMEA  (Brazil, Saudi Arabia, South Africa, Rest Of LAMEA)
Key Market Players Dynarex, Adenna LLC, Hartalega Holdings Berhad, kossan rubber industries berhad, Top Glove, Adventa Berhad, Superior Gloves, Medline, Ammex Corporation, DYNAREX, Cardinal Health Inc., Ansell, Top Glove Corporation Berhad, MCR Safety, Carolina, Rubberex, unigloves (uk) ltd.
 
  • CHAPTER 1:INTRODUCTION

    • 1.1.Report description

    • 1.2.Key market segments

    • 1.3.Key benefits to the stakeholders

    • 1.4.Research Methodology

      • 1.4.1.Secondary research

      • 1.4.2.Primary research

      • 1.4.3.Analyst tools and models

  • CHAPTER 2:EXECUTIVE SUMMARY

    • 2.1.Key findings of the study

    • 2.2.CXO Perspective

  • CHAPTER 3:MARKET OVERVIEW

    • 3.1.Market definition and scope

    • 3.2.Key findings

      • 3.2.1.Top investment pockets

    • 3.3.Porter’s five forces analysis

    • 3.4.Top player positioning

    • 3.5.Market dynamics

      • 3.5.1.Drivers

      • 3.5.2.Restraints

      • 3.5.3.Opportunities

    • 3.6.COVID-19 Impact Analysis on the market

    • 3.7.Pricing Analysis

    • 3.8.Value Chain Analysis

    • 3.9.Key Regulation Analysis

    • 3.10.Patent Landscape

  • CHAPTER 4: NITRILE GLOVES MARKET, BY TYPE

    • 4.1 Overview

      • 4.1.1 Market size and forecast

    • 4.2 Powdered

      • 4.2.1 Key market trends, growth factors and opportunities

      • 4.2.2 Market size and forecast, by region

      • 4.2.3 Market analysis by country

    • 4.3 Powder-free

      • 4.3.1 Key market trends, growth factors and opportunities

      • 4.3.2 Market size and forecast, by region

      • 4.3.3 Market analysis by country

  • CHAPTER 5: NITRILE GLOVES MARKET, BY PRODUCT

    • 5.1 Overview

      • 5.1.1 Market size and forecast

    • 5.2 Disposable

      • 5.2.1 Key market trends, growth factors and opportunities

      • 5.2.2 Market size and forecast, by region

      • 5.2.3 Market analysis by country

    • 5.3 Durable

      • 5.3.1 Key market trends, growth factors and opportunities

      • 5.3.2 Market size and forecast, by region

      • 5.3.3 Market analysis by country

  • CHAPTER 6: NITRILE GLOVES MARKET, BY END-USE

    • 6.1 Overview

      • 6.1.1 Market size and forecast

    • 6.2 Medical and Healthcare

      • 6.2.1 Key market trends, growth factors and opportunities

      • 6.2.2 Market size and forecast, by region

      • 6.2.3 Market analysis by country

    • 6.3 Automotive

      • 6.3.1 Key market trends, growth factors and opportunities

      • 6.3.2 Market size and forecast, by region

      • 6.3.3 Market analysis by country

    • 6.4 Oil and Gas

      • 6.4.1 Key market trends, growth factors and opportunities

      • 6.4.2 Market size and forecast, by region

      • 6.4.3 Market analysis by country

    • 6.5 Food and Beverage

      • 6.5.1 Key market trends, growth factors and opportunities

      • 6.5.2 Market size and forecast, by region

      • 6.5.3 Market analysis by country

    • 6.6 Metal and Machinery

      • 6.6.1 Key market trends, growth factors and opportunities

      • 6.6.2 Market size and forecast, by region

      • 6.6.3 Market analysis by country

    • 6.7 Chemical and Petrochemical

      • 6.7.1 Key market trends, growth factors and opportunities

      • 6.7.2 Market size and forecast, by region

      • 6.7.3 Market analysis by country

    • 6.8 Pharmaceutical

      • 6.8.1 Key market trends, growth factors and opportunities

      • 6.8.2 Market size and forecast, by region

      • 6.8.3 Market analysis by country

    • 6.9 Cleanroom

      • 6.9.1 Key market trends, growth factors and opportunities

      • 6.9.2 Market size and forecast, by region

      • 6.9.3 Market analysis by country

    • 7.0 Others

      • 7.0.1 Key market trends, growth factors and opportunities

      • 7.0.2 Market size and forecast, by region

      • 7.0.3 Market analysis by country

  • CHAPTER 7: NITRILE GLOVES MARKET, BY REGION

    • 7.1 Overview

      • 7.1.1 Market size and forecast

    • 7.2 North America

      • 7.2.1 Key trends and opportunities

      • 7.2.2 North America Market size and forecast, by Type

      • 7.2.3 North America Market size and forecast, by Product

      • 7.2.4 North America Market size and forecast, by End-use

      • 7.2.5 North America Market size and forecast, by country

        • 7.2.5.1 U.S.
          • 7.2.5.1.1 Market size and forecast, by Type
          • 7.2.5.1.2 Market size and forecast, by Product
          • 7.2.5.1.3 Market size and forecast, by End-use
        • 7.2.5.2 Canada
          • 7.2.5.2.1 Market size and forecast, by Type
          • 7.2.5.2.2 Market size and forecast, by Product
          • 7.2.5.2.3 Market size and forecast, by End-use
        • 7.2.5.3 Mexico
          • 7.2.5.3.1 Market size and forecast, by Type
          • 7.2.5.3.2 Market size and forecast, by Product
          • 7.2.5.3.3 Market size and forecast, by End-use
    • 7.3 Europe

      • 7.3.1 Key trends and opportunities

      • 7.3.2 Europe Market size and forecast, by Type

      • 7.3.3 Europe Market size and forecast, by Product

      • 7.3.4 Europe Market size and forecast, by End-use

      • 7.3.5 Europe Market size and forecast, by country

        • 7.3.5.1 Germany
          • 7.3.5.1.1 Market size and forecast, by Type
          • 7.3.5.1.2 Market size and forecast, by Product
          • 7.3.5.1.3 Market size and forecast, by End-use
        • 7.3.5.2 UK
          • 7.3.5.2.1 Market size and forecast, by Type
          • 7.3.5.2.2 Market size and forecast, by Product
          • 7.3.5.2.3 Market size and forecast, by End-use
        • 7.3.5.3 France
          • 7.3.5.3.1 Market size and forecast, by Type
          • 7.3.5.3.2 Market size and forecast, by Product
          • 7.3.5.3.3 Market size and forecast, by End-use
        • 7.3.5.4 Spain
          • 7.3.5.4.1 Market size and forecast, by Type
          • 7.3.5.4.2 Market size and forecast, by Product
          • 7.3.5.4.3 Market size and forecast, by End-use
        • 7.3.5.5 Italy
          • 7.3.5.5.1 Market size and forecast, by Type
          • 7.3.5.5.2 Market size and forecast, by Product
          • 7.3.5.5.3 Market size and forecast, by End-use
        • 7.3.5.6 Rest of Europe
          • 7.3.5.6.1 Market size and forecast, by Type
          • 7.3.5.6.2 Market size and forecast, by Product
          • 7.3.5.6.3 Market size and forecast, by End-use
    • 7.4 Asia-Pacific

      • 7.4.1 Key trends and opportunities

      • 7.4.2 Asia-Pacific Market size and forecast, by Type

      • 7.4.3 Asia-Pacific Market size and forecast, by Product

      • 7.4.4 Asia-Pacific Market size and forecast, by End-use

      • 7.4.5 Asia-Pacific Market size and forecast, by country

        • 7.4.5.1 China
          • 7.4.5.1.1 Market size and forecast, by Type
          • 7.4.5.1.2 Market size and forecast, by Product
          • 7.4.5.1.3 Market size and forecast, by End-use
        • 7.4.5.2 India
          • 7.4.5.2.1 Market size and forecast, by Type
          • 7.4.5.2.2 Market size and forecast, by Product
          • 7.4.5.2.3 Market size and forecast, by End-use
        • 7.4.5.3 Japan
          • 7.4.5.3.1 Market size and forecast, by Type
          • 7.4.5.3.2 Market size and forecast, by Product
          • 7.4.5.3.3 Market size and forecast, by End-use
        • 7.4.5.4 South Korea
          • 7.4.5.4.1 Market size and forecast, by Type
          • 7.4.5.4.2 Market size and forecast, by Product
          • 7.4.5.4.3 Market size and forecast, by End-use
        • 7.4.5.5 Australia
          • 7.4.5.5.1 Market size and forecast, by Type
          • 7.4.5.5.2 Market size and forecast, by Product
          • 7.4.5.5.3 Market size and forecast, by End-use
        • 7.4.5.6 Rest of Asia-Pacific
          • 7.4.5.6.1 Market size and forecast, by Type
          • 7.4.5.6.2 Market size and forecast, by Product
          • 7.4.5.6.3 Market size and forecast, by End-use
    • 7.5 LAMEA

      • 7.5.1 Key trends and opportunities

      • 7.5.2 LAMEA Market size and forecast, by Type

      • 7.5.3 LAMEA Market size and forecast, by Product

      • 7.5.4 LAMEA Market size and forecast, by End-use

      • 7.5.5 LAMEA Market size and forecast, by country

        • 7.5.5.1 Brazil
          • 7.5.5.1.1 Market size and forecast, by Type
          • 7.5.5.1.2 Market size and forecast, by Product
          • 7.5.5.1.3 Market size and forecast, by End-use
        • 7.5.5.2 Saudi Arabia
          • 7.5.5.2.1 Market size and forecast, by Type
          • 7.5.5.2.2 Market size and forecast, by Product
          • 7.5.5.2.3 Market size and forecast, by End-use
        • 7.5.5.3 South Africa
          • 7.5.5.3.1 Market size and forecast, by Type
          • 7.5.5.3.2 Market size and forecast, by Product
          • 7.5.5.3.3 Market size and forecast, by End-use
        • 7.5.5.4 Rest of LAMEA
          • 7.5.5.4.1 Market size and forecast, by Type
          • 7.5.5.4.2 Market size and forecast, by Product
          • 7.5.5.4.3 Market size and forecast, by End-use
  • CHAPTER 8: COMPANY LANDSCAPE

    • 8.1. Introduction

    • 8.2. Top winning strategies

    • 8.3. Product Mapping of Top 10 Player

    • 8.4. Competitive Dashboard

    • 8.5. Competitive Heatmap

    • 8.6. Key developments

  • CHAPTER 9: COMPANY PROFILES

    • 9.1 Ansell

      • 9.1.1 Company overview

      • 9.1.2 Company snapshot

      • 9.1.3 Operating business segments

      • 9.1.4 Product portfolio

      • 9.1.5 Business performance

      • 9.1.6 Key strategic moves and developments

    • 9.2 Top Glove

      • 9.2.1 Company overview

      • 9.2.2 Company snapshot

      • 9.2.3 Operating business segments

      • 9.2.4 Product portfolio

      • 9.2.5 Business performance

      • 9.2.6 Key strategic moves and developments

    • 9.3 Top Glove Corporation Berhad

      • 9.3.1 Company overview

      • 9.3.2 Company snapshot

      • 9.3.3 Operating business segments

      • 9.3.4 Product portfolio

      • 9.3.5 Business performance

      • 9.3.6 Key strategic moves and developments

    • 9.4 Dynarex

      • 9.4.1 Company overview

      • 9.4.2 Company snapshot

      • 9.4.3 Operating business segments

      • 9.4.4 Product portfolio

      • 9.4.5 Business performance

      • 9.4.6 Key strategic moves and developments

    • 9.5 DYNAREX

      • 9.5.1 Company overview

      • 9.5.2 Company snapshot

      • 9.5.3 Operating business segments

      • 9.5.4 Product portfolio

      • 9.5.5 Business performance

      • 9.5.6 Key strategic moves and developments

    • 9.6 unigloves (uk) ltd.

      • 9.6.1 Company overview

      • 9.6.2 Company snapshot

      • 9.6.3 Operating business segments

      • 9.6.4 Product portfolio

      • 9.6.5 Business performance

      • 9.6.6 Key strategic moves and developments

    • 9.7 Superior Gloves

      • 9.7.1 Company overview

      • 9.7.2 Company snapshot

      • 9.7.3 Operating business segments

      • 9.7.4 Product portfolio

      • 9.7.5 Business performance

      • 9.7.6 Key strategic moves and developments

    • 9.8 Adenna LLC

      • 9.8.1 Company overview

      • 9.8.2 Company snapshot

      • 9.8.3 Operating business segments

      • 9.8.4 Product portfolio

      • 9.8.5 Business performance

      • 9.8.6 Key strategic moves and developments

    • 9.9 Medline

      • 9.9.1 Company overview

      • 9.9.2 Company snapshot

      • 9.9.3 Operating business segments

      • 9.9.4 Product portfolio

      • 9.9.5 Business performance

      • 9.9.6 Key strategic moves and developments

    • 9.10 MCR Safety

      • 9.10.1 Company overview

      • 9.10.2 Company snapshot

      • 9.10.3 Operating business segments

      • 9.10.4 Product portfolio

      • 9.10.5 Business performance

      • 9.10.6 Key strategic moves and developments

    • 9.11 Rubberex

      • 9.11.1 Company overview

      • 9.11.2 Company snapshot

      • 9.11.3 Operating business segments

      • 9.11.4 Product portfolio

      • 9.11.5 Business performance

      • 9.11.6 Key strategic moves and developments

    • 9.12 kossan rubber industries berhad

      • 9.12.1 Company overview

      • 9.12.2 Company snapshot

      • 9.12.3 Operating business segments

      • 9.12.4 Product portfolio

      • 9.12.5 Business performance

      • 9.12.6 Key strategic moves and developments

    • 9.13 Carolina

      • 9.13.1 Company overview

      • 9.13.2 Company snapshot

      • 9.13.3 Operating business segments

      • 9.13.4 Product portfolio

      • 9.13.5 Business performance

      • 9.13.6 Key strategic moves and developments

    • 9.14 Adventa Berhad

      • 9.14.1 Company overview

      • 9.14.2 Company snapshot

      • 9.14.3 Operating business segments

      • 9.14.4 Product portfolio

      • 9.14.5 Business performance

      • 9.14.6 Key strategic moves and developments

    • 9.15 Ammex Corporation

      • 9.15.1 Company overview

      • 9.15.2 Company snapshot

      • 9.15.3 Operating business segments

      • 9.15.4 Product portfolio

      • 9.15.5 Business performance

      • 9.15.6 Key strategic moves and developments

    • 9.16 Cardinal Health Inc.

      • 9.16.1 Company overview

      • 9.16.2 Company snapshot

      • 9.16.3 Operating business segments

      • 9.16.4 Product portfolio

      • 9.16.5 Business performance

      • 9.16.6 Key strategic moves and developments

    • 9.17 Hartalega Holdings Berhad

      • 9.17.1 Company overview

      • 9.17.2 Company snapshot

      • 9.17.3 Operating business segments

      • 9.17.4 Product portfolio

      • 9.17.5 Business performance

      • 9.17.6 Key strategic moves and developments

  • LIST OF TABLES

  • TABLE 01. NITRILE GLOVES MARKET, BY TYPE, 2021-2031 ($MILLION)
    TABLE 02. NITRILE GLOVES MARKET, BY TYPE, 2020-2030 (MILLION UNITS)
    TABLE 03. NITRILE GLOVES MARKET FOR POWDERED TYPE, BY REGION, 2021–2031 ($MILLION)
    TABLE 04. NITRILE GLOVES MARKET FOR POWDERED TYPE, BY REGION, 2021–2031 (MILLION UNITS)
    TABLE 05. NITRILE GLOVES MARKET FOR POWDER-FREE TYPE, BY REGION, 2021–2031 ($MILLION)
    TABLE 06. NITRILE GLOVES MARKET FOR POWDER-FREE TYPE, BY REGION, 2021–2031 (MILLION UNITS)
    TABLE 07. NITRILE GLOVES MARKET, BY PRODUCT TYPE, 2021-2031 ($MILLION)
    TABLE 08. NITRILE GLOVES MARKET, BY PRODUCT TYPE, 2020-2030 (MILLION UNITS)
    TABLE 09. NITRILE GLOVES MARKET FOR DISPOSABLE PRODUCT TYPE, BY REGION, 2021–2031 ($MILLION)
    TABLE 10. NITRILE GLOVES MARKET FOR DISPOSABLE PRODUCT TYPE, BY REGION, 2021–2031 (MILLION UNITS)
    TABLE 11. NITRILE GLOVES MARKET FOR DURABLE PRODUCT TYPE, BY REGION, 2021–2031 ($MILLION)
    TABLE 12. NITRILE GLOVES MARKET FOR DURABLE PRODUCT TYPE, BY REGION, 2021–2031 (MILLION UNITS)
    TABLE 13. NITRILE GLOVES MARKET, BY END-USE INDUSTRY, 2021-2031 ($MILLION)
    TABLE 14. NITRILE GLOVES MARKET, BY END-USE INDUSTRY, 2020-2030 (MILLION UNITS)
    TABLE 15. NITRILE GLOVES MARKET FOR MEDICAL & HEALTHCARE, BY REGION, 2021–2031 ($MILLION)
    TABLE 16. NITRILE GLOVES MARKET FOR MEDICAL & HEALTHCARE, BY REGION, 2021–2031 (MILLION UNITS)
    TABLE 17. NITRILE GLOVES MARKET FOR AUTOMOTIVE, BY REGION, 2021–2031 ($MILLION)
    TABLE 18. NITRILE GLOVES MARKET FOR AUTOMOTIVE, BY REGION, 2021–2031 (MILLION UNITS)
    TABLE 19. NITRILE GLOVES MARKET FOR OIL & GAS, BY REGION, 2021–2031 ($MILLION)
    TABLE 20. NITRILE GLOVES MARKET FOR OIL & GAS, BY REGION, 2021–2031 (MILLION UNITS)
    TABLE 21. NITRILE GLOVES MARKET FOR FOOD & BEVERAGE, BY REGION, 2021–2031 ($MILLION)
    TABLE 22. NITRILE GLOVES MARKET FOR FOOD & BEVERAGE, BY REGION, 2021–2031 (MILLION UNITS)
    TABLE 23. NITRILE GLOVES MARKET FOR METAL & MACHINERY, BY REGION, 2021–2031 ($MILLION)
    TABLE 24. NITRILE GLOVES MARKET FOR METAL & MACHINERY, BY REGION, 2021–2031 (MILLION UNITS)
    TABLE 25. NITRILE GLOVES MARKET FOR CHEMICAL & PETROCHEMICAL, BY REGION, 2021–2031 ($MILLION)
    TABLE 26. NITRILE GLOVES MARKET FOR CHEMICAL & PETROCHEMICAL, BY REGION, 2021–2031 (MILLION UNITS)
    TABLE 27. NITRILE GLOVES MARKET FOR PHARMACEUTICAL, BY REGION, 2021–2031 ($MILLION)
    TABLE 28. NITRILE GLOVES MARKET FOR PHARMACEUTICAL, BY REGION, 2021–2031 (MILLION UNITS)
    TABLE 29. NITRILE GLOVES MARKET FOR CLEANROOM, BY REGION, 2021–2031 ($MILLION)
    TABLE 30. NITRILE GLOVES MARKET FOR CLEANROOM, BY REGION, 2021–2031 (MILLION UNITS)
    TABLE 31. NITRILE GLOVES MARKET FOR OTHERS, BY REGION, 2021–2031 ($MILLION)
    TABLE 32. NITRILE GLOVES MARKET FOR OTHERS, BY REGION, 2021–2031 (MILLION UNITS)
    TABLE 33. NITRILE GLOVES MARKET, BY REGION, 2021–2031 ($MILLION)
    TABLE 34. NITRILE GLOVES MARKET, BY REGION, 2021-2031 (MILLION UNITS)
    TABLE 35. NORTH AMERICA NITRILE GLOVES MARKET, BY PRODUCT TYPE, 2021-2031 ($MILLION)
    TABLE 36. NORTH AMERICA NITRILE GLOVES MARKET, BY PRODUCT TYPE, 2021-2031 (MILLION UNITS)
    TABLE 37. NORTH AMERICA NITRILE GLOVES MARKET, BY END-USE INDUSTRY, 2021-2031 ($MILLION)
    TABLE 38. NORTH AMERICA NITRILE GLOVES MARKET, BY END-USE INDUSTRY, 2021–2031 (MILLION UNITS)
    TABLE 39. NORTH AMERICA NITRILE GLOVES MARKET, BY COUNTRY, 2021-2031 ($MILLION)
    TABLE 40. NORTH AMERICA NITRILE GLOVES MARKET, BY COUNTRY, 2021–2031 (MILLION UNITS)
    TABLE 41. U.S. NITRILE GLOVES MARKET, BY PRODUCT TYPE, 2021-2031 ($MILLION)
    TABLE 42. U.S. NITRILE GLOVES MARKET, BY PRODUCT TYPE, 2021-2031 (MILLION UNITS)
    TABLE 43. U.S. NITRILE GLOVES MARKET, BY END-USE INDUSTRY, 2021-2031 ($MILLION)
    TABLE 44. U.S. NITRILE GLOVES MARKET, BY END-USE INDUSTRY, 2021–2031 (MILLION UNITS)
    TABLE 45. CANADA NITRILE GLOVES MARKET, BY PRODUCT TYPE, 2021-2031 ($MILLION)
    TABLE 46. CANADA NITRILE GLOVES MARKET, BY PRODUCT TYPE, 2021-2031 (MILLION UNITS)
    TABLE 47. CANADA NITRILE GLOVES MARKET, BY END-USE INDUSTRY, 2021-2031 ($MILLION)
    TABLE 48. CANADA NITRILE GLOVES MARKET, BY END-USE INDUSTRY, 2021–2031 (MILLION UNITS)
    TABLE 49. MEXICO NITRILE GLOVES MARKET, BY PRODUCT TYPE, 2021-2031 ($MILLION)
    TABLE 50. MEXICO NITRILE GLOVES MARKET, BY PRODUCT TYPE, 2021-2031 (MILLION UNITS)
    TABLE 51. MEXICO NITRILE GLOVES MARKET, BY END-USE INDUSTRY, 2021-2031 ($MILLION)
    TABLE 52. MEXICO NITRILE GLOVES MARKET, BY END-USE INDUSTRY, 2021–2031 (MILLION UNITS)
    TABLE 53. EUROPE NITRILE GLOVES MARKET, BY PRODUCT TYPE, 2021-2031 ($MILLION)
    TABLE 54. EUROPE NITRILE GLOVES MARKET, BY PRODUCT TYPE, 2021-2031 (MILLION UNITS)
    TABLE 55. EUROPE NITRILE GLOVES MARKET, BY END-USE INDUSTRY, 2021-2031 ($MILLION)
    TABLE 56. EUROPE NITRILE GLOVES MARKET, BY END-USE INDUSTRY, 2021–2031 (MILLION UNITS)
    TABLE 57. EUROPE NITRILE GLOVES MARKET, BY COUNTRY, 2021–2031($MILLION)
    TABLE 58. EUROPE NITRILE GLOVES MARKET, BY COUNTRY, 2021–2031(MILLION UNITS)
    TABLE 59. GERMANY NITRILE GLOVES MARKET, BY PRODUCT TYPE, 2021-2031 ($MILLION)
    TABLE 60. GERMANY NITRILE GLOVES MARKET, BY PRODUCT TYPE, 2021-2031 (MILLION UNITS)
    TABLE 61. GERMANY NITRILE GLOVES MARKET, BY END-USE INDUSTRY, 2021-2031 ($MILLION)
    TABLE 62. GERMANY NITRILE GLOVES MARKET, BY END-USE INDUSTRY, 2021–2031 (MILLION UNITS)
    TABLE 63. FRANCE NITRILE GLOVES MARKET, BY PRODUCT TYPE, 2021-2031 ($MILLION)
    TABLE 64. FRANCE NITRILE GLOVES MARKET, BY PRODUCT TYPE, 2021-2031 (MILLION UNITS)
    TABLE 65. FRANCE NITRILE GLOVES MARKET, BY END-USE INDUSTRY, 2021-2031 ($MILLION)
    TABLE 66. FRANCE NITRILE GLOVES MARKET, BY END-USE INDUSTRY, 2021–2031 (MILLION UNITS)
    TABLE 67. ITALY NITRILE GLOVES MARKET, BY PRODUCT TYPE, 2021-2031 ($MILLION)
    TABLE 68. ITALY NITRILE GLOVES MARKET, BY PRODUCT TYPE, 2021-2031 (MILLION UNITS)
    TABLE 69. ITALY NITRILE GLOVES MARKET, BY END-USE INDUSTRY, 2021-2031 ($MILLION)
    TABLE 70. ITALY NITRILE GLOVES MARKET, BY END-USE INDUSTRY, 2021–2031 (MILLION UNITS)
    TABLE 71. SPAIN NITRILE GLOVES MARKET, BY PRODUCT TYPE, 2021-2031 ($MILLION)
    TABLE 72. SPAIN NITRILE GLOVES MARKET, BY PRODUCT TYPE, 2021-2031 (MILLION UNITS)
    TABLE 73. SPAIN NITRILE GLOVES MARKET, BY END-USE INDUSTRY, 2021-2031 ($MILLION)
    TABLE 74. SPAIN NITRILE GLOVES MARKET, BY END-USE INDUSTRY, 2021–2031 (MILLION UNITS)
    TABLE 75. UK NITRILE GLOVES MARKET, BY PRODUCT TYPE, 2021-2031 ($MILLION)
    TABLE 76. UK NITRILE GLOVES MARKET, BY PRODUCT TYPE, 2021-2031 (MILLION UNITS)
    TABLE 77. UK NITRILE GLOVES MARKET, BY END-USE INDUSTRY, 2021-2031 ($MILLION)
    TABLE 78. UK NITRILE GLOVES MARKET, BY END-USE INDUSTRY, 2021–2031 (MILLION UNITS)
    TABLE 79. REST OF EUROPE NITRILE GLOVES MARKET, BY PRODUCT TYPE, 2021-2031 ($MILLION)
    TABLE 80. REST OF EUROPE NITRILE GLOVES MARKET, BY PRODUCT TYPE, 2021-2031 (MILLION UNITS)
    TABLE 81. REST OF EUROPE NITRILE GLOVES MARKET, BY END-USE INDUSTRY, 2021-2031 ($MILLION)
    TABLE 82. REST OF EUROPE NITRILE GLOVES MARKET, BY END-USE INDUSTRY, 2021–2031 (MILLION UNITS)
    TABLE 83. ASIA-PACIFIC NITRILE GLOVES MARKET, BY PRODUCT TYPE, 2021-2031 ($MILLION)
    TABLE 84. ASIA-PACIFIC NITRILE GLOVES MARKET, BY PRODUCT TYPE, 2021-2031 (MILLION UNITS)
    TABLE 85. ASIA-PACIFIC NITRILE GLOVES MARKET, BY END-USE INDUSTRY, 2021-2031 ($MILLION)
    TABLE 86. ASIA-PACIFIC NITRILE GLOVES MARKET, BY END-USE INDUSTRY, 2021–2031 (MILLION UNITS)
    TABLE 87. ASIA-PACIFIC NITRILE GLOVES MARKET, BY COUNTRY, 2021–2031($MILLION)
    TABLE 88. ASIA-PACIFIC NITRILE GLOVES MARKET, BY COUNTRY, 2021–2031(MILLION UNITS)
    TABLE 89. CHINA NITRILE GLOVES MARKET, BY PRODUCT TYPE, 2021-2031 ($MILLION)
    TABLE 90. CHINA NITRILE GLOVES MARKET, BY PRODUCT TYPE, 2021-2031 (MILLION UNITS)
    TABLE 91. CHINA NITRILE GLOVES MARKET, BY END-USE INDUSTRY, 2021-2031 ($MILLION)
    TABLE 92. CHINA NITRILE GLOVES MARKET, BY END-USE INDUSTRY, 2021–2031 (MILLION UNITS)
    TABLE 93. INDIA NITRILE GLOVES MARKET, BY PRODUCT TYPE, 2021-2031 ($MILLION)
    TABLE 94. INDIA NITRILE GLOVES MARKET, BY PRODUCT TYPE, 2021-2031 (MILLION UNITS)
    TABLE 95. INDIA NITRILE GLOVES MARKET, BY END-USE INDUSTRY, 2021-2031 ($MILLION)
    TABLE 96. INDIA NITRILE GLOVES MARKET, BY END-USE INDUSTRY, 2021–2031 (MILLION UNITS)
    TABLE 97. JAPAN NITRILE GLOVES MARKET, BY PRODUCT TYPE, 2021-2031 ($MILLION)
    TABLE 98. JAPAN NITRILE GLOVES MARKET, BY PRODUCT TYPE, 2021-2031 (MILLION UNITS)
    TABLE 99. JAPAN NITRILE GLOVES MARKET, BY END-USE INDUSTRY, 2021-2031 ($MILLION)
    TABLE 100. JAPAN NITRILE GLOVES MARKET, BY END-USE INDUSTRY, 2021–2031 (MILLION UNITS)
    TABLE 101. SOUTH KOREA NITRILE GLOVES MARKET, BY PRODUCT TYPE, 2021-2031 ($MILLION)
    TABLE 102. SOUTH KOREA NITRILE GLOVES MARKET, BY PRODUCT TYPE, 2021-2031 (MILLION UNITS)
    TABLE 103. SOUTH KOREA NITRILE GLOVES MARKET, BY END-USE INDUSTRY, 2021-2031 ($MILLION)
    TABLE 104. SOUTH KOREA NITRILE GLOVES MARKET, BY END-USE INDUSTRY, 2021–2031 (MILLION UNITS)
    TABLE 105. AUSTRALIA NITRILE GLOVES MARKET, BY PRODUCT TYPE, 2021-2031 ($MILLION)
    TABLE 106. AUSTRALIA NITRILE GLOVES MARKET, BY PRODUCT TYPE, 2021-2031 (MILLION UNITS)
    TABLE 107. AUSTRALIA NITRILE GLOVES MARKET, BY END-USE INDUSTRY, 2021-2031 ($MILLION)
    TABLE 108. AUSTRALIA NITRILE GLOVES MARKET, BY END-USE INDUSTRY, 2021–2031 (MILLION UNITS)
    TABLE 109. REST OF ASIA-PACIFIC NITRILE GLOVES MARKET, BY PRODUCT TYPE, 2021-2031 ($MILLION)
    TABLE 110. REST OF ASIA-PACIFIC NITRILE GLOVES MARKET, BY PRODUCT TYPE, 2021-2031 (MILLION UNITS)
    TABLE 111. REST OF ASIA-PACIFIC NITRILE GLOVES MARKET, BY END-USE INDUSTRY, 2021-2031 ($MILLION)
    TABLE 112. REST OF ASIA-PACIFIC NITRILE GLOVES MARKET, BY END-USE INDUSTRY, 2021–2031 (MILLION UNITS)
    TABLE 113. LAMEA NITRILE GLOVES MARKET, BY PRODUCT TYPE, 2021-2031 ($MILLION)
    TABLE 114. LAMEA NITRILE GLOVES MARKET, BY PRODUCT TYPE, 2021-2031 (MILLION UNITS)
    TABLE 115. LAMEA NITRILE GLOVES MARKET, BY END-USE INDUSTRY, 2021-2031 ($MILLION)
    TABLE 116. LAMEA NITRILE GLOVES MARKET, BY END-USE INDUSTRY, 2021–2031 (MILLION UNITS)
    TABLE 117. LAMEA NITRILE GLOVES MARKET, BY COUNTRY, 2021–2031($MILLION)
    TABLE 118. LAMEA NITRILE GLOVES MARKET, BY COUNTRY, 2021–2031(MILLION UNITS)
    TABLE 119. BRAZIL NITRILE GLOVES MARKET, BY PRODUCT TYPE, 2021-2031 ($MILLION)
    TABLE 120. BRAZIL NITRILE GLOVES MARKET, BY PRODUCT TYPE, 2021-2031 (MILLION UNITS)
    TABLE 121. BRAZIL NITRILE GLOVES MARKET, BY END-USE INDUSTRY, 2021-2031 ($MILLION)
    TABLE 122. BRAZIL NITRILE GLOVES MARKET, BY END-USE INDUSTRY, 2021–2031 (MILLION UNITS)
    TABLE 123. SAUDI ARABIA NITRILE GLOVES MARKET, BY PRODUCT TYPE, 2021-2031 ($MILLION)
    TABLE 124. SAUDI ARABIA NITRILE GLOVES MARKET, BY PRODUCT TYPE, 2021-2031 (MILLION UNITS)
    TABLE 125. SAUDI ARABIA NITRILE GLOVES MARKET, BY END-USE INDUSTRY, 2021-2031 ($MILLION)
    TABLE 126. SAUDI ARABIA NITRILE GLOVES MARKET, BY END-USE INDUSTRY, 2021–2031 (MILLION UNITS)
    TABLE 127. SOUTH AFRICA NITRILE GLOVES MARKET, BY PRODUCT TYPE, 2021-2031 ($MILLION)
    TABLE 128. SOUTH AFRICA NITRILE GLOVES MARKET, BY PRODUCT TYPE, 2021-2031 (MILLION UNITS)
    TABLE 129. SOUTH AFRICA NITRILE GLOVES MARKET, BY END-USE INDUSTRY, 2021-2031 ($MILLION)
    TABLE 130. SOUTH AFRICA NITRILE GLOVES MARKET, BY END-USE INDUSTRY, 2021–2031 (MILLION UNITS)
    TABLE 131. REST OF LAMEA NITRILE GLOVES MARKET, BY PRODUCT TYPE, 2021-2031 ($MILLION)
    TABLE 132. REST OF LAMEA NITRILE GLOVES MARKET, BY PRODUCT TYPE, 2021-2031 (MILLION UNITS)
    TABLE 133. REST OF LAMEA NITRILE GLOVES MARKET, BY END-USE INDUSTRY, 2021-2031 ($MILLION)
    TABLE 134. REST OF LAMEA NITRILE GLOVES MARKET, BY END-USE INDUSTRY, 2021–2031 (MILLION UNITS)
    TABLE 135. KEY EXPANSIONS (2019-2022)
  • LIST OF FIGURES

  • FIGURE 01. NITRILE GLOVES MARKET SNAPSHOT
    FIGURE 02. NITRILE GLOVES MARKET SEGMENTATION
    FIGURE 03. TOP INVESTMENT POCKETS
    FIGURE 04. MODERATE BARGAINING POWER OF SUPPLIERS
    FIGURE 05. MODERATE BARGAINING POWER OF BUYERS
    FIGURE 06. MODERATE THREAT OF NEW ENTRANTS
    FIGURE 07. MODERATE THREAT OF SUBSTITUTES
    FIGURE 08. MODERATE COMPETITIVE RIVALRY
    FIGURE 09. NITRILE GLOVES MARKET DYNAMICS
    FIGURE 10. VALUE CHAIN ANALYSIS
    FIGURE 11. NITRILE GLOVES MARKET, PRICING ANALYSIS, BY PRODUCT TYPE, USD/MILLION UNITS
    FIGURE 12. PATENT ANALYSIS, BY COUNTRY, 2012-2022
    FIGURE 13. PATENT ANALYSIS, BY APPLICANT, 2012-2022
    FIGURE 14. PATENT ANALYSIS, BY PUBLICATION DATE, 2012-2022
    FIGURE 15. NITRILE GLOVES MARKET, BY TYPE, 2021–2031 ($MILILION)
    FIGURE 16. COMPARATIVE SHARE ANALYSIS OF NITRILE GLOVES MARKET FOR POWDERED TYPE, BY COUNTRY, 2021 & 2031 (%)
    FIGURE 17. COMPARATIVE SHARE ANALYSIS OF NITRILE GLOVES MARKET FOR POWDER-FREE TYPE, BY COUNTRY, 2021 & 2031 (%)
    FIGURE 18. NITRILE GLOVES MARKET, BY PRODUCT TYPE, 2021–2031 ($MILILION)
    FIGURE 19. COMPARATIVE SHARE ANALYSIS OF NITRILE GLOVES MARKET FOR DISPOSABLE PRODUCT TYPE, BY COUNTRY, 2021 & 2031 (%)
    FIGURE 20. COMPARATIVE SHARE ANALYSIS OF NITRILE GLOVES MARKET FOR DURABLE PRODUCT TYPE, BY COUNTRY, 2021 & 2031 (%)
    FIGURE 21. NITRILE GLOVES MARKET, BY END-USE INDUSTRY, 2021–2031 ($MILILION)
    FIGURE 22. COMPARATIVE SHARE ANALYSIS OF NITRILE GLOVES MARKET FOR MEDICAL & HEALTHCARE, BY COUNTRY, 2021 & 2031 (%)
    FIGURE 23. COMPARATIVE SHARE ANALYSIS OF NITRILE GLOVES MARKET FOR AUTOMOTIVE, BY COUNTRY, 2021 & 2031 (%)
    FIGURE 24. COMPARATIVE SHARE ANALYSIS OF NITRILE GLOVES MARKET FOR OIL & GAS, BY COUNTRY, 2021 & 2031 (%)
    FIGURE 25. COMPARATIVE SHARE ANALYSIS OF NITRILE GLOVES MARKET FOR FOOD & BEVERAGE, BY COUNTRY, 2021 & 2031 (%)
    FIGURE 26. COMPARATIVE SHARE ANALYSIS OF NITRILE GLOVES MARKET FOR METAL & MACHINERY, BY COUNTRY, 2021 & 2031 (%)
    FIGURE 27. COMPARATIVE SHARE ANALYSIS OF NITRILE GLOVES MARKET FOR CHEMICAL & PETROCHEMICAL, BY COUNTRY, 2021 & 2031 (%)
    FIGURE 28. COMPARATIVE SHARE ANALYSIS OF NITRILE GLOVES MARKET FOR PHARMACEUTICAL, BY COUNTRY, 2021 & 2031 (%)
    FIGURE 29. COMPARATIVE SHARE ANALYSIS OF NITRILE GLOVES MARKET FOR CLEANROOM, BY COUNTRY, 2021 & 2031 (%)
    FIGURE 30. COMPARATIVE SHARE ANALYSIS OF NITRILE GLOVES MARKET FOR OTHERS, BY COUNTRY, 2021 & 2031 (%)
    FIGURE 31. NITRILE GLOVES MARKET, BY REGION, 2021–2031 ($MILLION)
    FIGURE 32. U.S. NITRILE GLOVES MARKET REVENUE, 2021–2031($MILLION)
    FIGURE 33. CANADA NITRILE GLOVES MARKET REVENUE, 2021–2031 ($MILLION)
    FIGURE 34. MEXICO NITRILE GLOVES MARKET REVENUE, 2021–2031 ($MILLION)
    FIGURE 35. GERMANY NITRILE GLOVES MARKET REVENUE, 2021–2031 ($MILLION)
    FIGURE 36. FRANCE NITRILE GLOVES MARKET REVENUE, 2021–2031 ($MILLION)
    FIGURE 37. ITALY NITRILE GLOVES MARKET REVENUE, 2021–2031 ($MILLION)
    FIGURE 38. SPAIN NITRILE GLOVES MARKET REVENUE, 2021–2031 ($MILLION)
    FIGURE 39. UK NITRILE GLOVES MARKET REVENUE, 2021–2031 ($MILLION)
    FIGURE 40. REST OF EUROPE NITRILE GLOVES MARKET REVENUE, 2021–2031 ($MILLION)
    FIGURE 41. CHINA NITRILE GLOVES MARKET REVENUE, 2021–2031 ($MILLION)
    FIGURE 42. INDIA NITRILE GLOVES MARKET REVENUE, 2021–2031 ($MILLION)
    FIGURE 43. JAPAN NITRILE GLOVES MARKET REVENUE, 2021–2031 ($MILLION)
    FIGURE 44. SOUTH KOREA NITRILE GLOVES MARKET REVENUE, 2021–2031 ($MILLION)
    FIGURE 45. AUSTRALIA NITRILE GLOVES MARKET REVENUE, 2021–2031 ($MILLION)
    FIGURE 46. REST OF ASIA-PACIFIC NITRILE GLOVES MARKET REVENUE, 2021–2031 ($MILLION)
    FIGURE 47. BRAZIL NITRILE GLOVES MARKET REVENUE, 2021–2031 ($MILLION)
    FIGURE 48. SAUDI ARABIA NITRILE GLOVES MARKET REVENUE, 2021–2031 ($MILLION)
    FIGURE 49. SOUTH AFRICA NITRILE GLOVES MARKET REVENUE, 2021–2031 ($MILLION)
    FIGURE 50. REST OF LAMEA NITRILE GLOVES MARKET REVENUE, 2021–2031 ($MILLION)
    FIGURE 51. MARKET PLAYER POSITIONING, 2021
    FIGURE 52. TOP WINNING STRATEGIES, BY YEAR, 2018–2021
    FIGURE 53. TOP WINNING STRATEGIES, BY DEVELOPMENT, 2019–2022 (%)
    FIGURE 54. TOP WINNING STRATEGIES, BY COMPANY, 2019–2022
    FIGURE 55. PRODUCT MAPPING OF TOP 10 PLAYERS
    FIGURE 56. COMPETITIVE DASHBOARD
    FIGURE 57. COMPETITIVE HEATMAP OF KEY PLAYERS


According to CXOs of leading companies, the global nitrile gloves market is expected to exhibit high growth owing to its use in oil & gas and automotive end-use industry. Nitrile gloves in automotive industry are used as personal protective equipment as they tend to offer protection from bases, acids, oils, solvents, gasoline, esters, greases, alcohols, and caustics. In addition, nitrile gloves have become the automotive industry standard. Surge in number of automotive technicians and mechanics is anticipated to drive the demand of the global nitrile gloves. Automotive technicians and mechanics are prone to injuries as they tend to handle different lubricants and automotive fluids that contain bases, acids, oils, solvents, gasoline, esters, greases, alcohols, and caustics. Thus, they need to protect their hands using appropriate gloves. Nitrile gloves are widely preferred by automotive technicians and mechanics owing to their comfort level with high protection level offered against different operating fluids. All these factors have escalated the demand for nitrile gloves in automotive end-use industry.

Workers in oil and gas industry are prone to extreme working conditions associated during drilling, transportation, construction, and refining. These processes involve serious risks of injury associated with impact, pinching, cut, and puncture hazards. Thus, oil and gas industry require specially developed gloves for protection. Combined impact, cut and thermal protection offered by nitrile gloves makes them suitable to be used by oil and gas industry workers. Oil and gas industry workers are vulnerable to heat and arc flash hazards, thus, requiring the need for primary protective equipment such as gloves primarily.. Nitrile gloves have gained immense popularity in oil and gas industry over latex based gloves owing to benefits offered by nitrile gloves. In addition, oil and gas industry workers are vulnerable to contamination caused by oil and other hazardous chemicals. Thus, worker tend to use nitrile gloves as these are proven to offers resistance with hazardous chemicals and other corrosive liquids. These factors have escalated the demand and use of nitrile gloves in oil & gas industry thereby driving the growth of the global market.

PURCHASE OPTIONS

Call or Email us

U.S.-Canada Toll-free: +1-800-792-5285
Int'l : +1-503-894-6022
Europe : +44-845-528-1300
Email : help@alliedmarketresearch.com
 
FREQUENTLY ASKED QUESTIONS?

A. North America is the largest regional market in the global nitrile gloves market owing to the continuously growing demand across different end-use industries, predominantly in the healthcare and medical sector.

A. The major application of nitrile gloves is found in the medical and healthcare sectors. In addition, owing to latex-free formulation, nitrile gloves are suitable to be used with health professionals that are prone to Type I allergies.

A. The global nitrile gloves market is projected to reach $16.9 billion by 2031, growing at a CAGR of 6.1% from 2022 to 2031.

A. Keeping hand clean and healthy hand skin condition is challenging for clinicians. Health professionals tend to wear gloves and are prone to an increased risk of hand dermatitis. This is the key market trend in the nitrile gloves market.

A. The major companies profiled in this report include Adventa Berhad, ANSELL LTD, Carolina Glove & Safety Company, Dynarex Corporation, Kossan Rubber Industries Bhd, MCR Safety, Medline Industries, LP, Rubberex Corporation (M) Berhad, Superior Glove, Top Glove Corporation Bhd, Unigloves (Uk), and Hartalega Holdings Berhad.

Looking for Customization?

 Customization Request

Have a Question?

 Speak with Analyst

Any Confusion?

 Inquire Before Buying

Have a glance of the Report

  Request Sample
RELATED TAGS

Purchase Full Report of
Nitrile Gloves Market

Start reading instantly.
This Report and over 68,113+ more Reports, Available with Avenue Library. T&C*.

  • Online Only
  • $3,570
  • Online cloud access only
  • Restricted print, copy, paste & download
  • Read only
  • Free industry update
    (Within 180 days)
  • Free report update in next update cycle
    (Aug 2023 - Aug 2024)
  • Data Pack
  • $3,840
  • Restricted to one authorized user
  • One print only
  • Available in
    Excel
  • Free industry update
    (Within 180 days)
  •   Free report update in next update cycle
    (Aug 2023 - Aug 2024)
  • Single User
  • $5,730
  • Restricted to one authorized user
  • One print only
  • Available in
    PDF
  • Free industry update
    (Within 180 days)
  •   Free report update in next update cycle
    (Aug 2023 - Aug 2024)
  • Five Users
  • $6,450
  • Limited to five authorized users
  • Print upto five copies
  • Available in
    PDF
  • Free industry update
    (Within 180 days)
  •   Free report update in next update cycle
    (Aug 2023 - Aug 2024)
  • Enterprise
    License/PDF

  • $9,600
  • Unlimited
    within
    company/enterprise
  • Available in Excel & PDF
  • Free industry update
    (Within 180 days)
  •   Free report update in next update cycle
    (Aug 2023 - Aug 2024)
  • Library
    Membership

  • $999 $ 1,175
    Per User/ Per month/ Billed annually
  • Published Content
    E-access
  • Company Profiles
    E-access
  • Newly Added Content Access
  • 10 PDF
    Downloads
  • 5 Excel Data
    Pack Downloads
  • 250 Company Profiles PDF Downloads
  • Buy Now

*Taxes/Fees, if applicable will be added during checkout. All prices in USD

RELATED REPORTS
 

Why Allied Market Research?


Infallible Methodology

To ensure high-level data integrity, accurate analysis, and impeccable forecasts

Analyst Support

For complete satisfaction

Customization

On-demand customization of scope of the report to exactly meet your needs

TARGETED MARKET VIEW

Targeted market view to provide pertinent information and save time of readers

Get fresh content delivered

Get insights on topics that are crucial for your business. Stay abreast of your interest areas.

Get Industry Data Alerts

Why Allied Market Research?

Infallible Methodology

To ensure high-level data integrity, accurate analysis, and impeccable forecasts

Analyst Support

For complete satisfaction

Customization

On-demand customization of scope of the report to exactly meet your needs

TARGETED MARKET VIEW

Targeted market view to provide pertinent information and save time of readers