0
2022
Nitrogen Oxide Control Systems Market

Nitrogen Oxide Control Systems Market

by Technology (Selective Catalytic Reduction (SCR), Selective Non-Catalytic Reduction (SNCR), Low NOx Burner, Fuel Reburning, Others), by Application (Transportation, Industrial, Power generation & energy, Chemical, Others): Global Opportunity Analysis and Industry Forecast, 2020-2030

✷  Report Code: A00832
Apr 2022 | Pages: 240
Tables: 124
Charts: 81
  • Formats*:

  • pdf

    Single User License, Five User
    License & Enterprise User License

  • xls

    Data Pack Excel License

  • ppt

    It comes with the additional cost
    of $2500.00 contact sales.


Nitrogen Oxide Control Systems Market Research, 2030

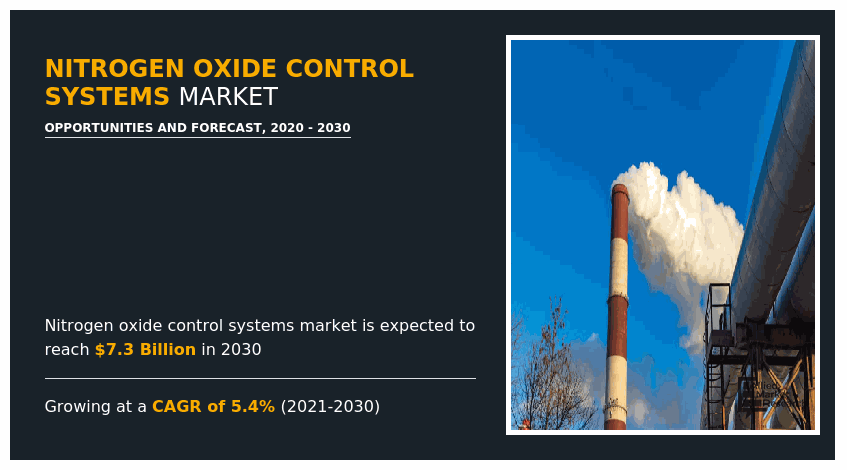
The global nitrogen oxide control systems market size was valued at $4.3 billion in 2020, and is projected to reach $7.3 billion by 2030, growing at a CAGR of 5.4% from 2021 to 2030.

Nitrogen Oxides are a family of poisonous and highly reactive gases. These gases form when fuel is burned at high temperatures. NOx pollution is emitted by automobiles, trucks, and various non-road vehicles (e.g., construction equipment & boats) as well as industrial sources such as power plants, industrial boilers, cement kilns, and turbines. NOx often appears as a brownish gas. It is a strong oxidizing agent and plays a major role in the atmospheric reactions with volatile organic compounds (VOC) that produce ozone (smog) on hot summer days. As nitrogen oxide is quite harmful to all living being, it is required to be controlled. There are various methods to control nitrogen oxide. Some of the methods are fuel switching, fuel pre-treatment, combustion (or chemical process) modification and flue (or tail) gas denitrification. In addition, various key players offer nitrogen oxide control system, which continuously monitors feedback from the NOx sensor(s) and regulates the system response by proportionally adjusting liquid and air flow to the injector nozzles.

Some control system of nitrogen oxide are combustion control, choice of fuel, process modification, Reburning, low NOx burners, flue gas recirculation (FGR), staged combustion (off-stoichiometric combustion), reduced air preheat & reduced firing rates, water or steam injection, low-excess-air firing (LEA), flue gas treatment, selective catalytic reduction (SCR), and selective non-catalytic reduction (SNCR).
Nitrogen Oxide Control Systems Market, Nitrogen Oxide Control Systems Industry, Nitrogen Oxide Control Systems Market Size, Nitrogen Oxide Control Systems Market Share, Nitrogen Oxide Control Systems Market Forecast, Nitrogen Oxide Control Systems Market Analysis, Nitrogen Oxide Control Systems Market Trends, Nitrogen Oxide Control Systems Market Growth

The nitrogen oxide control systems industry is segmented on the basis of technology and application. By technology, it is classified as Selective Catalytic Reduction (SCR), Selective Non-Catalytic Reduction (SNCR), Low NOx Burner, Fuel Reburning, and Others. By application, it is categorized as transportation, industrial application, power generation & energy chemical, and others. By region, the market is analyzed across North America, Europe, Asia-Pacific, and LAMEA.

The key players profiled in this report include Babcock & Wilcox Enterprises, Inc., CECO Environmental, Ducon Technologies Inc., Fuel Tech, Honeywell International Inc., John Wood Group plc, Mitsubishi Hitachi Power Systems, Ltd., S.A. HAMON, Siemens AG and The Shell Group

Nitrogen Oxide Control Systems Market

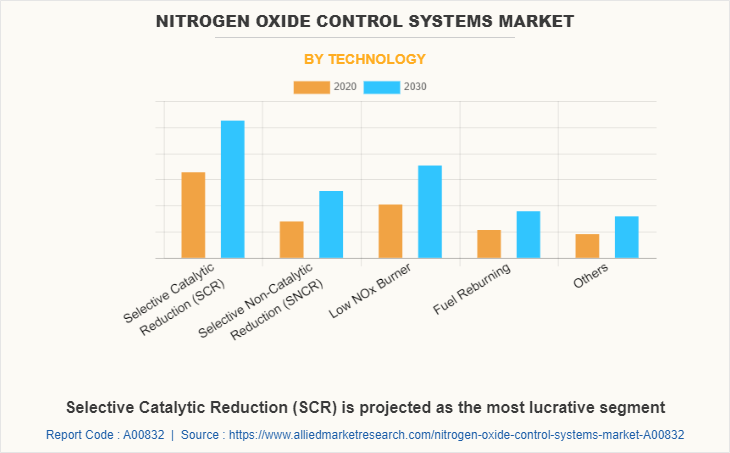
By technology, Selective Catalytic Reduction (SCR) segment dominated the global nitrogen oxide control systems market share in 2020, and is projected to remain the fastest-growing segment during the forecast period. This is attributed due to its fuel mixing characteristic. In addition, Low NOx burners are designed to control air and fuel mixing at each burner, which creates more branched and larger flames. By reducing the peak flame temperature, significantly less NOx is formed in the process.
Nitrogen Oxide Control Systems Market

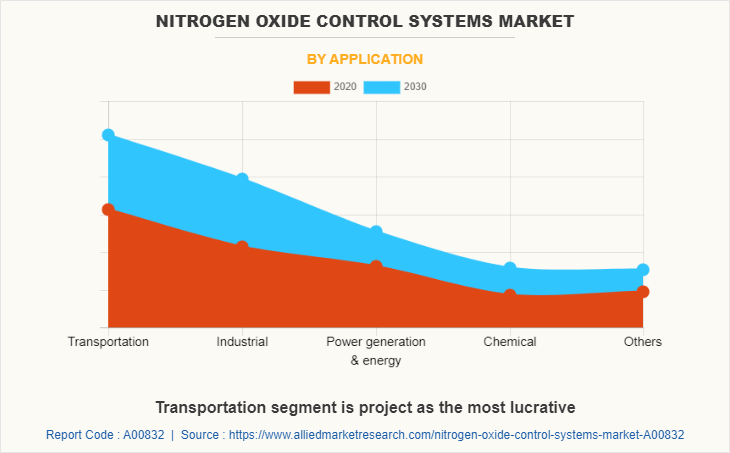
By Application, the transportation segment dominated the global nitrogen oxide control systems market in 2020, and is projected to remain the fastest-growing segment during the forecast period as emissions can be reduced by making process changes (such as modifications to the combustion process) or by installing air pollution control equipment (such as selective non-catalytic reduction (SNCR) or selective catalytic reduction (SCR)).
Nitrogen Oxide Control Systems Market

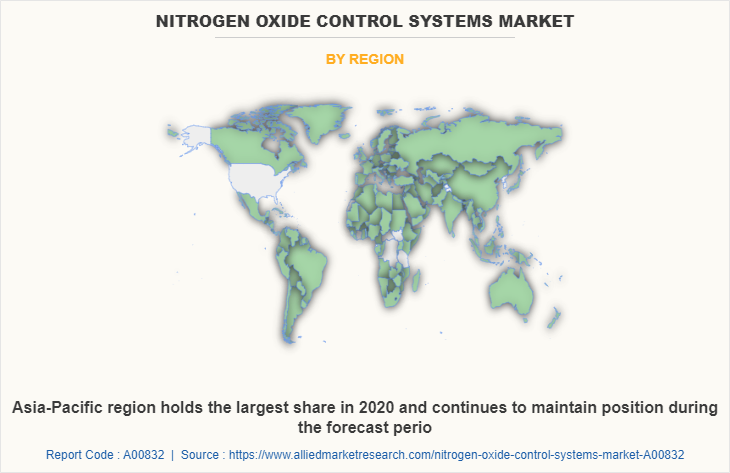
By region, Asia-Pacific dominated the nitrogen oxide control systems market size in 2020, and is projected to remain the fastest-growing segment during the nitrogen oxide control systems marketforecast period. This is attributed to numerous factors such as large population and industries in the region.

Import and export activities were significantly impacted, which, in turn, adversely affected the industries using nitrogen oxide control systems and thereby affected the nitrogen oxide control systems market.
Key Benefits For Stakeholders

  • This report provides a quantitative analysis of the market segments, current trends, estimations, and dynamics of the nitrogen oxide control systems market analysis from 2020 to 2030 to identify the prevailing nitrogen oxide control systems market opportunities.
  • The market research is offered along with information related to key drivers, restraints, and opportunities.
  • Porter's five forces analysis highlights the potency of buyers and suppliers to enable stakeholders make profit-oriented business decisions and strengthen their supplier-buyer network.
  • In-depth analysis of the nitrogen oxide control systems market segmentation assists to determine the prevailing market opportunities.
  • Major countries in each region are mapped according to their revenue contribution to the global market.
  • Market player positioning facilitates benchmarking and provides a clear understanding of the present position of the market players.
  • The report includes the analysis of the regional as well as global nitrogen oxide control systems market growth, key players, market segments, application areas, and market growth strategies.

IMPACT OF COVID-19 ON THE GLOBAL NITROGEN OXIDE CONTROL SYSTEMS MARKET

  • COVID-19 impacted almost all industries by hindering various industrial operations and disrupting the supply chain. Maximum companies halted their operation due to fewer workforces. However, there is a sluggish decline in the global nitrogen oxide control systems market due to impact of COVID-19.
  • Furthermore, import and export activities were significantly impacted, which, in turn, adversely affected the industries using nitrogen oxide control systems and thereby affecting the nitrogen oxide control systems market.

Nitrogen Oxide Control Systems Market Report Highlights

Aspects Details
By Technology
  • Selective Catalytic Reduction (SCR)
  • Selective Non-Catalytic Reduction (SNCR)
  • Low NOx Burner
  • Fuel Reburning
  • Others
By Application
  • Power generation & energy
  • Chemical
  • Others
  • Transportation
  • Industrial
By Region
  • North America  (U.S., Canada, Mexico)
  • Europe  (Germany, France, U.K., Italy, Spain, Rest of Europe)
  • Asia-Pacific  (China, Japan, India, Australia, South Korea, Rest of Asia-Pacific)
  • LAMEA  (Brazil, Saudi Arabia, South Africa, Rest of LAMEA)
Key Market Players The Shell Group, Mitsubishi Hitachi Power Systems, Ltd, Honeywell International Inc., John Wood Group plc,, Babcock & Wilcox Enterprises, Inc., Siemens AG, Ducon Technologies Inc., CECO Environmental, S.A. HAMON, Fuel Tech
 
  • CHAPTER 1:INTRODUCTION

    • 1.1.Report description

    • 1.2.Key market segments

    • 1.3.Key benefits to the stakeholders

    • 1.4.Research Methodology

      • 1.4.1.Secondary research

      • 1.4.2.Primary research

      • 1.4.3.Analyst tools and models

  • CHAPTER 2:EXECUTIVE SUMMARY

    • 2.1.Key findings of the study

    • 2.2.CXO Perspective

  • CHAPTER 3:MARKET OVERVIEW

    • 3.1.Market definition and scope

    • 3.2.Key findings

      • 3.2.1.Top investment pockets

    • 3.3.Porter’s five forces analysis

    • 3.4.Top player positioning

    • 3.5.Market dynamics

      • 3.5.1.Drivers

      • 3.5.2.Restraints

      • 3.5.3.Opportunities

    • 3.6.COVID-19 Impact Analysis on the market

  • CHAPTER 4: NITROGEN OXIDE CONTROL SYSTEMS MARKET, BY TECHNOLOGY

    • 4.1 Overview

      • 4.1.1 Market size and forecast

    • 4.2 Selective Catalytic Reduction (SCR)

      • 4.2.1 Key market trends, growth factors and opportunities

      • 4.2.2 Market size and forecast, by region

      • 4.2.3 Market analysis by country

    • 4.3 Selective Non-Catalytic Reduction (SNCR)

      • 4.3.1 Key market trends, growth factors and opportunities

      • 4.3.2 Market size and forecast, by region

      • 4.3.3 Market analysis by country

    • 4.4 Low NOx Burner

      • 4.4.1 Key market trends, growth factors and opportunities

      • 4.4.2 Market size and forecast, by region

      • 4.4.3 Market analysis by country

    • 4.5 Fuel Reburning

      • 4.5.1 Key market trends, growth factors and opportunities

      • 4.5.2 Market size and forecast, by region

      • 4.5.3 Market analysis by country

    • 4.6 Others

      • 4.6.1 Key market trends, growth factors and opportunities

      • 4.6.2 Market size and forecast, by region

      • 4.6.3 Market analysis by country

  • CHAPTER 5: NITROGEN OXIDE CONTROL SYSTEMS MARKET, BY APPLICATION

    • 5.1 Overview

      • 5.1.1 Market size and forecast

    • 5.2 Transportation

      • 5.2.1 Key market trends, growth factors and opportunities

      • 5.2.2 Market size and forecast, by region

      • 5.2.3 Market analysis by country

    • 5.3 Industrial

      • 5.3.1 Key market trends, growth factors and opportunities

      • 5.3.2 Market size and forecast, by region

      • 5.3.3 Market analysis by country

    • 5.4 Power generation & energy

      • 5.4.1 Key market trends, growth factors and opportunities

      • 5.4.2 Market size and forecast, by region

      • 5.4.3 Market analysis by country

    • 5.5 Chemical

      • 5.5.1 Key market trends, growth factors and opportunities

      • 5.5.2 Market size and forecast, by region

      • 5.5.3 Market analysis by country

    • 5.6 Others

      • 5.6.1 Key market trends, growth factors and opportunities

      • 5.6.2 Market size and forecast, by region

      • 5.6.3 Market analysis by country

  • CHAPTER 6: NITROGEN OXIDE CONTROL SYSTEMS MARKET, BY REGION

    • 6.1 Overview

      • 6.1.1 Market size and forecast

    • 6.2 North America

      • 6.2.1 Key trends and opportunities

      • 6.2.2 North America Market size and forecast, by Technology

      • 6.2.3 North America Market size and forecast, by Application

      • 6.2.4 North America Market size and forecast, by country

        • 6.2.4.1 U.S.
          • 6.2.4.1.1 Market size and forecast, by Technology
          • 6.2.4.1.2 Market size and forecast, by Application
        • 6.2.4.2 Canada
          • 6.2.4.2.1 Market size and forecast, by Technology
          • 6.2.4.2.2 Market size and forecast, by Application
        • 6.2.4.3 Mexico
          • 6.2.4.3.1 Market size and forecast, by Technology
          • 6.2.4.3.2 Market size and forecast, by Application
    • 6.3 Europe

      • 6.3.1 Key trends and opportunities

      • 6.3.2 Europe Market size and forecast, by Technology

      • 6.3.3 Europe Market size and forecast, by Application

      • 6.3.4 Europe Market size and forecast, by country

        • 6.3.4.1 Germany
          • 6.3.4.1.1 Market size and forecast, by Technology
          • 6.3.4.1.2 Market size and forecast, by Application
        • 6.3.4.2 France
          • 6.3.4.2.1 Market size and forecast, by Technology
          • 6.3.4.2.2 Market size and forecast, by Application
        • 6.3.4.3 U.K.
          • 6.3.4.3.1 Market size and forecast, by Technology
          • 6.3.4.3.2 Market size and forecast, by Application
        • 6.3.4.4 Italy
          • 6.3.4.4.1 Market size and forecast, by Technology
          • 6.3.4.4.2 Market size and forecast, by Application
        • 6.3.4.5 Spain
          • 6.3.4.5.1 Market size and forecast, by Technology
          • 6.3.4.5.2 Market size and forecast, by Application
        • 6.3.4.6 Rest of Europe
          • 6.3.4.6.1 Market size and forecast, by Technology
          • 6.3.4.6.2 Market size and forecast, by Application
    • 6.4 Asia-Pacific

      • 6.4.1 Key trends and opportunities

      • 6.4.2 Asia-Pacific Market size and forecast, by Technology

      • 6.4.3 Asia-Pacific Market size and forecast, by Application

      • 6.4.4 Asia-Pacific Market size and forecast, by country

        • 6.4.4.1 China
          • 6.4.4.1.1 Market size and forecast, by Technology
          • 6.4.4.1.2 Market size and forecast, by Application
        • 6.4.4.2 Japan
          • 6.4.4.2.1 Market size and forecast, by Technology
          • 6.4.4.2.2 Market size and forecast, by Application
        • 6.4.4.3 India
          • 6.4.4.3.1 Market size and forecast, by Technology
          • 6.4.4.3.2 Market size and forecast, by Application
        • 6.4.4.4 Australia
          • 6.4.4.4.1 Market size and forecast, by Technology
          • 6.4.4.4.2 Market size and forecast, by Application
        • 6.4.4.5 South Korea
          • 6.4.4.5.1 Market size and forecast, by Technology
          • 6.4.4.5.2 Market size and forecast, by Application
        • 6.4.4.6 Rest of Asia-Pacific
          • 6.4.4.6.1 Market size and forecast, by Technology
          • 6.4.4.6.2 Market size and forecast, by Application
    • 6.5 LAMEA

      • 6.5.1 Key trends and opportunities

      • 6.5.2 LAMEA Market size and forecast, by Technology

      • 6.5.3 LAMEA Market size and forecast, by Application

      • 6.5.4 LAMEA Market size and forecast, by country

        • 6.5.4.1 Brazil
          • 6.5.4.1.1 Market size and forecast, by Technology
          • 6.5.4.1.2 Market size and forecast, by Application
        • 6.5.4.2 Saudi Arabia
          • 6.5.4.2.1 Market size and forecast, by Technology
          • 6.5.4.2.2 Market size and forecast, by Application
        • 6.5.4.3 South Africa
          • 6.5.4.3.1 Market size and forecast, by Technology
          • 6.5.4.3.2 Market size and forecast, by Application
        • 6.5.4.4 Rest of LAMEA
          • 6.5.4.4.1 Market size and forecast, by Technology
          • 6.5.4.4.2 Market size and forecast, by Application
  • CHAPTER 7: COMPANY LANDSCAPE

    • 7.1. Introduction

    • 7.2. Top winning strategies

    • 7.3. Product Mapping of Top 10 Player

    • 7.4. Competitive Dashboard

    • 7.5. Competitive Heatmap

    • 7.6. Key developments

  • CHAPTER 8: COMPANY PROFILES

    • 8.1 Ducon Technologies Inc.

      • 8.1.1 Company overview

      • 8.1.2 Company snapshot

      • 8.1.3 Operating business segments

      • 8.1.4 Product portfolio

      • 8.1.5 Business performance

      • 8.1.6 Key strategic moves and developments

    • 8.2 Mitsubishi Hitachi Power Systems, Ltd

      • 8.2.1 Company overview

      • 8.2.2 Company snapshot

      • 8.2.3 Operating business segments

      • 8.2.4 Product portfolio

      • 8.2.5 Business performance

      • 8.2.6 Key strategic moves and developments

    • 8.3 Siemens AG

      • 8.3.1 Company overview

      • 8.3.2 Company snapshot

      • 8.3.3 Operating business segments

      • 8.3.4 Product portfolio

      • 8.3.5 Business performance

      • 8.3.6 Key strategic moves and developments

    • 8.4 Babcock & Wilcox Enterprises, Inc.

      • 8.4.1 Company overview

      • 8.4.2 Company snapshot

      • 8.4.3 Operating business segments

      • 8.4.4 Product portfolio

      • 8.4.5 Business performance

      • 8.4.6 Key strategic moves and developments

    • 8.5 CECO Environmental

      • 8.5.1 Company overview

      • 8.5.2 Company snapshot

      • 8.5.3 Operating business segments

      • 8.5.4 Product portfolio

      • 8.5.5 Business performance

      • 8.5.6 Key strategic moves and developments

    • 8.6 Fuel Tech

      • 8.6.1 Company overview

      • 8.6.2 Company snapshot

      • 8.6.3 Operating business segments

      • 8.6.4 Product portfolio

      • 8.6.5 Business performance

      • 8.6.6 Key strategic moves and developments

    • 8.7 Honeywell International Inc.

      • 8.7.1 Company overview

      • 8.7.2 Company snapshot

      • 8.7.3 Operating business segments

      • 8.7.4 Product portfolio

      • 8.7.5 Business performance

      • 8.7.6 Key strategic moves and developments

    • 8.8 John Wood Group plc,

      • 8.8.1 Company overview

      • 8.8.2 Company snapshot

      • 8.8.3 Operating business segments

      • 8.8.4 Product portfolio

      • 8.8.5 Business performance

      • 8.8.6 Key strategic moves and developments

    • 8.9 S.A. HAMON

      • 8.9.1 Company overview

      • 8.9.2 Company snapshot

      • 8.9.3 Operating business segments

      • 8.9.4 Product portfolio

      • 8.9.5 Business performance

      • 8.9.6 Key strategic moves and developments

    • 8.10 The Shell Group

      • 8.10.1 Company overview

      • 8.10.2 Company snapshot

      • 8.10.3 Operating business segments

      • 8.10.4 Product portfolio

      • 8.10.5 Business performance

      • 8.10.6 Key strategic moves and developments

  • LIST OF TABLES

  • TABLE 01. GLOBAL NITROGEN OXIDE CONTROL SYSTEMS, BY TECHNOLOGY, 2020–2030 ($MILLION)
    TABLE 02. GLOBAL NITROGEN OXIDE CONTROL SYSTEMS, BY APPLICATION 2020–2030 ($MILLION)
    TABLE 03. NORTH AMERICA NITROGEN OXIDE CONTROL SYSTEMS MARKET, BY REGION 2020–2030 ($MILLION)
    TABLE 04. NORTH AMERICA NITROGEN OXIDE CONTROL SYSTEMS, BY TECHNOLOGY, 2020–2030 ($MILLION)
    TABLE 05. NORTH AMERICA NITROGEN OXIDE CONTROL SYSTEMS, BY APPLICATION 2020–2030 ($MILLION)
    TABLE 06. NORTH AMERICA NITROGEN OXIDE CONTROL SYSTEMS, BY APPLICATION 2020–2030 ($MILLION)
    TABLE 07. NORTH AMERICA NITROGEN OXIDE CONTROL SYSTEMS MARKET, BY COUNTRY 2020–2030 ($MILLION)
    TABLE 08. U.S. NITROGEN OXIDE CONTROL SYSTEMS, BY TECHNOLOGY, 2020–2030 ($MILLION)
    TABLE 09. U.S. NITROGEN OXIDE CONTROL SYSTEMS, BY APPLICATION 2020–2030 ($MILLION)
    TABLE 10. U.S. NITROGEN OXIDE CONTROL SYSTEMS, BY APPLICATION 2020–2030 (MILLION LITER)
    TABLE 11. U.S. NITROGEN OXIDE CONTROL SYSTEMS, BY APPLICATION 2020–2030 ($MILLION)
    TABLE 12. CANADA NITROGEN OXIDE CONTROL SYSTEMS, BY TECHNOLOGY, 2020–2030 ($MILLION)
    TABLE 13. CANADA NITROGEN OXIDE CONTROL SYSTEMS, BY APPLICATION 2020–2030 ($MILLION)
    TABLE 14. MEXICO NITROGEN OXIDE CONTROL SYSTEMS, BY TECHNOLOGY, 2020–2030 ($MILLION)
    TABLE 15. MEXICO NITROGEN OXIDE CONTROL SYSTEMS, BY APPLICATION 2020–2030 ($MILLION)
    TABLE 16. EUROPE NITROGEN OXIDE CONTROL SYSTEMS, BY TECHNOLOGY, 2020–2030 ($MILLION)
    TABLE 17. EUROPE NITROGEN OXIDE CONTROL SYSTEMS, BY APPLICATION 2020–2030 ($MILLION)
    TABLE 18. FRANCE NITROGEN OXIDE CONTROL SYSTEMS, BY TECHNOLOGY, 2020–2030 ($MILLION)
    TABLE 19. FRANCE NITROGEN OXIDE CONTROL SYSTEMS, BY APPLICATION 2020–2030 ($MILLION)
    TABLE 20. GERMANY NITROGEN OXIDE CONTROL SYSTEMS, BY TECHNOLOGY, 2020–2030 ($MILLION)
    TABLE 21. GERMANY NITROGEN OXIDE CONTROL SYSTEMS, BY APPLICATION 2020–2030 ($MILLION)
    TABLE 22. ITALY NITROGEN OXIDE CONTROL SYSTEMS, BY TECHNOLOGY, 2020–2030 ($MILLION)
    TABLE 23. ITALY NITROGEN OXIDE CONTROL SYSTEMS, BY APPLICATION 2020–2030 ($MILLION)
    TABLE 24. SPAIN NITROGEN OXIDE CONTROL SYSTEMS, BY TECHNOLOGY, 2020–2030 ($MILLION)
    TABLE 25. SPAIN NITROGEN OXIDE CONTROL SYSTEMS, BY APPLICATION 2020–2030 ($MILLION)
    TABLE 26. UK NITROGEN OXIDE CONTROL SYSTEMS, BY TECHNOLOGY, 2020–2030 ($MILLION)
    TABLE 27. UK NITROGEN OXIDE CONTROL SYSTEMS, BY APPLICATION 2020–2030 ($MILLION)
    TABLE 28. REST OF EUROPE NITROGEN OXIDE CONTROL SYSTEMS, BY TECHNOLOGY, 2020–2030 ($MILLION)
    TABLE 29. REST OF EUROPE NITROGEN OXIDE CONTROL SYSTEMS, BY APPLICATION 2020–2030 ($MILLION)
    TABLE 30. ASIA-PACIFIC NITROGEN OXIDE CONTROL SYSTEMS, BY TECHNOLOGY, 2020–2030 ($MILLION)
    TABLE 31. ASIA-PACIFIC NITROGEN OXIDE CONTROL SYSTEMS, BY APPLICATION 2020–2030 ($MILLION)
    TABLE 32. ASIA-PACIFIC NITROGEN OXIDE CONTROL SYSTEMS MARKET, BY COUNTRY 2020–2030 ($MILLION)
    TABLE 33. CHINA NITROGEN OXIDE CONTROL SYSTEMS, BY TECHNOLOGY, 2020–2030 ($MILLION)
    TABLE 34. CHINA NITROGEN OXIDE CONTROL SYSTEMS, BY APPLICATION 2020–2030 ($MILLION)
    TABLE 35. JAPAN NITROGEN OXIDE CONTROL SYSTEMS, BY TECHNOLOGY, 2020–2030 ($MILLION)
    TABLE 36. JAPAN NITROGEN OXIDE CONTROL SYSTEMS, BY APPLICATION 2020–2030 ($MILLION)
    TABLE 37. JAPAN NITROGEN OXIDE CONTROL SYSTEMS, BY APPLICATION 2020–2030 ($MILLION)
    TABLE 38. INDIAN NITROGEN OXIDE CONTROL SYSTEMS, BY TECHNOLOGY, 2020–2030 ($MILLION)
    TABLE 39. INDIAN NITROGEN OXIDE CONTROL SYSTEMS, BY APPLICATION 2020–2030 ($MILLION)
    TABLE 40. SOUTH KOREA NITROGEN OXIDE CONTROL SYSTEMS, BY TECHNOLOGY, 2020–2030 ($MILLION)
    TABLE 41. SOUTH KOREA NITROGEN OXIDE CONTROL SYSTEMS, BY APPLICATION 2020–2030 ($MILLION)
    TABLE 42. AUSTRALIA NITROGEN OXIDE CONTROL SYSTEMS, BY TECHNOLOGY, 2020–2030 ($MILLION)
    TABLE 43. AUSTRALIA NITROGEN OXIDE CONTROL SYSTEMS, BY APPLICATION 2020–2030 ($MILLION)
    TABLE 44. REST OF ASIA-PACIFIC NITROGEN OXIDE CONTROL SYSTEMS, BY TECHNOLOGY, 2020–2030 ($MILLION)
    TABLE 45. REST OF ASIA-PACIFIC NITROGEN OXIDE CONTROL SYSTEMS, BY APPLICATION 2020–2030 ($MILLION)
    TABLE 46. LAMEA NITROGEN OXIDE CONTROL SYSTEMS, BY TECHNOLOGY, 2020–2030 ($MILLION)
    TABLE 47. LAMEA NITROGEN OXIDE CONTROL SYSTEMS, BY APPLICATION 2020–2030 ($MILLION)
    TABLE 48. LAMEA NITROGEN OXIDE CONTROL SYSTEMS MARKET, BY COUNTRY 2020–2030 ($MILLION)
    TABLE 49. BRAZIL NITROGEN OXIDE CONTROL SYSTEMS, BY TECHNOLOGY, 2020–2030 ($MILLION)
    TABLE 50. BRAZIL NITROGEN OXIDE CONTROL SYSTEMS, BY APPLICATION 2020–2030 ($MILLION)
    TABLE 51. SOUTH AFRICA NITROGEN OXIDE CONTROL SYSTEMS, BY TECHNOLOGY, 2020–2030 ($MILLION)
    TABLE 52. SOUTH AFRICA NITROGEN OXIDE CONTROL SYSTEMS, BY APPLICATION 2020–2030 ($MILLION)
    TABLE 53. SAUDI ARABIA NITROGEN OXIDE CONTROL SYSTEMS, BY TECHNOLOGY, 2020–2030 ($MILLION)
    TABLE 54. SAUDI ARABIA NITROGEN OXIDE CONTROL SYSTEMS, BY APPLICATION 2020–2030 ($MILLION)
    TABLE 55. REST OF LAMEA NITROGEN OXIDE CONTROL SYSTEMS, BY TECHNOLOGY, 2020–2030 ($MILLION)
    TABLE 56. REST OF LAMEA NITROGEN OXIDE CONTROL SYSTEMS, BY APPLICATION 2020–2030 ($MILLION)
    TABLE 57. KEY NEW PRODUCT LAUNCHES (2016-2020)
    TABLE 58. KEY AGREEMENT (2016-2020)
    TABLE 59. KEY PARTNERSHIPS (2016-2020)
    TABLE 60. KEY ACQUISITION (2016-2020)
    TABLE 61. KEY BUSINESS EXPANSIONS (2016-2020)
    TABLE 62. BABCOCK & WILCOX ENTERPRISES, INC: COMPANY SNAPSHOT
    TABLE 63. BABCOCK & WILCOX ENTERPRISES, INC: KEY EXECUTIVES
    TABLE 64. BABCOCK & WILCOX ENTERPRISES, INC: OPERATING SEGMENTS
    TABLE 65. BABCOCK & WILCOX ENTERPRISES, INC: PRODUCT PORTFOLIO
    TABLE 66. OVERALL FINANCIAL STATUS ($MILLION)
    TABLE 67. CECO ENVIRONMENTAL: COMPANY SNAPSHOT
    TABLE 68. CECO ENVIRONMENTAL: KEY EXECUTIVES
    TABLE 69. CECO ENVIRONMENTAL: OPERATING SEGMENTS
    TABLE 70. CECO ENVIRONMENTAL: PRODUCT PORTFOLIO
    TABLE 71. OVERALL FINANCIAL STATUS ($MILLION)
    TABLE 72. DUCON TECHNOLOGIES INC: COMPANY SNAPSHOT
    TABLE 73. DUCON TECHNOLOGIES INC: KEY EXECUTIVES
    TABLE 74. DUCON TECHNOLOGIES INC: PRODUCT PORTFOLIO
    TABLE 75. OVERALL FINANCIAL STATUS ($MILLION)
    TABLE 76. FUEL TECH: COMPANY SNAPSHOT
    TABLE 77. FUEL TECH: KEY EXECUTIVES
    TABLE 78. FUEL TECH: OPERATING SEGMENTS
    TABLE 79. FUEL TECH: PRODUCT PORTFOLIO
    TABLE 80. OVERALL FINANCIAL STATUS ($MILLION)
    TABLE 81. FUEL TECH: KEY STRATEGIC MOVES AND DEVELOPMENTS
    TABLE 82. HONEYWELL INTERNATIONAL INC: COMPANY SNAPSHOT
    TABLE 83. HONEYWELL INTERNATIONAL INC: KEY EXECUTIVES
    TABLE 84. HONEYWELL INTERNATIONAL INC: OPERATING SEGMENTS
    TABLE 85. HONEYWELL INTERNATIONAL INC: PRODUCT PORTFOLIO
    TABLE 86. JOHN WOOD GROUP PLC: COMPANY SNAPSHOT
    TABLE 87. JOHN WOOD GROUP PLC: KEY EXECUTIVES
    TABLE 88. JOHN WOOD GROUP PLC: OPERATING SEGMENTS
    TABLE 89. JOHN WOOD GROUP PLC: PRODUCT PORTFOLIO
    TABLE 90. OVERALL FINANCIAL STATUS ($MILLION)
    TABLE 91. JOHN WOOD GROUP PLC: KEY STRATEGIC MOVES AND DEVELOPMENTS
    TABLE 92. MITSUBISHI HITACHI POWER SYSTEM: COMPANY SNAPSHOT
    TABLE 93. MITSUBISHI HITACHI POWER SYSTEM: KEY EXECUTIVES
    TABLE 94. MITSUBISHI HITACHI POWER SYSTEM: OPERATING SEGMENTS
    TABLE 95. MITSUBISHI HITACHI POWER SYSTEM: PRODUCT PORTFOLIO
    TABLE 96. OVERALL FINANCIAL STATUS ($MILLION)
    TABLE 97. MITSUBISHI HITACHI POWER SYSTEM: KEY STRATEGIC MOVES AND DEVELOPMENTS
    TABLE 98. S.A. HAMON: COMPANY SNAPSHOT
    TABLE 99. S.A. HAMON: KEY EXECUTIVES
    TABLE 100. S.A. HAMON: OPERATING SEGMENTS
    TABLE 101. S.A. HAMON: PRODUCT PORTFOLIO
    TABLE 102. OVERALL FINANCIAL STATUS ($MILLION)
    TABLE 103. SIEMENS AG: COMPANY SNAPSHOT
    TABLE 104. SIEMENS AG: KEY EXECUTIVES
    TABLE 105. SIEMENS AG: OPERATING SEGMENTS
    TABLE 106. SIEMENS AG: PRODUCT PORTFOLIO
    TABLE 107. OVERALL FINANCIAL STATUS ($MILLION)
    TABLE 108. THE SHELL GROUP: COMPANY SNAPSHOT
    TABLE 109. THE SHELL GROUP: KEY EXECUTIVES
    TABLE 110. THE SHELL GROUP: OPERATING SEGMENTS
    TABLE 111. THE SHELL GROUP: PRODUCT PORTFOLIO
    TABLE 112. OVERALL FINANCIAL STATUS ($MILLION)
  • LIST OF FIGURES

  • FIGURE 01. GLOBAL NITROGEN OXIDE CONTROL SYSTEMS MARKET SNAPSHOT, BY SEGMENTATION, 2021–2030
    FIGURE 02. GLOBAL NITROGEN OXIDE CONTROL SYSTEMS MARKET SNAPSHOT, BY REGION, 2021–2030
    FIGURE 03. GLOBAL NITROGEN OXIDE CONTROL SYSTEMS MARKET SEGMENTATION
    FIGURE 04. TOP INVESTMENT POCKETS
    FIGURE 05. MODERATE BARSGAINING POWER OF SUPPLIERS
    FIGURE 06. MODERATE THREAT OF NEW ENTRANTS
    FIGURE 07. MODERATE THREAT OF SUBSTITUTES
    FIGURE 08. MODERATE INTENSITY OF COMPETITIVE RIVALRY
    FIGURE 09. MODERATE BARSGAINING POWER OF BUYERS
    FIGURE 10. GLOBAL NITROGEN OXIDE CONTROL SYSTEMS MARKET DYNAMICS
    FIGURE 11. VALUE CHAIN ANALYSIS
    FIGURE 12. GLOBAL NITROGEN OXIDE CONTROL SYSTEMS REVENUE, BY TECHNOLOGY ($MILLION)
    FIGURE 14. MARKET SIZE AND FORECAST, 2020-2030 ($MILLION)
    FIGURE 15. MARKET SIZE AND FORECAST, 2020-2030 ($MILLION)
    FIGURE 16. MARKET SIZE AND FORECAST, 2020-2030 ($MILLION)
    FIGURE 17. MARKET SIZE AND FORECAST, 2020-2030 ($MILLION)
    FIGURE 18. MARKET SIZE AND FORECAST, 2020-2030 ($MILLION)
    FIGURE 19. GLOBAL NITROGEN OXIDE CONTROL SYSTEMS REVENUE, BY APPLICATION ($MILLION)
    FIGURE 20. MARKET SIZE AND FORECAST, 2020-2030 ($MILLION)
    FIGURE 21. MARKET SIZE AND FORECAST, 2020-2030 ($MILLION)
    FIGURE 22. MARKET SIZE AND FORECAST, 2020-2030 ($MILLION)
    FIGURE 23. MARKET SIZE AND FORECAST, 2020-2030 ($MILLION)
    FIGURE 24. MARKET SIZE AND FORECAST, 2020-2030 ($MILLION)
    FIGURE 25. MARKET SIZE AND FORECAST, 2020-2030 ($MILLION)
    FIGURE 26. GLOBAL NITROGEN OXIDE CONTROL SYSTEMS MARKET REVENUE, BY REGION ($MILLION)
    FIGURE 27. U.S. NITROGEN OXIDE CONTROL SYSTEMS MARKET REVENUE, 2020–2030, ($MILLION)
    FIGURE 28. CANADA NITROGEN OXIDE CONTROL SYSTEMS MARKET REVENUE, 2020–2030, ($MILLION)
    FIGURE 29. MEXICO NITROGEN OXIDE CONTROL SYSTEMS MARKET REVENUE, 2020–2030, ($MILLION)
    FIGURE 30. FRANCE NITROGEN OXIDE CONTROL SYSTEMS MARKET REVENUE, 2020–2030, ($MILLION)
    FIGURE 31. GERMANY NITROGEN OXIDE CONTROL SYSTEMS MARKET REVENUE, 2020–2030, ($MILLION)
    FIGURE 32. ITALY NITROGEN OXIDE CONTROL SYSTEMS MARKET REVENUE, 2020–2030, ($MILLION)
    FIGURE 33. UK NITROGEN OXIDE CONTROL SYSTEMS MARKET REVENUE, 2020–2030, ($MILLION)
    FIGURE 34. REST OF EUROPE NITROGEN OXIDE CONTROL SYSTEMS MARKET REVENUE, 2020–2030, ($MILLION)
    FIGURE 35. CHINA NITROGEN OXIDE CONTROL SYSTEMS MARKET REVENUE, 2020–2030, ($MILLION)
    FIGURE 36. JAPAN NITROGEN OXIDE CONTROL SYSTEMS MARKET REVENUE, 2020–2030, ($MILLION)
    FIGURE 37. INDIA NITROGEN OXIDE CONTROL SYSTEMS MARKET REVENUE, 2020–2030, ($MILLION)
    FIGURE 38. SOUTH KOREA NITROGEN OXIDE CONTROL SYSTEMS MARKET REVENUE, 2020–2030, ($MILLION)
    FIGURE 39. AUSTRALIA NITROGEN OXIDE CONTROL SYSTEMS MARKET REVENUE, 2020–2030, ($MILLION)
    FIGURE 40. REST OF ASIA-PACIFIC NITROGEN OXIDE CONTROL SYSTEMS MARKET REVENUE, 2020–2030, ($MILLION)
    FIGURE 41. BRAZIL NITROGEN OXIDE CONTROL SYSTEMS MARKET REVENUE, 2020–2030, ($MILLION)
    FIGURE 42. SOUTH AFRICA NITROGEN OXIDE CONTROL SYSTEMS MARKET REVENUE, 2020–2030, ($MILLION)
    FIGURE 43. SAUDI ARABIA NITROGEN OXIDE CONTROL SYSTEMS MARKET REVENUE, 2020–2030, ($MILLION)
    FIGURE 44. REST OF LAMEA NITROGEN OXIDE CONTROL SYSTEMS MARKET REVENUE, 2020–2030, ($MILLION)
    FIGURE 45. MARKET PLAYER POSITIONING, 2019
    FIGURE 46. TOP WINNING STRATEGIES, BY YEAR, 2016–2020
    FIGURE 47. TOP WINNING STRATEGIES, BY DEVELOPMENT, 2018–2021 (%)
    FIGURE 48. TOP WINNING STRATEGIES, BY COMPANY, 2018–2021
    FIGURE 49. PRODUCT MAPPING OF TOP 10 PLAYERS
    FIGURE 50. COMPETITIVE HEATMAP OF KEY PLAYERS
    FIGURE 51. BABCOCK & WILCOX ENTERPRISES, INC: REVENUE, 2018–2020 ($MILLION)
    FIGURE 52. BABCOCK & WILCOX ENTERPRISES, INC: REVENUE SHARE BY SEGMENT, 2020 (%)
    FIGURE 53. BABCOCK & WILCOX ENTERPRISES, INC: REVENUE SHARE BY REGION, 2020 (%)
    FIGURE 54. CECO ENVIRONMENTAL: REVENUE, 2018–2020 ($MILLION)
    FIGURE 55. CECO ENVIRONMENTAL: REVENUE SHARE BY SEGMENT, 2020 (%)
    FIGURE 56. E CECO ENVIRONMENTAL: REVENUE SHARE BY REGION, 2020 (%)
    FIGURE 57. DUCON TECHNOLOGIES INC: REVENUE, 2018–2020 ($MILLION)
    FIGURE 58. DUCON TECHNOLOGIES INC: REVENUE SHARE BY OPERATION, 2020 (%)
    FIGURE 59. DUCON TECHNOLOGIES INC: REVENUE SHARE BY REGION, 2020 (%)
    FIGURE 60. FUEL TECH: REVENUE, 2018–2020 ($MILLION)
    FIGURE 61. FUEL TECH: REVENUE SHARE BY SEGMENT, 2020 (%)
    FIGURE 62. FUEL TECH: REVENUE SHARE BY REGION, 2020 (%)
    FIGURE 63. HONEYWELL INTERNATIONAL INC: REVENUE, 2018–2020 ($MILLION)
    FIGURE 64. OVERALL FINANCIAL STATUS ($MILLION)
    FIGURE 65. HONEYWELL INTERNATIONAL INC: REVENUE SHARE BY SEGMENT, 2020 (%)
    FIGURE 66. HONEYWELL INTERNATIONAL INC: REVENUE SHARE BY REGION, 2020 (%)
    FIGURE 67. JOHN WOOD GROUP PLC: REVENUE, 2018–2020 ($MILLION)
    FIGURE 68. JOHN WOOD GROUP PLC: REVENUE SHARE BY SEGMENT, 2020 (%)
    FIGURE 69. JOHN WOOD GROUP PLC: REVENUE SHARE BY REGION, 2020 (%)
    FIGURE 70. MITSUBISHI HITACHI POWER SYSTEM: REVENUE, 2018–2020 ($MILLION)
    FIGURE 71. MITSUBISHI HITACHI POWER SYSTEM: REVENUE SHARE BY SEGMENT, 2020 (%)
    FIGURE 72. MITSUBISHI HITACHI POWER SYSTEM: REVENUE SHARE BY REGION, 2020 (%)
    FIGURE 73. S.A. HAMON: REVENUE, 2018–2020 ($MILLION)
    FIGURE 74. S.A. HAMON: REVENUE SHARE BY SEGMENT, 2020 (%)
    FIGURE 75. S.A. HAMON: REVENUE SHARE BY REGION, 2020 (%)
    FIGURE 76. SIEMENS AG: NET SALES, 2018–2020 ($MILLION)
    FIGURE 77. SIEMENS AG: REVENUE SHARE BY SEGMENT, 2020 (%)
    FIGURE 78. SIEMENS AG: REVENUE SHARE BY REGION, 2020 (%)
    FIGURE 79. THE SHELL GROUP: NET SALES, 2018–2020 ($MILLION)
    FIGURE 80. THE SHELL GROUP: REVENUE SHARE BY SEGMENT, 2020 (%)
    FIGURE 81. THE SHELL GROUP: REVENUE SHARE BY REGION, 2020 (%)


Various CXOs from leading companies perceive nitrogen oxide control system market as an area of potential growth owing to the improvements in nitrogen oxide control system technologies that have enabled industrial and transportation frameworks to consider nitrogen oxide control system as a feasible and economic option. In addition, elevated levels of nitrogen dioxide can cause damage to the human respiratory tract and increase a person's vulnerability to, and the severity of, respiratory infections and asthma. Long-term exposure to high levels of nitrogen dioxide can cause chronic lung disease. However, with all such effect, governments of several nations imposed regulations to control nitrogen oxide that encourage the nitrogen control system market, which lead to surge in number of key players in the market.

PURCHASE OPTIONS

Call or Email us

U.S.-Canada Toll-free: +1-800-792-5285
Int'l : +1-503-894-6022
Europe : +44-845-528-1300
Email : help@alliedmarketresearch.com
 
FREQUENTLY ASKED QUESTIONS?

A. Asia-Pacific will provide more business opportunities for global nitrogen oxide control systems in future

A. Low NOx Burner segment holds the maximum share of the Nitrogen Oxide Control Systems Market.

A. Agreement, business expansion and product launch are the key growth strategy of nitrogen oxide control systems market players.

A. Babcock & Wilcox Enterprises, Inc., CECO Environmental, Ducon Technologies Inc., Fuel Tech, Honeywell International Inc., John Wood Group plc, Mitsubishi Hitachi Power Systems, Ltd., S.A. HAMON, Siemens AG and The Shell Group are the leading market players active in the nitrogen oxide control systems market.

A. Rising environmental concern and emission control regulation and rising automation may act as the major driving factor for the market. In addition, rapid increase in technological advancement may create lucrative opportunities for the market.

Looking for Customization?

 Customization Request

Have a Question?

 Speak with Analyst

Any Confusion?

 Inquire Before Buying

Have a glance of the Report

  Request Sample
RELATED TAGS

Purchase Full Report of
Nitrogen Oxide Control Systems Market

Start reading instantly.
This Report and over 66,804+ more Reports, Available with Avenue Library. T&C*.

  • Online Only
  • $3,456
  • Online cloud access only
  • Restricted print, copy, paste & download
  • Read only
  • Free industry update
    (Within 180 days)
  • Free report update in next update cycle
    (Apr 2023 - Apr 2024)
  • Data Pack
  • $3,840
  • Restricted to one authorized user
  • One print only
  • Available in
    Excel
  • Free industry update
    (Within 180 days)
  •   Free report update in next update cycle
    (Apr 2023 - Apr 2024)
  • Single User
  • $5,769
  • Restricted to one authorized user
  • One print only
  • Available in
    PDF
  • Free industry update
    (Within 180 days)
  •   Free report update in next update cycle
    (Apr 2023 - Apr 2024)
  • Five Users
  • $6,450
  • Limited to five authorized users
  • Print upto five copies
  • Available in
    PDF
  • Free industry update
    (Within 180 days)
  •   Free report update in next update cycle
    (Apr 2023 - Apr 2024)
  • Enterprise
    License/PDF

  • $10,995
  • Unlimited
    within
    company/enterprise
  • Available in Excel & PDF
  • Free industry update
    (Within 180 days)
  •   Free report update in next update cycle
    (Apr 2023 - Apr 2024)
  • Library
    Membership

  • $999 $ 1,175
    Per User/ Per month/ Billed annually
  • Published Content
    E-access
  • Company Profiles
    E-access
  • Newly Added Content Access
  • 10 PDF
    Downloads
  • 5 Excel Data
    Pack Downloads
  • 250 Company Profiles PDF Downloads
  • Buy Now

*Taxes/Fees, if applicable will be added during checkout. All prices in USD

RELATED REPORTS
 

Why Allied Market Research?


Infallible Methodology

To ensure high-level data integrity, accurate analysis, and impeccable forecasts

Analyst Support

For complete satisfaction

Customization

On-demand customization of scope of the report to exactly meet your needs

TARGETED MARKET VIEW

Targeted market view to provide pertinent information and save time of readers

Get fresh content delivered

Get insights on topics that are crucial for your business. Stay abreast of your interest areas.

Get Industry Data Alerts

Why Allied Market Research?

Infallible Methodology

To ensure high-level data integrity, accurate analysis, and impeccable forecasts

Analyst Support

For complete satisfaction

Customization

On-demand customization of scope of the report to exactly meet your needs

TARGETED MARKET VIEW

Targeted market view to provide pertinent information and save time of readers