0
Upcoming Allied Market Research
2023
Non-invasive Fat Reduction Market

Non-invasive Fat Reduction Market: Global Opportunity Analysis and Industry Forecast 2019-2027 Market

Report Code: A08354
Nov 2023 | Pages: NA
Tables: NA
Charts: NA
  • Formats*:

  • pdf

    Single User License, Five User
    License & Enterprise User License

  • xls

    Data Pack Excel License

  • ppt

    It comes with the additional cost
    of $2500.00 contact sales.


COVID-19

Pandemic disrupted the entire world and affected many industries.

Get detailed COVID-19 impact analysis on the Non-invasive Fat Reduction Market

Request Now !

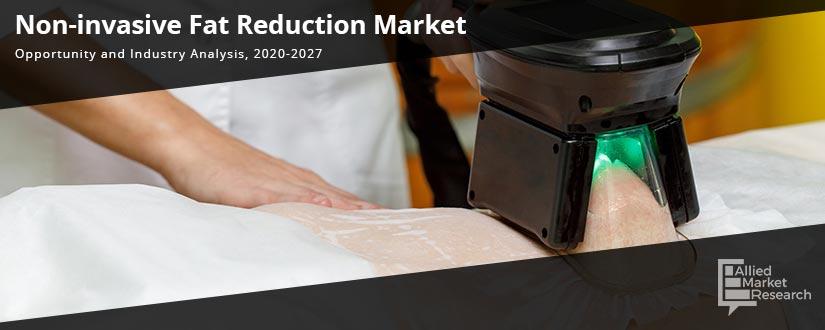
Dermatologists usually make use of injections and other handheld devices to extract the fat cells from the body. This process is known as non-invasive fat removal. The U.S. Food and Drug Administration (FDA) has approved various handheld devices for the process of fat removal. These devices are sometimes placed above the skin and sometimes they need to be placed on the skin. They make use of sound, heat, or cold waves for the removal of fat cells. This type of technique helps in the destruction of fat cells but they don’t affect the nerves, skin, or any other body parts. However, the injections use acidic elements, such as bile acid, which help in the digestion of fats. The approval of these injections has been processed by the FDA for the treatment of double chin. The results gained by these practices are said to be permanent. As the fat cells are present in the body from birth, the number of fat cells does not change during the change in the weight of the person, even if he is losing or gaining weight. However, the person appears bigger after gaining weight due to the expansion of the fat cells and the shrinkage of cells when the person loses weight. In the process of non-invasive fat removal, the fat cells are killed. However, all the fat cells cannot completely vanish from the target area.

Non-invasive-Fat-Reduction

COVID-19 scenario analysis:

  • To take care of the infected population the demand for medical supplies is increasing. Respiratory support devices, such as atomizer, life-support machine, oxygen generator, and monitor, are among the majorly used medical devices in primary clinical treatment. Moreover, COVID-19 has led to a huge surge in demand for medical supplies such as personal protective equipment, including masks, gloves, and protective eyeglasses. 
  • With rise in the number of COVID-19 cases worldwide, the need for medical supplies keeps on rising both from healthcare professionals and civil populations for precautionary measures. 
  • Manufacturers of these products have a chance to capitalize on this increased demand for medical supplies to ensure adequate and continuous supply of personal protective equipment in the market.
  • Attributed to such factors, COVID 19 is expected to have a significant impact on the market.

Top impacting factors: Market scenario analysis, trends, drivers and impact analysis

There has been a significant rise in the number of key market leaders in the non-invasive fat reduction market and these companies have been enlarging their geographical areas as they have been introducing new devices for non-invasive fat reduction. These companies have also helped to spread awareness and ultimately entice customers on a large scale. Obesity and other issues have been observed among people, owing to rise in disorders due to issues related to health. These are the major factors propelling the growth of the non-invasive fat reduction market. There is rise in population going through the process of reduction of fat, contouring of body, and procedure of surgeries through non-invasive methods. The demand for new and improved products has been increasing, which is expected to help get faster & better results and enhance R&D activities. These factors affect the growth of the non-invasive fat reduction market. However, non-invasive fat reductions devices are very expensive, which affect the procedure cost. Although lasers are safe, but the marks are left after the surgery is performed. These are the major challenges faced by the non-invasive fat reduction market. Moreover, there are various risks associated, such as infections hematomas and seroma, that hinder the growth of the non-invasive fat reduction market.

New product launches and acquisitions to boost the market

On July 16th, 2019, BTL used faces of various Hollywood female actors for its new system, EMSCULPT. This campaign helped in promotions of its non-invasive fat reduction devices. On October 11th, 2018, BTL introduced its device Exilis ULTRA 360 in Brazil.

Surge in usage in hospital applications

Hospitals, dermatology clinics & cosmetic centers, and other segments are the major consumers of the non-invasive fat reduction market. Amongst them, hospitals are the biggest end-users in the market. This is due to the high-end technology and upgraded devices present in hospitals. Moreover, practitioners are also very professional and have the required infrastructure to perform procedures. Additionally, treatments offered in hospitals are very reliable and trustworthy. In addition, various multispecialty clinics are also growing, owing to the rise in the requirements of patients at a single and comfortable location with variations in the procedures and the presence of practitioners.

Key benefits of the report:

  • This study presents the analytical depiction of the non-invasive fat reduction market along with the current trends and future estimations to determine the imminent investment pockets.
  • The report presents information related to key drivers, restraints, and opportunities along with detailed analysis of the non-invasive fat reduction market share.
  • The current market is quantitatively analyzed to highlight the non-invasive fat reduction market growth scenario.
  • Porter’s five forces analysis illustrates the potency of buyers & suppliers in the market.
  • The report provides a detailed analysis based on competitive intensity and how the competition will take shape in coming years.

Questions answered in the non-invasive fat reduction market research report:

  • Which are the leading market players active in the market?
  • What are the current trends that will influence the market in the next few years?
  • What are the driving factors, restraints, and opportunities of the market?
  • What are the projections for the future that would help in taking further strategic steps?

Non-invasive Fat Reduction Market: Global Opportunity Analysis and Industry Forecast 2019–2027 Report Highlights

Aspects Details
By Technology
  • Ultrasound
  • Cryolipolysis
  • Low Level Lasers
  • Others
By End User
  • Hospitals
  • Dermatology Clinics and Cosmetic Centers
  • Others
By Type
  • RF Devices
  • Ultrasound Devices
By Region
  • North America  (US, Canada)
  • Europe  (Germany, UK, France, rest of Europe)
  • Asia-Pacific  (China, Japan, India, rest of Asia-Pacific)
  • Latin America  (Brazil, Mexico, rest of LATAM)
  • the Middle East 
  • Africa 
Key Market Players VIDA Wellness & Beauty, The Piazza Center for Plastic Surgery & Advanced Skin Care, Amirlak Plastic Surgery, Waldman Schantz Plastic Surgery Center, VLCC Wellness, Transform Cosmetic Surgery, The University of Texas Southwestern Medical Center, JK Plastic Surgery Center, Apollo Cosmetic Clinics., The Plastic Surgery Clinic
 
  • CHAPTER 1: INTRODUCTION

    • 1.1. Report Description

    • 1.2. Key Market Segments

    • 1.3. Key Benefits

    • 1.4. Research Methodology

      • 1.4.1. Primary Research

      • 1.4.2. Secondary Research

      • 1.4.3. Analyst Tools and Models

  • CHAPTER 2: EXECUTIVE SUMMARY

    • 2.1. CXO Perspective

  • CHAPTER 3: MARKET LANDSCAPE

    • 3.1. Market Definition and Scope

    • 3.2. Key Findings

      • 3.2.1. Top Investment Pockets

      • 3.2.2. Top Winning Strategies

    • 3.3. Porter's Five Forces Analysis

      • 3.3.1. Bargaining Power of Suppliers

      • 3.3.2. Threat of New Entrants

      • 3.3.3. Threat of Substitutes

      • 3.3.4. Competitive Rivalry

      • 3.3.5. Bargaining Power among Buyers

    • 3.5. Market Dynamics

      • 3.5.1. Drivers

      • 3.5.2. Restraints

      • 3.5.3. Opportunities

    • 3.6. COVID-19 Impact Analysis

  • CHAPTER 4: NON-INVASIVE FAT REDUCTION MARKET, BY TECHNOLOGY

    • 4.1. Market Overview

      • 4.1.1 Market Size and Forecast, By Technology

    • 4.2. Ultrasound

      • 4.2.1. Key Market Trends, Growth Factors and Opportunities

      • 4.2.2. Market Size and Forecast, By Region

      • 4.2.3. Market Share Analysis, By Country

    • 4.3. Cryolipolysis

      • 4.3.1. Key Market Trends, Growth Factors and Opportunities

      • 4.3.2. Market Size and Forecast, By Region

      • 4.3.3. Market Share Analysis, By Country

    • 4.4. Low Level Lasers

      • 4.4.1. Key Market Trends, Growth Factors and Opportunities

      • 4.4.2. Market Size and Forecast, By Region

      • 4.4.3. Market Share Analysis, By Country

    • 4.5. Others

      • 4.5.1. Key Market Trends, Growth Factors and Opportunities

      • 4.5.2. Market Size and Forecast, By Region

      • 4.5.3. Market Share Analysis, By Country

  • CHAPTER 5: NON-INVASIVE FAT REDUCTION MARKET, BY END USER

    • 5.1. Market Overview

      • 5.1.1 Market Size and Forecast, By End User

    • 5.2. Hospitals

      • 5.2.1. Key Market Trends, Growth Factors and Opportunities

      • 5.2.2. Market Size and Forecast, By Region

      • 5.2.3. Market Share Analysis, By Country

    • 5.3. Dermatology Clinics And Cosmetic Centers

      • 5.3.1. Key Market Trends, Growth Factors and Opportunities

      • 5.3.2. Market Size and Forecast, By Region

      • 5.3.3. Market Share Analysis, By Country

    • 5.4. Others

      • 5.4.1. Key Market Trends, Growth Factors and Opportunities

      • 5.4.2. Market Size and Forecast, By Region

      • 5.4.3. Market Share Analysis, By Country

  • CHAPTER 6: NON-INVASIVE FAT REDUCTION MARKET, BY TYPE

    • 6.1. Market Overview

      • 6.1.1 Market Size and Forecast, By Type

    • 6.2. RF Devices

      • 6.2.1. Key Market Trends, Growth Factors and Opportunities

      • 6.2.2. Market Size and Forecast, By Region

      • 6.2.3. Market Share Analysis, By Country

    • 6.3. Ultrasound Devices

      • 6.3.1. Key Market Trends, Growth Factors and Opportunities

      • 6.3.2. Market Size and Forecast, By Region

      • 6.3.3. Market Share Analysis, By Country

  • CHAPTER 7: NON-INVASIVE FAT REDUCTION MARKET, BY REGION

    • 7.1. Market Overview

      • 7.1.1 Market Size and Forecast, By Region

    • 7.2. North America

      • 7.2.1. Key Market Trends and Opportunities

      • 7.2.2. Market Size and Forecast, By Technology

      • 7.2.3. Market Size and Forecast, By End User

      • 7.2.4. Market Size and Forecast, By Type

      • 7.2.5. Market Size and Forecast, By Country

      • 7.2.6. U.S. Non-invasive Fat Reduction Market

        • 7.2.6.1. Market Size and Forecast, By Technology
        • 7.2.6.2. Market Size and Forecast, By End User
        • 7.2.6.3. Market Size and Forecast, By Type
      • 7.2.7. Canada Non-invasive Fat Reduction Market

        • 7.2.7.1. Market Size and Forecast, By Technology
        • 7.2.7.2. Market Size and Forecast, By End User
        • 7.2.7.3. Market Size and Forecast, By Type
      • 7.2.8. Mexico Non-invasive Fat Reduction Market

        • 7.2.8.1. Market Size and Forecast, By Technology
        • 7.2.8.2. Market Size and Forecast, By End User
        • 7.2.8.3. Market Size and Forecast, By Type
    • 7.3. Europe

      • 7.3.1. Key Market Trends and Opportunities

      • 7.3.2. Market Size and Forecast, By Technology

      • 7.3.3. Market Size and Forecast, By End User

      • 7.3.4. Market Size and Forecast, By Type

      • 7.3.5. Market Size and Forecast, By Country

      • 7.3.6. France Non-invasive Fat Reduction Market

        • 7.3.6.1. Market Size and Forecast, By Technology
        • 7.3.6.2. Market Size and Forecast, By End User
        • 7.3.6.3. Market Size and Forecast, By Type
      • 7.3.7. Germany Non-invasive Fat Reduction Market

        • 7.3.7.1. Market Size and Forecast, By Technology
        • 7.3.7.2. Market Size and Forecast, By End User
        • 7.3.7.3. Market Size and Forecast, By Type
      • 7.3.8. Italy Non-invasive Fat Reduction Market

        • 7.3.8.1. Market Size and Forecast, By Technology
        • 7.3.8.2. Market Size and Forecast, By End User
        • 7.3.8.3. Market Size and Forecast, By Type
      • 7.3.9. Spain Non-invasive Fat Reduction Market

        • 7.3.9.1. Market Size and Forecast, By Technology
        • 7.3.9.2. Market Size and Forecast, By End User
        • 7.3.9.3. Market Size and Forecast, By Type
      • 7.3.10. UK Non-invasive Fat Reduction Market

        • 7.3.10.1. Market Size and Forecast, By Technology
        • 7.3.10.2. Market Size and Forecast, By End User
        • 7.3.10.3. Market Size and Forecast, By Type
      • 7.3.11. Russia Non-invasive Fat Reduction Market

        • 7.3.11.1. Market Size and Forecast, By Technology
        • 7.3.11.2. Market Size and Forecast, By End User
        • 7.3.11.3. Market Size and Forecast, By Type
      • 7.3.12. Rest Of Europe Non-invasive Fat Reduction Market

        • 7.3.12.1. Market Size and Forecast, By Technology
        • 7.3.12.2. Market Size and Forecast, By End User
        • 7.3.12.3. Market Size and Forecast, By Type
    • 7.4. Asia-Pacific

      • 7.4.1. Key Market Trends and Opportunities

      • 7.4.2. Market Size and Forecast, By Technology

      • 7.4.3. Market Size and Forecast, By End User

      • 7.4.4. Market Size and Forecast, By Type

      • 7.4.5. Market Size and Forecast, By Country

      • 7.4.6. China Non-invasive Fat Reduction Market

        • 7.4.6.1. Market Size and Forecast, By Technology
        • 7.4.6.2. Market Size and Forecast, By End User
        • 7.4.6.3. Market Size and Forecast, By Type
      • 7.4.7. Japan Non-invasive Fat Reduction Market

        • 7.4.7.1. Market Size and Forecast, By Technology
        • 7.4.7.2. Market Size and Forecast, By End User
        • 7.4.7.3. Market Size and Forecast, By Type
      • 7.4.8. India Non-invasive Fat Reduction Market

        • 7.4.8.1. Market Size and Forecast, By Technology
        • 7.4.8.2. Market Size and Forecast, By End User
        • 7.4.8.3. Market Size and Forecast, By Type
      • 7.4.9. South Korea Non-invasive Fat Reduction Market

        • 7.4.9.1. Market Size and Forecast, By Technology
        • 7.4.9.2. Market Size and Forecast, By End User
        • 7.4.9.3. Market Size and Forecast, By Type
      • 7.4.10. Australia Non-invasive Fat Reduction Market

        • 7.4.10.1. Market Size and Forecast, By Technology
        • 7.4.10.2. Market Size and Forecast, By End User
        • 7.4.10.3. Market Size and Forecast, By Type
      • 7.4.11. Thailand Non-invasive Fat Reduction Market

        • 7.4.11.1. Market Size and Forecast, By Technology
        • 7.4.11.2. Market Size and Forecast, By End User
        • 7.4.11.3. Market Size and Forecast, By Type
      • 7.4.12. Malaysia Non-invasive Fat Reduction Market

        • 7.4.12.1. Market Size and Forecast, By Technology
        • 7.4.12.2. Market Size and Forecast, By End User
        • 7.4.12.3. Market Size and Forecast, By Type
      • 7.4.13. Indonesia Non-invasive Fat Reduction Market

        • 7.4.13.1. Market Size and Forecast, By Technology
        • 7.4.13.2. Market Size and Forecast, By End User
        • 7.4.13.3. Market Size and Forecast, By Type
      • 7.4.14. Rest of Asia Pacific Non-invasive Fat Reduction Market

        • 7.4.14.1. Market Size and Forecast, By Technology
        • 7.4.14.2. Market Size and Forecast, By End User
        • 7.4.14.3. Market Size and Forecast, By Type
    • 7.5. LAMEA

      • 7.5.1. Key Market Trends and Opportunities

      • 7.5.2. Market Size and Forecast, By Technology

      • 7.5.3. Market Size and Forecast, By End User

      • 7.5.4. Market Size and Forecast, By Type

      • 7.5.5. Market Size and Forecast, By Country

      • 7.5.6. Brazil Non-invasive Fat Reduction Market

        • 7.5.6.1. Market Size and Forecast, By Technology
        • 7.5.6.2. Market Size and Forecast, By End User
        • 7.5.6.3. Market Size and Forecast, By Type
      • 7.5.7. South Africa Non-invasive Fat Reduction Market

        • 7.5.7.1. Market Size and Forecast, By Technology
        • 7.5.7.2. Market Size and Forecast, By End User
        • 7.5.7.3. Market Size and Forecast, By Type
      • 7.5.8. Saudi Arabia Non-invasive Fat Reduction Market

        • 7.5.8.1. Market Size and Forecast, By Technology
        • 7.5.8.2. Market Size and Forecast, By End User
        • 7.5.8.3. Market Size and Forecast, By Type
      • 7.5.9. UAE Non-invasive Fat Reduction Market

        • 7.5.9.1. Market Size and Forecast, By Technology
        • 7.5.9.2. Market Size and Forecast, By End User
        • 7.5.9.3. Market Size and Forecast, By Type
      • 7.5.10. Argentina Non-invasive Fat Reduction Market

        • 7.5.10.1. Market Size and Forecast, By Technology
        • 7.5.10.2. Market Size and Forecast, By End User
        • 7.5.10.3. Market Size and Forecast, By Type
      • 7.5.11. Rest of LAMEA Non-invasive Fat Reduction Market

        • 7.5.11.1. Market Size and Forecast, By Technology
        • 7.5.11.2. Market Size and Forecast, By End User
        • 7.5.11.3. Market Size and Forecast, By Type
  • CHAPTER 8: COMPETITIVE LANDSCAPE

    • 8.1. Introduction

    • 8.2. Top Winning Strategies

    • 8.3. Product Mapping Of Top 10 Player

    • 8.4. Competitive Dashboard

    • 8.5. Competitive Heatmap

    • 8.6. Top Player Positioning,2022

  • CHAPTER 9: COMPANY PROFILES

    • 9.1. Amirlak Plastic Surgery

      • 9.1.1. Company Overview

      • 9.1.2. Key Executives

      • 9.1.3. Company Snapshot

      • 9.1.4. Operating Business Segments

      • 9.1.5. Product Portfolio

      • 9.1.6. Business Performance

      • 9.1.7. Key Strategic Moves and Developments

    • 9.2. Apollo Cosmetic Clinics.

      • 9.2.1. Company Overview

      • 9.2.2. Key Executives

      • 9.2.3. Company Snapshot

      • 9.2.4. Operating Business Segments

      • 9.2.5. Product Portfolio

      • 9.2.6. Business Performance

      • 9.2.7. Key Strategic Moves and Developments

    • 9.3. JK Plastic Surgery Center

      • 9.3.1. Company Overview

      • 9.3.2. Key Executives

      • 9.3.3. Company Snapshot

      • 9.3.4. Operating Business Segments

      • 9.3.5. Product Portfolio

      • 9.3.6. Business Performance

      • 9.3.7. Key Strategic Moves and Developments

    • 9.4. The Piazza Center For Plastic Surgery And Advanced Skin Care

      • 9.4.1. Company Overview

      • 9.4.2. Key Executives

      • 9.4.3. Company Snapshot

      • 9.4.4. Operating Business Segments

      • 9.4.5. Product Portfolio

      • 9.4.6. Business Performance

      • 9.4.7. Key Strategic Moves and Developments

    • 9.5. The Plastic Surgery Clinic

      • 9.5.1. Company Overview

      • 9.5.2. Key Executives

      • 9.5.3. Company Snapshot

      • 9.5.4. Operating Business Segments

      • 9.5.5. Product Portfolio

      • 9.5.6. Business Performance

      • 9.5.7. Key Strategic Moves and Developments

    • 9.6. The University Of Texas Southwestern Medical Center

      • 9.6.1. Company Overview

      • 9.6.2. Key Executives

      • 9.6.3. Company Snapshot

      • 9.6.4. Operating Business Segments

      • 9.6.5. Product Portfolio

      • 9.6.6. Business Performance

      • 9.6.7. Key Strategic Moves and Developments

    • 9.7. Transform Cosmetic Surgery

      • 9.7.1. Company Overview

      • 9.7.2. Key Executives

      • 9.7.3. Company Snapshot

      • 9.7.4. Operating Business Segments

      • 9.7.5. Product Portfolio

      • 9.7.6. Business Performance

      • 9.7.7. Key Strategic Moves and Developments

    • 9.8. VIDA Wellness And Beauty

      • 9.8.1. Company Overview

      • 9.8.2. Key Executives

      • 9.8.3. Company Snapshot

      • 9.8.4. Operating Business Segments

      • 9.8.5. Product Portfolio

      • 9.8.6. Business Performance

      • 9.8.7. Key Strategic Moves and Developments

    • 9.9. VLCC Wellness

      • 9.9.1. Company Overview

      • 9.9.2. Key Executives

      • 9.9.3. Company Snapshot

      • 9.9.4. Operating Business Segments

      • 9.9.5. Product Portfolio

      • 9.9.6. Business Performance

      • 9.9.7. Key Strategic Moves and Developments

    • 9.10. Waldman Schantz Plastic Surgery Center

      • 9.10.1. Company Overview

      • 9.10.2. Key Executives

      • 9.10.3. Company Snapshot

      • 9.10.4. Operating Business Segments

      • 9.10.5. Product Portfolio

      • 9.10.6. Business Performance

      • 9.10.7. Key Strategic Moves and Developments

  • LIST OF TABLES

  • TABLE 1. GLOBAL NON-INVASIVE FAT REDUCTION MARKET, BY TECHNOLOGY, 2022-2032 ($MILLION)
  • TABLE 2. GLOBAL NON-INVASIVE FAT REDUCTION MARKET FOR ULTRASOUND, BY REGION, 2022-2032 ($MILLION)
  • TABLE 3. GLOBAL NON-INVASIVE FAT REDUCTION MARKET FOR CRYOLIPOLYSIS, BY REGION, 2022-2032 ($MILLION)
  • TABLE 4. GLOBAL NON-INVASIVE FAT REDUCTION MARKET FOR LOW LEVEL LASERS, BY REGION, 2022-2032 ($MILLION)
  • TABLE 5. GLOBAL NON-INVASIVE FAT REDUCTION MARKET FOR OTHERS, BY REGION, 2022-2032 ($MILLION)
  • TABLE 6. GLOBAL NON-INVASIVE FAT REDUCTION MARKET, BY END USER, 2022-2032 ($MILLION)
  • TABLE 7. GLOBAL NON-INVASIVE FAT REDUCTION MARKET FOR HOSPITALS, BY REGION, 2022-2032 ($MILLION)
  • TABLE 8. GLOBAL NON-INVASIVE FAT REDUCTION MARKET FOR DERMATOLOGY CLINICS AND COSMETIC CENTERS, BY REGION, 2022-2032 ($MILLION)
  • TABLE 9. GLOBAL NON-INVASIVE FAT REDUCTION MARKET FOR OTHERS, BY REGION, 2022-2032 ($MILLION)
  • TABLE 10. GLOBAL NON-INVASIVE FAT REDUCTION MARKET, BY TYPE, 2022-2032 ($MILLION)
  • TABLE 11. GLOBAL NON-INVASIVE FAT REDUCTION MARKET FOR RF DEVICES, BY REGION, 2022-2032 ($MILLION)
  • TABLE 12. GLOBAL NON-INVASIVE FAT REDUCTION MARKET FOR ULTRASOUND DEVICES, BY REGION, 2022-2032 ($MILLION)
  • TABLE 13. GLOBAL NON-INVASIVE FAT REDUCTION MARKET, BY REGION, 2022-2032 ($MILLION)
  • TABLE 14. NORTH AMERICA NON-INVASIVE FAT REDUCTION, BY REGION, 2022-2032 ($MILLION)
  • TABLE 15. NORTH AMERICA NON-INVASIVE FAT REDUCTION, BY TECHNOLOGY, 2022-2032 ($MILLION)
  • TABLE 16. NORTH AMERICA NON-INVASIVE FAT REDUCTION, BY END USER, 2022-2032 ($MILLION)
  • TABLE 17. NORTH AMERICA NON-INVASIVE FAT REDUCTION, BY TYPE, 2022-2032 ($MILLION)
  • TABLE 18. U.S. NON-INVASIVE FAT REDUCTION, BY TECHNOLOGY, 2022-2032 ($MILLION)
  • TABLE 19. U.S. NON-INVASIVE FAT REDUCTION, BY END USER, 2022-2032 ($MILLION)
  • TABLE 20. U.S. NON-INVASIVE FAT REDUCTION, BY TYPE, 2022-2032 ($MILLION)
  • TABLE 21. CANADA NON-INVASIVE FAT REDUCTION, BY TECHNOLOGY, 2022-2032 ($MILLION)
  • TABLE 22. CANADA NON-INVASIVE FAT REDUCTION, BY END USER, 2022-2032 ($MILLION)
  • TABLE 23. CANADA NON-INVASIVE FAT REDUCTION, BY TYPE, 2022-2032 ($MILLION)
  • TABLE 24. MEXICO NON-INVASIVE FAT REDUCTION, BY TECHNOLOGY, 2022-2032 ($MILLION)
  • TABLE 25. MEXICO NON-INVASIVE FAT REDUCTION, BY END USER, 2022-2032 ($MILLION)
  • TABLE 26. MEXICO NON-INVASIVE FAT REDUCTION, BY TYPE, 2022-2032 ($MILLION)
  • TABLE 27. EUROPE NON-INVASIVE FAT REDUCTION, BY REGION, 2022-2032 ($MILLION)
  • TABLE 28. EUROPE NON-INVASIVE FAT REDUCTION, BY TECHNOLOGY, 2022-2032 ($MILLION)
  • TABLE 29. EUROPE NON-INVASIVE FAT REDUCTION, BY END USER, 2022-2032 ($MILLION)
  • TABLE 30. EUROPE NON-INVASIVE FAT REDUCTION, BY TYPE, 2022-2032 ($MILLION)
  • TABLE 31. FRANCE NON-INVASIVE FAT REDUCTION, BY TECHNOLOGY, 2022-2032 ($MILLION)
  • TABLE 32. FRANCE NON-INVASIVE FAT REDUCTION, BY END USER, 2022-2032 ($MILLION)
  • TABLE 33. FRANCE NON-INVASIVE FAT REDUCTION, BY TYPE, 2022-2032 ($MILLION)
  • TABLE 34. GERMANY NON-INVASIVE FAT REDUCTION, BY TECHNOLOGY, 2022-2032 ($MILLION)
  • TABLE 35. GERMANY NON-INVASIVE FAT REDUCTION, BY END USER, 2022-2032 ($MILLION)
  • TABLE 36. GERMANY NON-INVASIVE FAT REDUCTION, BY TYPE, 2022-2032 ($MILLION)
  • TABLE 37. ITALY NON-INVASIVE FAT REDUCTION, BY TECHNOLOGY, 2022-2032 ($MILLION)
  • TABLE 38. ITALY NON-INVASIVE FAT REDUCTION, BY END USER, 2022-2032 ($MILLION)
  • TABLE 39. ITALY NON-INVASIVE FAT REDUCTION, BY TYPE, 2022-2032 ($MILLION)
  • TABLE 40. SPAIN NON-INVASIVE FAT REDUCTION, BY TECHNOLOGY, 2022-2032 ($MILLION)
  • TABLE 41. SPAIN NON-INVASIVE FAT REDUCTION, BY END USER, 2022-2032 ($MILLION)
  • TABLE 42. SPAIN NON-INVASIVE FAT REDUCTION, BY TYPE, 2022-2032 ($MILLION)
  • TABLE 43. UK NON-INVASIVE FAT REDUCTION, BY TECHNOLOGY, 2022-2032 ($MILLION)
  • TABLE 44. UK NON-INVASIVE FAT REDUCTION, BY END USER, 2022-2032 ($MILLION)
  • TABLE 45. UK NON-INVASIVE FAT REDUCTION, BY TYPE, 2022-2032 ($MILLION)
  • TABLE 46. RUSSIA NON-INVASIVE FAT REDUCTION, BY TECHNOLOGY, 2022-2032 ($MILLION)
  • TABLE 47. RUSSIA NON-INVASIVE FAT REDUCTION, BY END USER, 2022-2032 ($MILLION)
  • TABLE 48. RUSSIA NON-INVASIVE FAT REDUCTION, BY TYPE, 2022-2032 ($MILLION)
  • TABLE 49. REST OF EUROPE NON-INVASIVE FAT REDUCTION, BY TECHNOLOGY, 2022-2032 ($MILLION)
  • TABLE 50. REST OF EUROPE NON-INVASIVE FAT REDUCTION, BY END USER, 2022-2032 ($MILLION)
  • TABLE 51. REST OF EUROPE NON-INVASIVE FAT REDUCTION, BY TYPE, 2022-2032 ($MILLION)
  • TABLE 52. ASIA-PACIFIC NON-INVASIVE FAT REDUCTION, BY REGION, 2022-2032 ($MILLION)
  • TABLE 53. ASIA-PACIFIC NON-INVASIVE FAT REDUCTION, BY TECHNOLOGY, 2022-2032 ($MILLION)
  • TABLE 54. ASIA-PACIFIC NON-INVASIVE FAT REDUCTION, BY END USER, 2022-2032 ($MILLION)
  • TABLE 55. ASIA-PACIFIC NON-INVASIVE FAT REDUCTION, BY TYPE, 2022-2032 ($MILLION)
  • TABLE 56. CHINA NON-INVASIVE FAT REDUCTION, BY TECHNOLOGY, 2022-2032 ($MILLION)
  • TABLE 57. CHINA NON-INVASIVE FAT REDUCTION, BY END USER, 2022-2032 ($MILLION)
  • TABLE 58. CHINA NON-INVASIVE FAT REDUCTION, BY TYPE, 2022-2032 ($MILLION)
  • TABLE 59. JAPAN NON-INVASIVE FAT REDUCTION, BY TECHNOLOGY, 2022-2032 ($MILLION)
  • TABLE 60. JAPAN NON-INVASIVE FAT REDUCTION, BY END USER, 2022-2032 ($MILLION)
  • TABLE 61. JAPAN NON-INVASIVE FAT REDUCTION, BY TYPE, 2022-2032 ($MILLION)
  • TABLE 62. INDIA NON-INVASIVE FAT REDUCTION, BY TECHNOLOGY, 2022-2032 ($MILLION)
  • TABLE 63. INDIA NON-INVASIVE FAT REDUCTION, BY END USER, 2022-2032 ($MILLION)
  • TABLE 64. INDIA NON-INVASIVE FAT REDUCTION, BY TYPE, 2022-2032 ($MILLION)
  • TABLE 65. SOUTH KOREA NON-INVASIVE FAT REDUCTION, BY TECHNOLOGY, 2022-2032 ($MILLION)
  • TABLE 66. SOUTH KOREA NON-INVASIVE FAT REDUCTION, BY END USER, 2022-2032 ($MILLION)
  • TABLE 67. SOUTH KOREA NON-INVASIVE FAT REDUCTION, BY TYPE, 2022-2032 ($MILLION)
  • TABLE 68. AUSTRALIA NON-INVASIVE FAT REDUCTION, BY TECHNOLOGY, 2022-2032 ($MILLION)
  • TABLE 69. AUSTRALIA NON-INVASIVE FAT REDUCTION, BY END USER, 2022-2032 ($MILLION)
  • TABLE 70. AUSTRALIA NON-INVASIVE FAT REDUCTION, BY TYPE, 2022-2032 ($MILLION)
  • TABLE 71. THAILAND NON-INVASIVE FAT REDUCTION, BY TECHNOLOGY, 2022-2032 ($MILLION)
  • TABLE 72. THAILAND NON-INVASIVE FAT REDUCTION, BY END USER, 2022-2032 ($MILLION)
  • TABLE 73. THAILAND NON-INVASIVE FAT REDUCTION, BY TYPE, 2022-2032 ($MILLION)
  • TABLE 74. MALAYSIA NON-INVASIVE FAT REDUCTION, BY TECHNOLOGY, 2022-2032 ($MILLION)
  • TABLE 75. MALAYSIA NON-INVASIVE FAT REDUCTION, BY END USER, 2022-2032 ($MILLION)
  • TABLE 76. MALAYSIA NON-INVASIVE FAT REDUCTION, BY TYPE, 2022-2032 ($MILLION)
  • TABLE 77. INDONESIA NON-INVASIVE FAT REDUCTION, BY TECHNOLOGY, 2022-2032 ($MILLION)
  • TABLE 78. INDONESIA NON-INVASIVE FAT REDUCTION, BY END USER, 2022-2032 ($MILLION)
  • TABLE 79. INDONESIA NON-INVASIVE FAT REDUCTION, BY TYPE, 2022-2032 ($MILLION)
  • TABLE 80. REST OF ASIA PACIFIC NON-INVASIVE FAT REDUCTION, BY TECHNOLOGY, 2022-2032 ($MILLION)
  • TABLE 81. REST OF ASIA PACIFIC NON-INVASIVE FAT REDUCTION, BY END USER, 2022-2032 ($MILLION)
  • TABLE 82. REST OF ASIA PACIFIC NON-INVASIVE FAT REDUCTION, BY TYPE, 2022-2032 ($MILLION)
  • TABLE 83. LAMEA NON-INVASIVE FAT REDUCTION, BY REGION, 2022-2032 ($MILLION)
  • TABLE 84. LAMEA NON-INVASIVE FAT REDUCTION, BY TECHNOLOGY, 2022-2032 ($MILLION)
  • TABLE 85. LAMEA NON-INVASIVE FAT REDUCTION, BY END USER, 2022-2032 ($MILLION)
  • TABLE 86. LAMEA NON-INVASIVE FAT REDUCTION, BY TYPE, 2022-2032 ($MILLION)
  • TABLE 87. BRAZIL NON-INVASIVE FAT REDUCTION, BY TECHNOLOGY, 2022-2032 ($MILLION)
  • TABLE 88. BRAZIL NON-INVASIVE FAT REDUCTION, BY END USER, 2022-2032 ($MILLION)
  • TABLE 89. BRAZIL NON-INVASIVE FAT REDUCTION, BY TYPE, 2022-2032 ($MILLION)
  • TABLE 90. SOUTH AFRICA NON-INVASIVE FAT REDUCTION, BY TECHNOLOGY, 2022-2032 ($MILLION)
  • TABLE 91. SOUTH AFRICA NON-INVASIVE FAT REDUCTION, BY END USER, 2022-2032 ($MILLION)
  • TABLE 92. SOUTH AFRICA NON-INVASIVE FAT REDUCTION, BY TYPE, 2022-2032 ($MILLION)
  • TABLE 93. SAUDI ARABIA NON-INVASIVE FAT REDUCTION, BY TECHNOLOGY, 2022-2032 ($MILLION)
  • TABLE 94. SAUDI ARABIA NON-INVASIVE FAT REDUCTION, BY END USER, 2022-2032 ($MILLION)
  • TABLE 95. SAUDI ARABIA NON-INVASIVE FAT REDUCTION, BY TYPE, 2022-2032 ($MILLION)
  • TABLE 96. UAE NON-INVASIVE FAT REDUCTION, BY TECHNOLOGY, 2022-2032 ($MILLION)
  • TABLE 97. UAE NON-INVASIVE FAT REDUCTION, BY END USER, 2022-2032 ($MILLION)
  • TABLE 98. UAE NON-INVASIVE FAT REDUCTION, BY TYPE, 2022-2032 ($MILLION)
  • TABLE 99. ARGENTINA NON-INVASIVE FAT REDUCTION, BY TECHNOLOGY, 2022-2032 ($MILLION)
  • TABLE 100. ARGENTINA NON-INVASIVE FAT REDUCTION, BY END USER, 2022-2032 ($MILLION)
  • TABLE 101. ARGENTINA NON-INVASIVE FAT REDUCTION, BY TYPE, 2022-2032 ($MILLION)
  • TABLE 102. REST OF LAMEA NON-INVASIVE FAT REDUCTION, BY TECHNOLOGY, 2022-2032 ($MILLION)
  • TABLE 103. REST OF LAMEA NON-INVASIVE FAT REDUCTION, BY END USER, 2022-2032 ($MILLION)
  • TABLE 104. REST OF LAMEA NON-INVASIVE FAT REDUCTION, BY TYPE, 2022-2032 ($MILLION)
  • TABLE 105. AMIRLAK PLASTIC SURGERY: KEY EXECUTIVES
  • TABLE 106. AMIRLAK PLASTIC SURGERY: COMPANY SNAPSHOT
  • TABLE 107. AMIRLAK PLASTIC SURGERY: OPERATING SEGMENTS
  • TABLE 108. AMIRLAK PLASTIC SURGERY: PRODUCT PORTFOLIO
  • TABLE 109. AMIRLAK PLASTIC SURGERY: KEY STRATEGIC MOVES AND DEVELOPMENTS
  • TABLE 110. APOLLO COSMETIC CLINICS.: KEY EXECUTIVES
  • TABLE 111. APOLLO COSMETIC CLINICS.: COMPANY SNAPSHOT
  • TABLE 112. APOLLO COSMETIC CLINICS.: OPERATING SEGMENTS
  • TABLE 113. APOLLO COSMETIC CLINICS.: PRODUCT PORTFOLIO
  • TABLE 114. APOLLO COSMETIC CLINICS.: KEY STRATEGIC MOVES AND DEVELOPMENTS
  • TABLE 115. JK PLASTIC SURGERY CENTER: KEY EXECUTIVES
  • TABLE 116. JK PLASTIC SURGERY CENTER: COMPANY SNAPSHOT
  • TABLE 117. JK PLASTIC SURGERY CENTER: OPERATING SEGMENTS
  • TABLE 118. JK PLASTIC SURGERY CENTER: PRODUCT PORTFOLIO
  • TABLE 119. JK PLASTIC SURGERY CENTER: KEY STRATEGIC MOVES AND DEVELOPMENTS
  • TABLE 120. THE PIAZZA CENTER FOR PLASTIC SURGERY AND ADVANCED SKIN CARE: KEY EXECUTIVES
  • TABLE 121. THE PIAZZA CENTER FOR PLASTIC SURGERY AND ADVANCED SKIN CARE: COMPANY SNAPSHOT
  • TABLE 122. THE PIAZZA CENTER FOR PLASTIC SURGERY AND ADVANCED SKIN CARE: OPERATING SEGMENTS
  • TABLE 123. THE PIAZZA CENTER FOR PLASTIC SURGERY AND ADVANCED SKIN CARE: PRODUCT PORTFOLIO
  • TABLE 124. THE PIAZZA CENTER FOR PLASTIC SURGERY AND ADVANCED SKIN CARE: KEY STRATEGIC MOVES AND DEVELOPMENTS
  • TABLE 125. THE PLASTIC SURGERY CLINIC: KEY EXECUTIVES
  • TABLE 126. THE PLASTIC SURGERY CLINIC: COMPANY SNAPSHOT
  • TABLE 127. THE PLASTIC SURGERY CLINIC: OPERATING SEGMENTS
  • TABLE 128. THE PLASTIC SURGERY CLINIC: PRODUCT PORTFOLIO
  • TABLE 129. THE PLASTIC SURGERY CLINIC: KEY STRATEGIC MOVES AND DEVELOPMENTS
  • TABLE 130. THE UNIVERSITY OF TEXAS SOUTHWESTERN MEDICAL CENTER: KEY EXECUTIVES
  • TABLE 131. THE UNIVERSITY OF TEXAS SOUTHWESTERN MEDICAL CENTER: COMPANY SNAPSHOT
  • TABLE 132. THE UNIVERSITY OF TEXAS SOUTHWESTERN MEDICAL CENTER: OPERATING SEGMENTS
  • TABLE 133. THE UNIVERSITY OF TEXAS SOUTHWESTERN MEDICAL CENTER: PRODUCT PORTFOLIO
  • TABLE 134. THE UNIVERSITY OF TEXAS SOUTHWESTERN MEDICAL CENTER: KEY STRATEGIC MOVES AND DEVELOPMENTS
  • TABLE 135. TRANSFORM COSMETIC SURGERY: KEY EXECUTIVES
  • TABLE 136. TRANSFORM COSMETIC SURGERY: COMPANY SNAPSHOT
  • TABLE 137. TRANSFORM COSMETIC SURGERY: OPERATING SEGMENTS
  • TABLE 138. TRANSFORM COSMETIC SURGERY: PRODUCT PORTFOLIO
  • TABLE 139. TRANSFORM COSMETIC SURGERY: KEY STRATEGIC MOVES AND DEVELOPMENTS
  • TABLE 140. VIDA WELLNESS AND BEAUTY: KEY EXECUTIVES
  • TABLE 141. VIDA WELLNESS AND BEAUTY: COMPANY SNAPSHOT
  • TABLE 142. VIDA WELLNESS AND BEAUTY: OPERATING SEGMENTS
  • TABLE 143. VIDA WELLNESS AND BEAUTY: PRODUCT PORTFOLIO
  • TABLE 144. VIDA WELLNESS AND BEAUTY: KEY STRATEGIC MOVES AND DEVELOPMENTS
  • TABLE 145. VLCC WELLNESS: KEY EXECUTIVES
  • TABLE 146. VLCC WELLNESS: COMPANY SNAPSHOT
  • TABLE 147. VLCC WELLNESS: OPERATING SEGMENTS
  • TABLE 148. VLCC WELLNESS: PRODUCT PORTFOLIO
  • TABLE 149. VLCC WELLNESS: KEY STRATEGIC MOVES AND DEVELOPMENTS
  • TABLE 150. WALDMAN SCHANTZ PLASTIC SURGERY CENTER: KEY EXECUTIVES
  • TABLE 151. WALDMAN SCHANTZ PLASTIC SURGERY CENTER: COMPANY SNAPSHOT
  • TABLE 152. WALDMAN SCHANTZ PLASTIC SURGERY CENTER: OPERATING SEGMENTS
  • TABLE 153. WALDMAN SCHANTZ PLASTIC SURGERY CENTER: PRODUCT PORTFOLIO
  • TABLE 154. WALDMAN SCHANTZ PLASTIC SURGERY CENTER: KEY STRATEGIC MOVES AND DEVELOPMENTS
  • LIST OF FIGURES

  • FIGURE 1. GLOBAL NON-INVASIVE FAT REDUCTION MARKET SEGMENTATION
  • FIGURE 2. GLOBAL NON-INVASIVE FAT REDUCTION MARKET
  • FIGURE 3. SEGMENTATION NON-INVASIVE FAT REDUCTION MARKET
  • FIGURE 4. TOP INVESTMENT POCKET IN NON-INVASIVE FAT REDUCTION MARKET
  • FIGURE 5. MODERATE BARGAINING POWER OF BUYERS
  • FIGURE 6. MODERATE BARGAINING POWER OF SUPPLIERS
  • FIGURE 7. MODERATE THREAT OF NEW ENTRANTS
  • FIGURE 8. LOW THREAT OF SUBSTITUTION
  • FIGURE 9. HIGH COMPETITIVE RIVALRY
  • FIGURE 10. OPPORTUNITIES, RESTRAINTS AND DRIVERS: GLOBALNON-INVASIVE FAT REDUCTION MARKET
  • FIGURE 11. NON-INVASIVE FAT REDUCTION MARKET SEGMENTATION, BY BY TECHNOLOGY
  • FIGURE 12. NON-INVASIVE FAT REDUCTION MARKET FOR ULTRASOUND, BY COUNTRY, 2022-2032 ($MILLION)
  • FIGURE 13. NON-INVASIVE FAT REDUCTION MARKET FOR CRYOLIPOLYSIS, BY COUNTRY, 2022-2032 ($MILLION)
  • FIGURE 14. NON-INVASIVE FAT REDUCTION MARKET FOR LOW LEVEL LASERS, BY COUNTRY, 2022-2032 ($MILLION)
  • FIGURE 15. NON-INVASIVE FAT REDUCTION MARKET FOR OTHERS, BY COUNTRY, 2022-2032 ($MILLION)
  • FIGURE 16. NON-INVASIVE FAT REDUCTION MARKET SEGMENTATION, BY BY END USER
  • FIGURE 17. NON-INVASIVE FAT REDUCTION MARKET FOR HOSPITALS, BY COUNTRY, 2022-2032 ($MILLION)
  • FIGURE 18. NON-INVASIVE FAT REDUCTION MARKET FOR DERMATOLOGY CLINICS AND COSMETIC CENTERS, BY COUNTRY, 2022-2032 ($MILLION)
  • FIGURE 19. NON-INVASIVE FAT REDUCTION MARKET FOR OTHERS, BY COUNTRY, 2022-2032 ($MILLION)
  • FIGURE 20. NON-INVASIVE FAT REDUCTION MARKET SEGMENTATION, BY BY TYPE
  • FIGURE 21. NON-INVASIVE FAT REDUCTION MARKET FOR RF DEVICES, BY COUNTRY, 2022-2032 ($MILLION)
  • FIGURE 22. NON-INVASIVE FAT REDUCTION MARKET FOR ULTRASOUND DEVICES, BY COUNTRY, 2022-2032 ($MILLION)
  • FIGURE 23. TOP WINNING STRATEGIES, BY YEAR, 2020-2022*
  • FIGURE 24. TOP WINNING STRATEGIES, BY DEVELOPMENT, 2020-2022*
  • FIGURE 25. TOP WINNING STRATEGIES, BY COMPANY, 2020-2022*
  • FIGURE 26. PRODUCT MAPPING OF TOP 10 PLAYERS
  • FIGURE 27. COMPETITIVE DASHBOARD
  • FIGURE 28. COMPETITIVE HEATMAP: NON-INVASIVE FAT REDUCTION MARKET
  • FIGURE 29. Top player positioning, 2022
  • FIGURE 30. AMIRLAK PLASTIC SURGERY: NET SALES, 2020-2022 ($MILLION)
  • FIGURE 31. AMIRLAK PLASTIC SURGERY: REVENUE SHARE, BY SEGMENT, 2032 (%)
  • FIGURE 32. AMIRLAK PLASTIC SURGERY: REVENUE SHARE, BY REGION, 2032 (%)
  • FIGURE 33. APOLLO COSMETIC CLINICS.: NET SALES, 2020-2022 ($MILLION)
  • FIGURE 34. APOLLO COSMETIC CLINICS.: REVENUE SHARE, BY SEGMENT, 2032 (%)
  • FIGURE 35. APOLLO COSMETIC CLINICS.: REVENUE SHARE, BY REGION, 2032 (%)
  • FIGURE 36. JK PLASTIC SURGERY CENTER: NET SALES, 2020-2022 ($MILLION)
  • FIGURE 37. JK PLASTIC SURGERY CENTER: REVENUE SHARE, BY SEGMENT, 2032 (%)
  • FIGURE 38. JK PLASTIC SURGERY CENTER: REVENUE SHARE, BY REGION, 2032 (%)
  • FIGURE 39. THE PIAZZA CENTER FOR PLASTIC SURGERY AND ADVANCED SKIN CARE: NET SALES, 2020-2022 ($MILLION)
  • FIGURE 40. THE PIAZZA CENTER FOR PLASTIC SURGERY AND ADVANCED SKIN CARE: REVENUE SHARE, BY SEGMENT, 2032 (%)
  • FIGURE 41. THE PIAZZA CENTER FOR PLASTIC SURGERY AND ADVANCED SKIN CARE: REVENUE SHARE, BY REGION, 2032 (%)
  • FIGURE 42. THE PLASTIC SURGERY CLINIC: NET SALES, 2020-2022 ($MILLION)
  • FIGURE 43. THE PLASTIC SURGERY CLINIC: REVENUE SHARE, BY SEGMENT, 2032 (%)
  • FIGURE 44. THE PLASTIC SURGERY CLINIC: REVENUE SHARE, BY REGION, 2032 (%)
  • FIGURE 45. THE UNIVERSITY OF TEXAS SOUTHWESTERN MEDICAL CENTER: NET SALES, 2020-2022 ($MILLION)
  • FIGURE 46. THE UNIVERSITY OF TEXAS SOUTHWESTERN MEDICAL CENTER: REVENUE SHARE, BY SEGMENT, 2032 (%)
  • FIGURE 47. THE UNIVERSITY OF TEXAS SOUTHWESTERN MEDICAL CENTER: REVENUE SHARE, BY REGION, 2032 (%)
  • FIGURE 48. TRANSFORM COSMETIC SURGERY: NET SALES, 2020-2022 ($MILLION)
  • FIGURE 49. TRANSFORM COSMETIC SURGERY: REVENUE SHARE, BY SEGMENT, 2032 (%)
  • FIGURE 50. TRANSFORM COSMETIC SURGERY: REVENUE SHARE, BY REGION, 2032 (%)
  • FIGURE 51. VIDA WELLNESS AND BEAUTY: NET SALES, 2020-2022 ($MILLION)
  • FIGURE 52. VIDA WELLNESS AND BEAUTY: REVENUE SHARE, BY SEGMENT, 2032 (%)
  • FIGURE 53. VIDA WELLNESS AND BEAUTY: REVENUE SHARE, BY REGION, 2032 (%)
  • FIGURE 54. VLCC WELLNESS: NET SALES, 2020-2022 ($MILLION)
  • FIGURE 55. VLCC WELLNESS: REVENUE SHARE, BY SEGMENT, 2032 (%)
  • FIGURE 56. VLCC WELLNESS: REVENUE SHARE, BY REGION, 2032 (%)
  • FIGURE 57. WALDMAN SCHANTZ PLASTIC SURGERY CENTER: NET SALES, 2020-2022 ($MILLION)
  • FIGURE 58. WALDMAN SCHANTZ PLASTIC SURGERY CENTER: REVENUE SHARE, BY SEGMENT, 2032 (%)
  • FIGURE 59. WALDMAN SCHANTZ PLASTIC SURGERY CENTER: REVENUE SHARE, BY REGION, 2032 (%)


With collective industry experience of about 200 years of its analysts and experts, Allied Market Research (AMR) encompasses most infallible research methodology for its market intelligence and industry analysis. We do not only engrave the deepest levels of markets but also sneak through its slimmest details for the purpose of our market estimates and forecasts. Our approach helps in building greater market consensus view for size, shape and industry trends within each industry segment. We carefully factor in industry trends and real developments for identifying key growth factors and future course of the market. Our research proceeds are the resultant of high quality data, expert views and analysis and high value independent opinions. Our research process is designed to deliver balanced view of the global markets and allow stakeholders to make informed decisions.

We offer our clients exhaustive research and analysis based on wide variety of factual inputs, which largely include interviews with industry participants, reliable statistics and regional intelligence. Our in-house industry experts play instrumental role in designing analytic tools and models, tailored to the requirements of particular industry segment. These analytical tools and models sanitize the data & statistics and enhance the accuracy of our recommendations and advice. With AMR’s calibrated research process and 360` degree data-evaluation methodology, our clients are assured of receiving:

  • Consistent, valuable, robust and actionable data & analysis that can easily be referenced for strategic business planning
  • Technologically sophisticated and reliable insights through well audited and veracious research methodology
  • Sovereign research proceeds that present a tangible depiction of marketplace


With a strong methodology we are, therefore, confident that our research and analysis are most reliable and guarantees sound business planning.

Secondary research
We refer a broad array of industry sources for our secondary, which typically include; however, not limited to: Company SEC filings, annual reports, company websites, broker & financial reports and investor presentations for competitive scenario and shape of the industry

  • Patent and regulatory databases for understanding of technical & legal developments
  • Scientific and technical writings for product information and related preemptions
  • Regional government and statistical databases for macro analysis
  • Authentic new articles, web-casts and other related releases for market evaluation
  • Internal and external proprietary databases, key market indicators and relevant press releases for market estimates and forecast


Primary research
Our primary research efforts include reaching out participants through mail, tele-conversations, referrals, professional networks and face-to-face interactions. We are also in professional corporate relations with various companies that allow us greater flexibility for reaching out industry participants and commentators for interviews and discussions, fulfilling following functions:

  • Validates and improves the data quality and strengthens research proceeds
  • Further develops analyst team’s market understanding and expertise
  • Supplies authentic information about market size, share, growth and forecasts


Our primary research interview and discussion panels are typically composed of most experienced industry members. These participants include; however, not limited to:

  • Chief executives and VPs of leading corporations specific to industry
  • Product and sales managers or country heads; channel partners and top level distributors; banking, investments and valuation experts Key opinion leaders (KOLs)


Analyst tools and models
AMR has developed set of analyst tools and data models to supplement and expedite the analysis process. Corresponding to markets, where there is significant lack of information and estimates, AMR’s team of experts and analyst develop specific analyst tools and industry models to translate qualitative and quantitative industry indicators into exact industry estimates. These models also allow analysts to examine the prospects and opportunities prevailing in the market to accurately forecast the course of the market.

PURCHASE OPTIONS

Call or Email us

U.S.-Canada Toll-free: +1-800-792-5285
Int'l : +1-503-894-6022
Europe : +44-845-528-1300
Email : help@alliedmarketresearch.com

Looking for Customization?

 Customization Request

Have a Question?

 Speak with Analyst

Any Confusion?

 Inquire Before Buying

Have a glance of the Report

  Enquiry Now

Purchase Full Report of
Non-invasive Fat Reduction Market

Start reading.
This Report and over 68,439+ more Reports, Available with Avenue Library. T&C*.

  • Online Only
  • $3,690
  • Online cloud access only
  • Restricted print, copy, paste & download
  • Read only
  • Free industry update
    (Within 180 days)
  • Free report update in next update cycle
  • Data Pack
  • $3,840
  • Restricted to one authorized user
  • One print only
  • Available in
    Excel
  • Free industry update
    (Within 180 days)
  •   Free report update in next update cycle
  • Single User
  • $5,820
  • Restricted to one authorized user
  • One print only
  • Available in
    PDF
  • Free industry update
    (Within 180 days)
  •   Free report update in next update cycle
  • Five Users
  • $6,540
  • Limited to five authorized users
  • Print upto five copies
  • Available in
    PDF
  • Free industry update
    (Within 180 days)
  •   Free report update in next update cycle
  • Enterprise
    License/PDF

  • $9,870
  • Unlimited
    within
    company/enterprise
  • Available in Excel & PDF
  • Free industry update
    (Within 180 days)
  •   Free report update in next update cycle
  • Library
    Membership

  • $999 $ 1,175
    Per User/ Per month/ Billed annually
  • Published Content
    E-access
  • Company Profiles
    E-access
  • Newly Added Content Access
  • 10 PDF
    Downloads
  • 5 Excel Data
    Pack Downloads
  • 250 Company Profiles PDF Downloads
  • Buy Now

*Taxes/Fees, if applicable will be added during checkout. All prices in USD

RELATED REPORTS
 

Why Allied Market Research?


Infallible Methodology

To ensure high-level data integrity, accurate analysis, and impeccable forecasts

Analyst Support

For complete satisfaction

Customization

On-demand customization of scope of the report to exactly meet your needs

TARGETED MARKET VIEW

Targeted market view to provide pertinent information and save time of readers

Get fresh content delivered

Get insights on topics that are crucial for your business. Stay abreast of your interest areas.

Get Industry Data Alerts

Why Allied Market Research?

Infallible Methodology

To ensure high-level data integrity, accurate analysis, and impeccable forecasts

Analyst Support

For complete satisfaction

Customization

On-demand customization of scope of the report to exactly meet your needs

TARGETED MARKET VIEW

Targeted market view to provide pertinent information and save time of readers