0
2019
North America Aluminum Market

North America Aluminum Market

by Processing Method (Flat Rolled, Castings, Extrusions, Forgings, Pigments & Powders, and Rod & Bars), End-User Industry (Transport, Building & Construction, Electrical Engineering, Consumer Goods, Foil & Packaging, Machinery & Equipment, and Others): Opportunity Analysis and Industry Forecast, 2015 - 2023

Report Code: A04769
Jan 2019 | Pages: 144
Tables: 74
Charts: 34
  • Formats*:

  • pdf

    Single User License, Five User
    License & Enterprise User License

  • xls

    Data Pack Excel License

  • ppt

    It comes with the additional cost
    of $2500.00 contact sales.


COVID-19

Pandemic disrupted the entire world and affected many industries.

Get detailed COVID-19 impact analysis on the North America Aluminum Market

Request Now !

North America Aluminum Market Overview:

The North America aluminum market accounted for $12,076.0 million in 2015 and is anticipated to reach $17,995.6 million by 2023, registering a CAGR of 5.1% from 2015 to 2023.

Aluminum is a lightweight, nonmagnetic, soft, and ductile metal. It is the third most abundant element found in the earths crust but is seldom found uncombined in nature. It is usually extracted from minerals such as cryolite and bauxite. It forms a reflective coating when evaporated in vacuum, which is utilized to manufacture telescope mirrors, packaging, and toys. It is used in the production of variety of products such as foils, window frames, kitchen utensils, airplane parts, beer kegs, and others.

The North America aluminum market is witnessing healthy growth over the past few years and it is expected to grow significantly during the forecast period. This is due to the development of the transport industry and technological advancements in product manufacturing technologies, processing equipment, and alloy development over decades. In addition, increase in applications across various end-user industries due to its specific properties over other metals such as dampness and corrosion resistance. However, increase in competition from substitutes such as composites is expected to hamper the market growth. On the contrary, increase in use of recycled aluminum products is anticipated to offer lucrative growth opportunities to the market players.

The North America aluminum market is segmented based on processing method, end-user industry, and country. Based on processing method, the market is classified into flat rolled, castings, castings, extrusions, forgings, pigments & powder, and rod & bars. Based on end-user industry, it is divided into transport, building & construction, electrical engineering, consumer goods, foil & packaging, machinery & equipment and others. Based on country, it is analyzed across U.S. and Mexico.

The major key players operating in the North America aluminum market include Alcoa, Norsk Hydro, Rio Tinto Alcan, Arconic, Century Aluminum, Novelis, Access Industries, United Company RUSAL, Kaisar Aluminum, and JW Aluminum, and others. The other player includes United Aluminum, GYFORDPRODUCTIONS, LLC, ALUMINERIE ALOUETTE INC., Extrudex Aluminum, and Almag Aluminum.

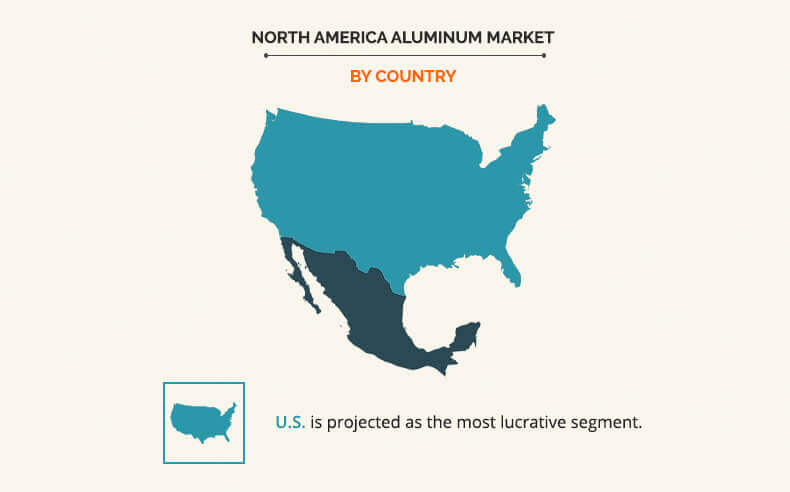
Based on region, the U.S. accounts for major share in the aluminum market due to presence of established end-use industries such as transportation and building & construction. Moreover, the U.S. is expected to remain dominant during the forecast period. This is due to growth in investment by key players in the aluminum production expansion to cater to the rise in demand.

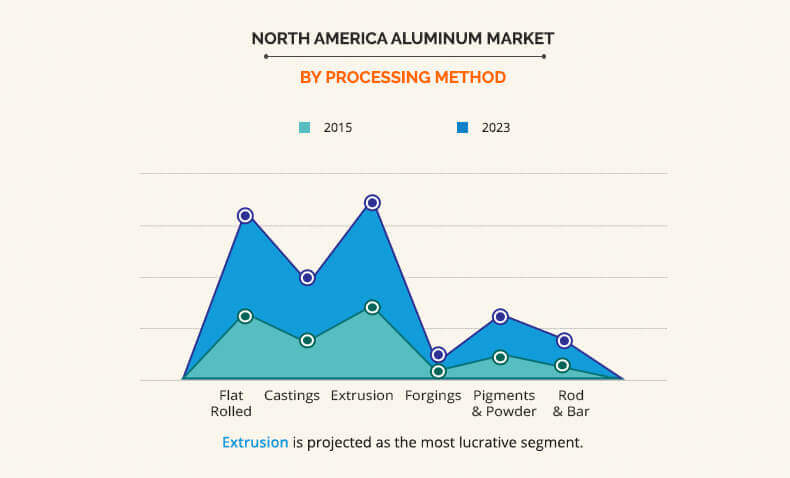
Based on processing method, the extrusion segment dominated the market in 2015. Extrusion aluminum products have high demand in commercial application specifically in construction, machinery and equipment application, and consumer goods. Hence, rise in commercialization leads to the high demand for extrusion aluminum products in North America.

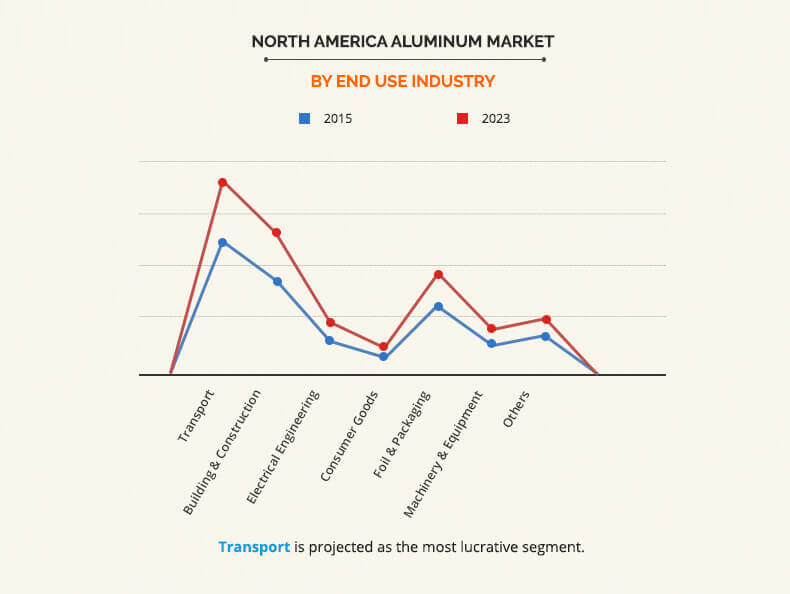
Based on end-use industry, the transportation segment emerged as a regional leader in 2015. Average amount of aluminum used in the vehicle production has reached 100 kg, which significantly drives the consumption rate for aluminum. The transportation industry dominated the North America region with the growth in production and sales of vehicle.

Key Benefits for North America Aluminum Market:

  • Porters five forces analysis helps to analyze the potential of buyers & suppliers and the competitive scenario of the industry for strategy building
  • It outlines the current trends and future scenario of the market from 2015 to 2023 to understand the prevailing opportunities and potential investment pockets
  • Major countries in each region have been mapped according to their individual revenue contribution to the regional market
  • The key drivers, restraints, and opportunities and their detailed impact analyses are elucidated in the study
  • The profiles of key players along with their key strategic developments are enlisted in the report

North America Aluminum Market Report Highlights

Aspects Details
By Processing Method
  • Flat Rolled
  • Castings
  • Extrusions
  • Forgings
  • Pigments & Powder
  • Rod & Bar
By End Use Industry
  • Transport
  • Building & Construction
  • Electrical Engineering
  • Consumer Goods
  • Foil & Packaging
  • Machinery & Equipment
  • Others
By Country
  • U.S.
  • Mexico
Key Market Players ACCESS INDUSTRIES, JW ALUMINUM INC., UNITED COMPANY RUSAL, NORSK HYDRO ASA, NOVELIS INC., ALCOA CORPORATION, ARCONIC INC., KAISER ALUMINUM, RIO TINTO ALCAN INC., CENTURY ALUMINUM COMPANY
 

CHAPTER 1: INTRODUCTION

1.1. Report description
1.2. Key benefits for stakeholders
1.3. Key market segments

1.3.1. List of key players profiled in the report

1.4. Research methodology

1.4.1. Secondary research
1.4.2. Primary research
1.4.3. Analyst tools and models

CHAPTER 2: EXECUTIVE SUMMARY

2.1. Key findings of the study

2.1.1. CXO perspective

CHAPTER 3: MARKET OVERVIEW

3.1. Market definition and scope
3.2. Key findings

3.2.1. Top investment pockets

3.3. Top winning strategies
3.4. Porter's five forces analysis

3.4.1. Bargaining power of Buyer
3.4.2. Bargaining power of Supplier
3.4.3. Thereat of new entrants
3.4.4. Threat of substitute
3.4.5. Intensity of competitive rivalry

3.5. Top player positioning, 2017
3.6. Market dynamics

3.6.1. Drivers

3.6.1.1. Development of the transport industry
3.6.1.2. Technological advancements
3.6.1.3. Increase in applications across various end-user industries

3.6.2. Restraint

3.6.2.1. Increase in competition from substitutes

3.6.3. Opportunity

3.6.3.1. Increase in use of recycled aluminum products

CHAPTER 4: NORTH AMERICA ALUMINUM MARKET, BY PROCESSING METHOD

4.1. Overview
4.2. Market size and forecast
4.3. Flat rolled

4.3.1. Market size and forecast, by Country

4.4. Castings

4.4.1. Market size and forecast, by country

4.5. Extrusions

4.5.1. Market size and forecast, by country

4.6. Forgings

4.6.1. Market size and forecast, by country

4.7. Pigments & powders

4.7.1. Market size and forecast, by country

4.8. Rods & bars

4.8.1. Market size and forecast, by country

CHAPTER 5: NORTH AMERICA ALUMINUM, BY END-USER INDUSTRY

5.1. Overview

5.1.1. Market size and forecast

5.2. Transport

5.2.1. Market size and forecast, by country

5.3. Building & construction

5.3.1. Market size and forecast, by country

5.4. Electrical engineering

5.4.1. Market size and forecast, by country

5.5. Consumer goods

5.5.1. Market size and forecast, by country

5.6. Foil & packaging

5.6.1. Market size and forecast, by country

5.7. Machinery & equipment

5.7.1. Market size and forecast, by country

5.8. Others

5.8.1. Market size and forecast, by country

CHAPTER 6: NORTH AMERICA ALUMINUM MARKET, BY COUNTRY

6.1. Overview

6.1.1. Market size and forecast, by processing method
6.1.2. Market size and forecast, by end-user industry
6.1.3. Market size and forecast, by country
6.1.4. U.S.

6.1.4.1. Market size and forecast, by processing method
6.1.4.2. Market size and forecast, by end-user industry

6.1.5. Mexico

6.1.5.1. Market size and forecast, by processing method
6.1.5.2. Market size and forecast, by end-user industry

CHAPTER 7: COMPANY PROFILES

7.1. ALCOA CORPORATION

7.1.1. Company overview
7.1.2. Company snapshot
7.1.3. Operating business segments
7.1.4. Product portfolio
7.1.5. Business performance
7.1.6. Key strategic moves and developments

7.2. NORSK HYDRO ASA

7.2.1. Company overview
7.2.2. Company snapshot
7.2.3. Operating business segments
7.2.4. Product portfolio
7.2.5. Business performance
7.2.6. Key strategic moves and developments

7.3. RIO TINTO ALCAN INC.

7.3.1. Company overview
7.3.2. Company snapshot
7.3.3. Operating business segments
7.3.4. Product portfolio
7.3.5. Business performance
7.3.6. Key strategic moves and developments

7.4. ARCONIC INC.

7.4.1. Company overview
7.4.2. Company snapshot
7.4.3. Operating business segments
7.4.4. Product portfolio
7.4.5. Business performance
7.4.6. Key strategic moves and developments

7.5. CENTURY ALUMINUM COMPANY

7.5.1. Company overview
7.5.2. Company snapshot
7.5.3. Operating business segments
7.5.4. Product portfolio
7.5.5. Business performance
7.5.6. Key strategic moves and developments

7.6. NOVELIS INC.

7.6.1. Company overview
7.6.2. Company snapshot
7.6.3. Operating business segments
7.6.4. Product portfolio
7.6.5. Key strategic moves and developments

7.7. ACCESS INDUSTRIES

7.7.1. Company overview
7.7.2. Company snapshot
7.7.3. Operating business segments
7.7.4. Product portfolio

7.8. UNITED COMPANY RUSAL

7.8.1. Company overview
7.8.2. Company snapshot
7.8.3. Operating business segments
7.8.4. Product portfolio
7.8.5. Business performance
7.8.6. Key strategic moves and developments

7.9. KAISER ALUMINUM

7.9.1. Company overview
7.9.2. Company snapshot
7.9.3. Operating business segments
7.9.4. Product portfolio
7.9.5. Business performance
7.9.6. Key strategic moves and developments

7.10. JW ALUMINUM INC.

7.10.1. Company overview
7.10.2. Company snapshot
7.10.3. Operating business segments
7.10.4. Product portfolio
7.10.5. Key strategic moves and developments

LIST OF TABLES

TABLE 01. NORTH AMERICA ALUMINUM MARKET, BY PROCESSING METHOD, 20152023 (KILOTONS)
TABLE 02. NORTH AMERICA ALUMINUM MARKET, BY PROCESSING METHOD, 20152023 ($MILLION)
TABLE 03. NORTH AMERICA ALUMINUM MARKET FOR FLAT ROLLED, BY COUNTRY, 20152023 (KILOTONS)
TABLE 04. NORTH AMERICA ALUMINUM MARKET FOR FLAT ROLLED, BY COUNTRY, 20152023 ($MILLION)
TABLE 05. NORTH AMERICA ALUMINUM MARKET FOR CASTINGS, BY COUNTRY, 20152023 (KILOTONS)
TABLE 06. NORTH AMERICA ALUMINUM MARKET FOR CASTINGS, BY COUNTRY, 20152023 ($MILLION)
TABLE 07. NORTH AMERICA ALUMINUM MARKET FOR EXTRUSIONS, BY COUNTRY, 20152023 (KILOTONS)
TABLE 08. NORTH AMERICA ALUMINUM MARKET FOR EXTRUSIONS, BY COUNTRY, 20152023 ($MILLION)
TABLE 09. NORTH AMERICA ALUMINUM MARKET FOR FORGINGS, BY COUNTRY, 20152023 (KILOTONS)
TABLE 10. NORTH AMERICA ALUMINUM MARKET FOR FORGINGS, BY COUNTRY, 20152023 ($MILLION)
TABLE 11. NORTH AMERICA ALUMINUM MARKET FOR PIGMENTS & POWDERS, BY COUNTRY, 20152023 (KILOTONS)
TABLE 12. NORTH AMERICA ALUMINUM MARKET FOR PIGMENTS & POWDERS, BY COUNTRY, 20152023 ($MILLION)
TABLE 13. NORTH AMERICA ALUMINUM MARKET FOR RODS & BARS, BY COUNTRY, 20152023 (KILOTONS)
TABLE 14. NORTH AMERICA ALUMINUM MARKET FOR RODS & BARS, BY COUNTRY, 20152023 ($MILLION)
TABLE 15. NORTH AMERICA ALUMINUM MARKET, BY END-USE INDUSTRY, 20152023 (KILOTONS)
TABLE 16. NORTH AMERICA ALUMINUM MARKET, BY END-USE INDUSTRY, 20152023 (KILOTONS)
TABLE 17. NORTH AMERICA ALUMINUM MARKET FOR TRANSPORT, BY COUNTRY, 20152023 (KILOTONS)
TABLE 18. NORTH AMERICA ALUMINUM MARKET FOR TRANSPORT, BY COUNTRY, 20152023 ($MILLION)
TABLE 19. NORTH AMERICA ALUMINUM MARKET FOR BUILDING & CONSTRUCTION, BY COUNTRY, 20152023 (KILOTONS)
TABLE 20. NORTH AMERICA ALUMINUM MARKET FOR BUILDING & CONSTRUCTION, BY COUNTRY, 20152023 ($MILLION)
TABLE 21. NORTH AMERICA ALUMINUM MARKET FOR ELECTRICAL ENGINEERING, BY COUNTRY, 20152023 (KILOTONS)
TABLE 22. NORTH AMERICA ALUMINUM MARKET FOR ELECTRICAL ENGINEERING, BY COUNTRY, 20152023 ($MILLION)
TABLE 23. NORTH AMERICA ALUMINUM MARKET FOR CONSUMER GOODS, BY COUNTRY, 20152023 (KILOTONS)
TABLE 24. NORTH AMERICA ALUMINUM MARKET FOR CONSUMER GOODS, BY COUNTRY, 20152023 ($MILLION)
TABLE 25. NORTH AMERICA ALUMINUM MARKET FOR FOIL & PACKAGING, BY COUNTRY, 20152023 (KILOTONS)
TABLE 26. NORTH AMERICA ALUMINUM MARKET FOR FOIL & PACKAGING, BY COUNTRY, 20152023 ($MILLION)
TABLE 27. NORTH AMERICA ALUMINUM MARKET FOR MACHINERY & EQUIPMENT, BY COUNTRY, 20152023 (KILOTONS)
TABLE 28. NORTH AMERICA ALUMINUM MARKET FOR MACHINERY & EQUIPMENT, BY COUNTRY, 20152023 ($MILLION)
TABLE 29. NORTH AMERICA ALUMINUM MARKET FOR OTHERS, BY COUNTRY, 20152023 (KILOTONS)
TABLE 30. NORTH AMERICA ALUMINUM MARKET FOR OTHERS, BY COUNTRY, 20152023 ($MILLION)
TABLE 31. NORTH AMERICA ALUMINUM MARKET, BY PROCESSING METHOD, 20152023 (KILOTONS)
TABLE 32. NORTH AMERICA ALUMINUM MARKET, BY PROCESSING METHOD, 20152023 ($MILLION)
TABLE 33. NORTH AMERICA ALUMINUM MARKET, BY END-USE INDUSTRY, 20152023 (KILOTONS)
TABLE 34. NORTH AMERICA ALUMINUM MARKET, BY END-USE INDUSTRY, 20152023 (KILOTONS)
TABLE 35. NORTH AMERICA ALUMINUM MARKET, BY COUNTRY, 20152023 (KILOTONS)
TABLE 36. NORTH AMERICA ALUMINUM MARKET, BY COUNTRY, 20152023 ($MILLION)
TABLE 37. U.S. ALUMINUM MARKET, BY PROCESSING METHOD, 20152023 (KILOTONS)
TABLE 38. U.S. ALUMINUM MARKET, BY PROCESSING METHOD, 20152023 ($MILLION)
TABLE 39. U.S. ALUMINUM MARKET, BY END-USE INDUSTRY, 20152023 (KILOTONS)
TABLE 40. U.S. ALUMINUM MARKET, BY END-USE INDUSTRY, 20152023 (KILOTONS)
TABLE 41. MEXICO ALUMINUM MARKET, BY PROCESSING METHOD, 20152023 (KILOTONS)
TABLE 42. MEXICO ALUMINUM MARKET, BY PROCESSING METHOD, 20152023 ($MILLION)
TABLE 43. MEXICO ALUMINUM MARKET, BY END-USE INDUSTRY, 20152023 (KILOTONS)
TABLE 44. MEXICO ALUMINUM MARKET, BY END-USE INDUSTRY, 20152023 (KILOTONS)
TABLE 45. ALCOA: COMPANY SNAPSHOT
TABLE 46. ALCOA: OPERATING SEGMENTS
TABLE 47. ALCOA: PRODUCT PORTFOLIO
TABLE 48. NORSK HYDRO ASA: COMPANY SNAPSHOT
TABLE 49. NORSK HYDRO ASA: OPERATING SEGMENTS
TABLE 50. NORSK HYDRO ASA: PRODUCT PORTFOLIO
TABLE 51. RIO TINTO ALCAN INC.: COMPANY SNAPSHOT
TABLE 52. RIO TINTO ALCAN INC.: OPERATING SEGMENTS
TABLE 53. RIO TINTO ALCAN INC.: PRODUCT PORTFOLIO
TABLE 54. ARCONIC INC.: COMPANY SNAPSHOT
TABLE 55. ARCONIC INC.: OPERATING SEGMENTS
TABLE 56. ARCONIC INC.: PRODUCT PORTFOLIO
TABLE 57. CENTURY ALUMINUM COMPANY: COMPANY SNAPSHOT
TABLE 58. CENTURY ALUMINUM COMPANY: OPERATING SEGMENTS
TABLE 59. CENTURY ALUMINUM COMPANY: PRODUCT PORTFOLIO
TABLE 60. NOVELIS INC.: COMPANY SNAPSHOT
TABLE 61. NOVELIS INC.: OPERATING SEGMENTS
TABLE 62. NOVELIS INC.: PRODUCT PORTFOLIO
TABLE 63. ACCESS INDUSTRIES: COMPANY SNAPSHOT
TABLE 64. ACCESS INDUSTRIES: OPERATING SEGMENTS
TABLE 65. ACCESS INDUSTRIES: PRODUCT PORTFOLIO
TABLE 66. UNITED COMPANY RUSAL: COMPANY SNAPSHOT
TABLE 67. UNITED COMPANY RUSAL: OPERATING SEGMENTS
TABLE 68. UNITED COMPANY RUSAL: PRODUCT PORTFOLIO
TABLE 69. KAISAR ALUMINUM: COMPANY SNAPSHOT
TABLE 70. KAISAR ALUMINUM: OPERATING SEGMENTS
TABLE 71. KAISAR ALUMINUM: PRODUCT PORTFOLIO
TABLE 72. JW ALUMINUM INC.: COMPANY SNAPSHOT
TABLE 73. JW ALUMINUM INC.: OPERATING SEGMENTS
TABLE 74. JW ALUMINUM INC.: PRODUCT PORTFOLIO

LIST OF FIGURES

FIGURE 01. NORTH AMERICA ALUMINUM MARKET SEGMENTATION
FIGURE 02. TOP INVESTMENT POCKETS
FIGURE 03. TOP WINNING STRATEGIES, BY YEAR, 20152017*
FIGURE 04. TOP WINNING STRATEGIES, BY DEVELOPMENT, 20152018* (%)
FIGURE 05. TOP WINNING STRATEGIES, BY COMPANY, 20152018*
FIGURE 06. MODERATE BARGAINING POWER OF BUYERS
FIGURE 07. LOW BARGAINING POWER OF SUPPLIER
FIGURE 08. MODERATE THREAT OF NEW ENTRANTS
FIGURE 09. MODERATE THREAT OF SUBSTITUTES
FIGURE 10. HIGH COMPETITIVE RIVALRY
FIGURE 11. TOP PLAYER POSITIONING, 2017
FIGURE 12. NORTH AMERICA ALUMINUM MARKET: IMPACT ANALYSIS
FIGURE 13. NORTH AMERICA ALUMINUM MARKET: U.S. PRODUCTION OF ELECTRIC VEHICLES (MILLIONS), 2013-2017
FIGURE 14. ALCOA CORPORATION: REVENUE, 20152017 ($MILLION)
FIGURE 15. ALCOA CORPORATION: REVENUE SHARE BY SEGMENT, 2017 (%)
FIGURE 16. ALCOA CORPORATION: REVENUE SHARE BY REGION, 2017 (%)
FIGURE 17. NORSK HYDRO ASA: REVENUE, 20152017 ($MILLION)
FIGURE 18. NORSK HYDRO ASA: REVENUE SHARE BY SEGMENT, 2017 (%)
FIGURE 19. NORSK HYDRO ASA: REVENUE SHARE BY REGION, 2017 (%)
FIGURE 20. RIO TINTO ALCAN INC.: REVENUE, 20152017 ($MILLION)
FIGURE 21. RIO TINTO ALCAN INC.: REVENUE SHARE BY SEGMENT, 2017 (%)
FIGURE 22. RIO TINTO ALCAN INC.: REVENUE SHARE BY REGION, 2017 (%)
FIGURE 23. ARCONIC INC.: REVENUE, 20152017 ($MILLION)
FIGURE 24. ARCONIC INC.: REVENUE SHARE BY SEGMENT, 2017 (%)
FIGURE 25. ARCONIC INC.: REVENUE SHARE BY REGION, 2017 (%)
FIGURE 26. CENTURY ALUMINUM COMPANY: REVENUE, 20152017 ($MILLION)
FIGURE 27. CENTURY ALUMINUM COMPANY: REVENUE SHARE BY SEGMENT, 2017 (%)
FIGURE 28. CENTURY ALUMINUM COMPANY: REVENUE SHARE BY REGION, 2017 (%)
FIGURE 29. UNITED COMPANY RUSAL: REVENUE, 20152017 ($MILLION)
FIGURE 30. UNITED COMPANY RUSAL: REVENUE SHARE BY SEGMENT, 2017 (%)
FIGURE 31. UNITED COMPANY RUSAL: REVENUE SHARE BY REGION, 2017 (%)
FIGURE 32. KAISER ALUMINUM: REVENUE, 20152017 ($MILLION)
FIGURE 33. KAISER ALUMINUM: REVENUE SHARE BY SEGMENT, 2017 (%)
FIGURE 34. KAISER ALUMINUM: REVENUE SHARE BY REGION, 2017 (%)


The development of the transportation industry and increase in expenditure for construction in the advanced & developing economies drive the growth of the aluminum market in North America. Rapid growth of cities and potential uses of aluminum as copper substitute in power industry further fuel the market growth. Rapid development and urbanization fuel the growth of the aluminum market in the emerging economies such as India and China. Stringent regulations toward carbon emissions and strong focus on environment stewardship in most of the developed countries boosts the adoption of aluminum in the transportation sector in developed economies, as its use in vehicles reduces fuel consumption and assists to reduce hazardous emissions. On an average, lightweight vehicles present in the European Union (EU) member countries and the U.S. contain 148 kg of aluminum.

PURCHASE OPTIONS

Call or Email us

U.S.-Canada Toll-free: +1-800-792-5285
Int'l : +1-503-894-6022
Europe : +44-845-528-1300
Email : help@alliedmarketresearch.com

Looking for Customization?

 Customization Request

Have a Question?

 Speak with Analyst

Any Confusion?

 Inquire Before Buying

Have a glance of the Report

  Request Sample

Purchase Full Report of
North America Aluminum Market

Start reading instantly.
This Report and over 66,804+ more Reports, Available with Avenue Library. T&C*.

  • Online Only
  • $3,456
  • Online cloud access only
  • Restricted print, copy, paste & download
  • Read only
  • Free industry update
    (Within 180 days)
  • Free report update in next update cycle
    (Jan 2020 - Jan 2021)
  • Data Pack
  • $3,840
  • Restricted to one authorized user
  • One print only
  • Available in
    Excel
  • Free industry update
    (Within 180 days)
  •   Free report update in next update cycle
    (Jan 2020 - Jan 2021)
  • Single User
  • $5,769
  • Restricted to one authorized user
  • One print only
  • Available in
    PDF
  • Free industry update
    (Within 180 days)
  •   Free report update in next update cycle
    (Jan 2020 - Jan 2021)
  • Five Users
  • $6,450
  • Limited to five authorized users
  • Print upto five copies
  • Available in
    PDF
  • Free industry update
    (Within 180 days)
  •   Free report update in next update cycle
    (Jan 2020 - Jan 2021)
  • Enterprise
    License/PDF

  • $10,995
  • Unlimited
    within
    company/enterprise
  • Available in Excel & PDF
  • Free industry update
    (Within 180 days)
  •   Free report update in next update cycle
    (Jan 2020 - Jan 2021)
  • Library
    Membership

  • $999 $ 1,175
    Per User/ Per month/ Billed annually
  • Published Content
    E-access
  • Company Profiles
    E-access
  • Newly Added Content Access
  • 10 PDF
    Downloads
  • 5 Excel Data
    Pack Downloads
  • 250 Company Profiles PDF Downloads
  • Buy Now

*Taxes/Fees, if applicable will be added during checkout. All prices in USD

RELATED REPORTS
 

Why Allied Market Research?


Infallible Methodology

To ensure high-level data integrity, accurate analysis, and impeccable forecasts

Analyst Support

For complete satisfaction

Customization

On-demand customization of scope of the report to exactly meet your needs

TARGETED MARKET VIEW

Targeted market view to provide pertinent information and save time of readers

Get fresh content delivered

Get insights on topics that are crucial for your business. Stay abreast of your interest areas.

Get Industry Data Alerts

Why Allied Market Research?

Infallible Methodology

To ensure high-level data integrity, accurate analysis, and impeccable forecasts

Analyst Support

For complete satisfaction

Customization

On-demand customization of scope of the report to exactly meet your needs

TARGETED MARKET VIEW

Targeted market view to provide pertinent information and save time of readers