
North America and Europe Home Decor and Accessories Market Overview, 2030
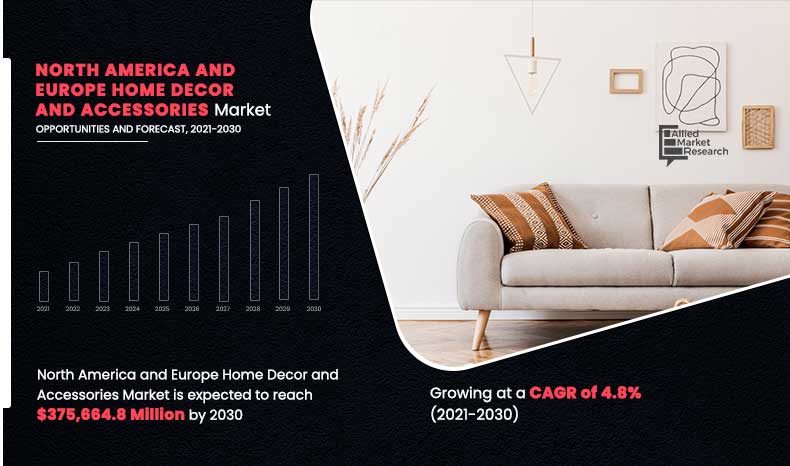
The North America and Europe home decor and accessories market was valued at $230,783.2 million in 2020, and is estimated to reach $375,664.8 million by 2030, registering a CAGR of 4.8% from 2021 to 2030. Increase in population density in metro cities has been majorly driving the growth of the North America and Europe home decor and accessories market. People are majorly migrating from rural areas to metro cities in the search of job opportunities and staying there lifelong. This migration creates huge opportunities for real estate, where various home decor products are required. Various home decor include furniture, kitchenware, bathroom storage & accessories, serveware, and others. Surge in urbanized population creates huge demand for home decor as people living in metro cities are considerably seeking for high standard of living. Furthermore, growth in urbanization has resulted in more spending power of consumer on products which shows their good social status and wealth. In addition, changing lifestyle of individuals along with raising consumer desire to reveal social status by a greater home decor products availability will further create a huge demand for home décor and accessories products market.
There is an increase in the number of social media users owing to rise in internet penetration. Moreover, social media usage growth from 2019 to 2020 in North America has increased to +6.96% and in Europe +4.32%. Considering this, most of the key players in the home decor market strategize on promoting their products and services on these social media platforms such as Facebook, Instagram, YouTube, and others. Social media marketing is one of the major strategies adopted by various companies and industries on imparting awareness about their product offerings among target customers on social media channels. Thus, the North America and Europe home decor and accessories market sights critical opportunity in gaining traction and increases the customer reach among its target segments, through social media marketing strategy.
The North America and Europe home decor and accessories market is segmented into product type, and price point. On the basis of product type, the market is divided into kitchen & dining, bedding, bath, and decor. As per price point, it is categorized into mass and premium. Region wise, it is studied across North America and Europe.
By product type, the kitchen and dining segment dominated the market in 2020, and is expected to retain its dominance throughout North America and Europe home decor and accessories market forecast period. Surge in urbanization, increase in number of households, and rise in disposable income are some of the prominent factors that boost the growth of the kitchen and dining market.
By Product Type
Kitchen and dining segment dominates the global market and is expected to retain its dominance throughout the forecast period.
By price point, the North America and Europe home decor and accessories market is divided into mass and premium. Mass segment lead in terms of market share and is expected to continue to grow with robust CAGR during the forecast period. By region, North America accounted for highest market share in 2020, and is expected to grow at a CAGR of 4.3%.
By Price Point
Premium segment is expected to grow at a highest CAGR of 5.5% during the forecast period.
The players in the North America and Europe home decor and accessories market have adopted acquisition as their key development strategy to increase profitability and to strengthen their foothold in the North America and Europe home decor and accessories market share. In addition, players have relied on product launch to improve their product portfolio and stay competitive in the global market. The key players profiled in the North America and Europe home decor and accessories industry include Bed Bath & Beyond Inc., Amazon.com, Inc., Cymax Group Technologies Ltd., Inter IKEA Holding B.V., Overstock.com, Inc., Target Corporation, Walmart Inc., Wayfair Inc., Williams-Sonoma, Inc. and SHEIN.
By Region
North America dominates the market and is expected to grow with a CAGR of 4.3% during the forecast period
Covid-19 Impact Analysis
- COVID-19 is an infectious disease that originated in Hubei province of the Wuhan city in China in late December 2020.
- The global coronavirus pandemic has created a number of challenges for exporters in the developing and developed countries. The challenges witnessed by the exporters of North America and Europe home decor and accessories market products are likely to remain for the foreseeable future, as different states and governments around the world attempt to tackle COVID-19 with various measures.
- Owing to the outbreak of the COVID-19 pandemic, manufacturers have increased online sale of home decor and accessories products to reach a large consumer base.
- Implementation of curfew and the practice of maintaining social distancing globally affect the domestic as well as international production, which in turn, hampers the growth of the overall market.
- Import and export restrictions on goods and quarantine and lockdown measures imposed by governments are key challenges exporters are facing during this pandemic.
Key Benefits For Stakeholders
- This report provides a quantitative analysis of the market segments, current trends, estimations, and dynamics of the North America and Europe home decor and accessories market analysis from 2020 to 2030 to identify the prevailing market opportunities.
- The market research is offered along with information related to key drivers, restraints, and North America and Europe home decor and accessories market opportunities.
- Porter’s five forces analysis highlights the potency of buyers and suppliers to enable stakeholders make profit-oriented business decisions and strengthen their supplier–buyer network.
- In-depth analysis of the North America and Europe home decor and accessories market segmentation assists to determine the prevailing market opportunities.
- Major countries in each region are mapped according to their revenue contribution to the market industry.
- Market player positioning facilitates benchmarking and provides a clear understanding of the present position of the market players.
- The report includes the analysis of the North America and Europe home decor and accessories market trends, key players, market segments, application areas, and North America and Europe home decor and accessories market growth strategies.
North America and Europe Home Decor and Accessories Market Report Highlights
| Aspects | Details |
| By Product Type |
|
| By Price Point |
|
| By Region |
|
Analyst Review
Innovation is the key for the growth of the home decor market in terms of value sales The North America and Europe home decor and accessories market is expected to exhibit notable growth during the forecast period, owing to increase in consumer’s interest toward the concept of home decor. In addition, upsurge in urban population and development of the real estate industry fosters the sales of home decor products, thereby fueling the growth of the market.
Furthermore, increase in disposable income and improvement in life style of individuals are expected to offer remunerative opportunities for investors in the home decor market. In the current scenario, eco-friendly home decor products are gaining high acceptance among consumers. Thus, players operating in the market are consolidating their efforts in developing eco-friendly products to capitalize on the increase in demand. Operating players in the market compete on certain parameters such as product design, style, and quality of raw materials. Furthermore, many manufacturers are collaborating with importers, contractors, and interior designers to sell their home decor products. Companies have further opted for e-commerce platforms to sell their products and increase their profit margins by reducing the distribution costs.
The North America and Europe home decor and accessories market was valued at $230,783.2 million in 2020, and is estimated to reach $375,664.8 million by 2030, registering a CAGR of 4.8% from 2021 to 2030.
The forecast period in the North America and Europe home decor and accessories Market report is 2021-2030.
2020 is the base year calculated in the North America and Europe home decor and accessories Market report.
The top companies in the North America and Europe home decor and accessories Market are Bed Bath & Beyond Inc., Amazon.com, Inc., Cymax Group Technologies Ltd., Inter IKEA Holding B.V., Overstock.com, Inc., Target Corporation, Walmart Inc., Wayfair Inc., Williams-Sonoma, Inc. and SHEIN
Kitchen and Dining is the most influencing segment growing in the North America and Europe home decor and accessories Market report.
Kitchen and Dining holds the maximum market share of the North America and Europe home decor and accessories Market.
The company profile has been selected on the basis of prominent players in the market.
The market value of the North America and Europe home decor and accessories Market in 2020 is $230,783.2 million.
Loading Table Of Content...

