0
2019
North America Data Center Cooling Market

North America Data Center Cooling Market

by Component (Solution and Service), Type of Cooling (Room-based Cooling, Rack-based Cooling, and Row-based Cooling), Type of Data Center (Enterprise Data Center, Colocation Data Center, Wholesale Data Center, and Hyperscale Data Center), Industry Vertical (BFSI, Manufacturing, IT & Telecom, Media & Entertainment, Retail, Government & Defense, Healthcare, Energy, and Others): Opportunity Analysis and Industry Forecast, 2018 - 2025

Report Code: A04855
Mar 2019 | Pages: 188
Tables: 67
Charts: 54
  • Formats*:

  • pdf

    Single User License, Five User
    License & Enterprise User License

  • xls

    Data Pack Excel License

  • ppt

    It comes with the additional cost
    of $2500.00 contact sales.


COVID-19

Pandemic disrupted the entire world and affected many industries.

Get detailed COVID-19 impact analysis on the North America Data Center Cooling Market

Request Now !

North America Data Center Cooling Market Outlook - 2025

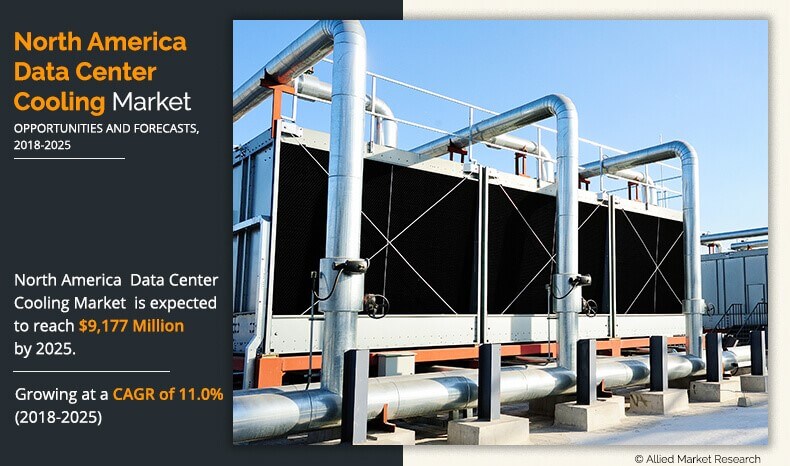
Data center operators use cooling solutions to maintain temperature in data centers within a permissible limit. Data centers are required to work efficiently 24/7 to process huge chunks of data. In data processing, the equipment dissipates heat energy, which generates the need for cooling to prevent the equipment from damage due to overheating. Air-based and water-based are two types of cooling systems. Through air-based cooling, air is circulated in the data center to maintain the temperature. On the other hand, water-based cooling is further bifurcated into immersion cooling and water-cooled racks where liquid coolants flow across hot components to maintain the temperature. The North America data center cooling market size was valued at $4,020 million in 2017, and is projected to reach $9,177 million by 2025, growing at a CAGR of 11.0% from 2018 to 2025.

Data center cooling is adopted by data center operators due to its eco-friendly, energy-efficiency, and cost-effective nature. There is an increase in the number of data centers due to rise in the use of 4G LTE networks. Therefore, with surge in number of data centers, there is a growing demand for data center cooling solutions to reduce the overall IT cost for data centers.

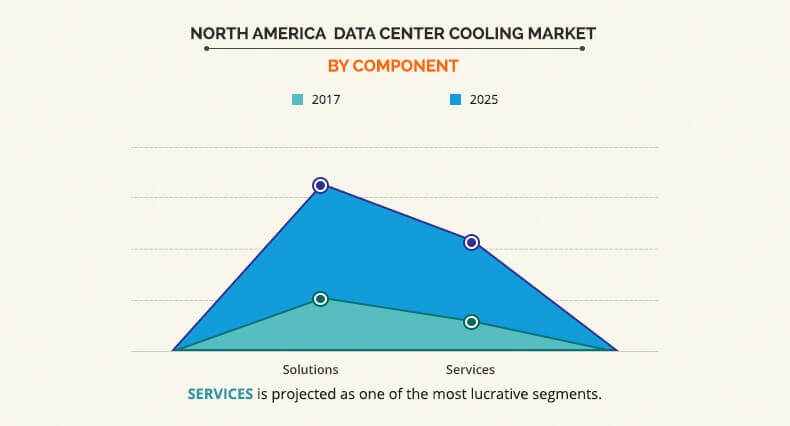
The solution segment dominated the North America data center cooling market share in 2017 due to rise in adoption of energy-efficient, environment-friendly, and cost-effective cooling solutions because of the stringent environmental safety rules imposed by various governments. Air conditioners under solution sub-segment had the largest data center cooling market share due to its energy-efficiency and cost-effectiveness. Therefore, there is a need for efficient cooling with increase in number of data centers and higher density in data centers. Air conditioners with the help of air ducts circulate air in the high-density racks to maintain the temperature within permissible limit. However, services in the component segment witnessed high CAGR in the North America data center cooling market due to increase in number of service providers for installation & deployment, support & maintenance, and consulting for data center cooling solutions. Data center cooling solutions are required to be installed properly as leakages in cooling will lead to damage of equipment.

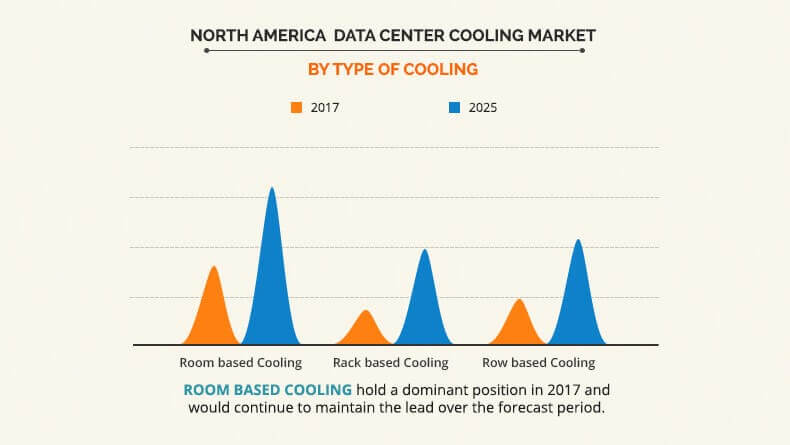
Room-based cooling had the largest North America data center cooling market share in type of cooling segment due to effective cooling at less cost. This type of cooling is anticipated to maintain a large market share due to least use of pipes and ducts compared to other cooling types. Air-conditioners and other air-based cooling circulate air in data centers to maintain temperature within permissible limit. Room-based cooling is gaining ground due to its energy-efficient cooling. However, rack-based cooling is expected to grow at the highest CAGR in the upcoming years due to the extreme density capability. In addition, rack-based cooling reduces the airflow path length of CRAH fan resulting in increased operational efficiency along with being energy efficient. Rack-based cooling is highly recommendable to high-density rack data centers.

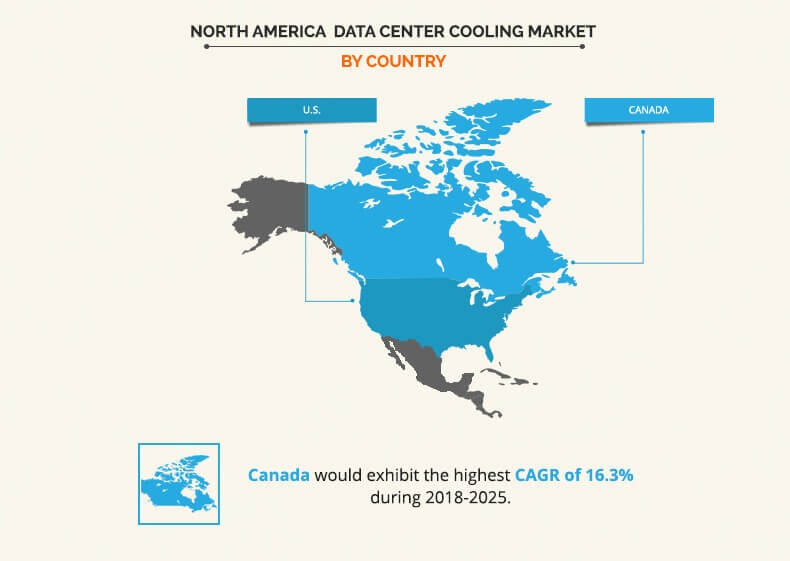
U.S. dominated the overall North America data center cooling market size in 2017 due to the growth in development of hyperscale and colocation facilities with a power capacity of more than 100 MW. Moreover, the larger number of development projects in South-Eastern and South-Western regions, particularly in Virginia & Texas in the U.S. are the largest revenue contributors of the market. Also, introduction of high-performance infrastructure and launch of rack as well as row-based cooling solutions are expected to revolutionize the market over the next few years. However, Canada is expected to witness the highest growth rate during the North America data center cooling market forecast period due to increase in number of datacenters in Canada due to numerous factors which includes low energy costs, political stability, bandwidth and ease of doing business and others are expected to positively affect the market.

The report focuses on the growth prospects, restraints, and North America data center cooling market trends. The study provides Porters five forces analysis of the North America data center cooling industry to understand the impact of various factors, such as bargaining power of suppliers, competitive intensity of competitors, threat of new entrants, threat of substitutes, and bargaining power of buyers on the North America data center cooling market.

Segment review

The North America data center cooling market is segmented based on component, type of cooling, type of data centers, industry verticals, and regions. In terms of component, the market is bifurcated into solution and service. Based on type of cooling, it is classified into room-based cooling, rack-based cooling, and row-based cooling. Based on type of data centers, it is categorized into enterprise data centers, colocation data centers, wholesale data centers, and hyperscale data centers. In terms of industry vertical, the market is classified into BFSI, manufacturing, IT & telecom, media & entertainment, retail, government & defense, healthcare, energy, and others. Based on the country, it is analyzed across U.S. and Canada.

The report provides North America data center cooling market analysis of key players operating in the market including Schneider Electric Se; Black Box Corporation; Nortek Air Solutions, LLC; Emerson Electric Co.; Hitachi, Ltd.; Rittal GmbH & Co. Kg; Fujitsu Ltd.; Stulz GmbH; Vertiv; and Asetek.

Top impacting factors

Increase in the demand for efficient and cost-effective data centers, green initiatives for eco-friendly data center solutions, substantial growth with data center, and power density drive the market growth. However, requirement of specialized infrastructure and higher investment cost and cooling challenges during power outage are expected to hamper the growth during the North America data center cooling market forecast period.

Furthermore, emergence of liquid-based cooling and portable cooling technologies and growth in requirement for modular data center cooling approach are anticipated to provide lucrative opportunities for the North America data center cooling market.

Substantial growth with data center and power density

In recent past, there is an increase in the number of data centers. To increase the performance of the data centers, more processors are being used in a given space which results in increasing density. The requirement of power and cooling has increased along with increase in density. Furthermore, the power density of data centers experiences growth by an average of 1.5 kW per rack, which results in limited air distribution and increased heat generation. In general, the IT equipment typically require between 100 and 160 cfm of air per kW, but in a dense environment it reduces to less than 100, which results in higher heat generation.

Emergence of liquid-based cooling and portable cooling technology

Emergence of liquid-based cooling and portable cooling technology in North America data center cooling market is providing lucrative opportunities for the growth of the data center cooling market. The current trend in IT is to increase server density, which means increasing the power of the chips, placing more chips per rack unit, and filling up the racks as much as possible. Therefore, the rack power has transitioned from a normal 3.5-4 kW to support 60-70 kW per rack, which will generate an enormous amount of heat. Furthermore, it is difficult to move the amount of heat generated with forced air as the fan power and compressor power is unmanageable, which in turn is expected to increase the demand for liquid-based cooling techniques in the enterprise IT data centers.

Cooling challenges during power outage

Power outages are critical in data centers as data centers are required to work efficiently 24/7. Power outage shuts down the cooling systems, which results in shutdown of data center to prevent equipment from any damage. This shutdown results in reduced overall performance and financial risk to the business. It also results in damage of equipment and affect their lifecycle. Therefore, power outage is a key restraint which impedes North America data center cooling market growth. To avoid aforementioned restraint, the data centers should be constructed in areas with almost zero power outage and preferably using renewable source of energy for uninterrupted energy. Secondly, the data centers and its cooling systems should be provided with power backup to avoid the losses.

Key Benefits for North America Data Center Cooling Market:

  • This study includes the North America data center cooling market analysis along with the North America data center cooling market forecast, trends and future estimations to determine the imminent investment pockets.
  • The report presents information related to key drivers, restraints, and opportunities.
  • The current market is quantitatively analyzed from 2018 to 2025 to highlight the financial competency of the industry.
  • Porters five forces analysis illustrates the potency of buyers & suppliers in the North America data center cooling industry.

North America Data Center Cooling Market Report Highlights

Aspects Details
By Component
  • Solutions
  • Services
By Type
  • Room-based Cooling
  • Rack-based Cooling
  • Row-based Cooling
By Type
  • Enterprise Data Centers
  • Colocation Data Centers
  • Wholesale Data Centers
  • Hyperscale Data Centers
  • Others
By Industry Vertical
  • BFSI
  • Manufacturing
  • IT & Telecom
  • MEDIA & ENTERTAINMENT
  • RETAIL
  • GOVERNMENT & DEFENSE
  • HEALTHCARE
  • ENERGY
  • OTHERS
By Country
  • U.S.
  • Canada
Key Market Players FUJITSU LIMITED, VERTIV CO., ASETEK, NORTEK AIR SOLUTIONS, STULZ GMBH, SCHNEIDER ELECTRIC, HITACHI, LTD., BLACK BOX CORPORATION, EMERSON ELECTRIC CO., RITTAL GMBH & CO. KG
 

CHAPTER 1:    INTRODUCTION

1.1.    REPORT DESCRIPTION
1.2.    KEY BENEFITS FOR STAKEHOLDERS
1.3.    RESEARCH METHODOLOGY

1.3.1.    Secondary research
1.3.2.    Primary research
1.3.3.    Analyst tools & models

CHAPTER 2:    EXECUTIVE SUMMARY

2.1.    CXO PERSPECTIVE

CHAPTER 3:    MARKET OVERVIEW

3.1.    MARKET DEFINITION AND SCOPE
3.2.    KEY FINDINGS

3.2.1.    Top impacting factors
3.2.2.    Top investment pockets
3.2.3.    Top winning strategies

3.3.    PORTER'S FIVE FORCES ANALYSIS
3.4.    KEY PLAYER POSITIONING, 2017
3.5.    MARKET DYNAMICS

3.5.1.    Drivers

3.5.1.1.    Increase in the demand for efficient and cost-effective data centers
3.5.1.2.    Green initiatives for eco-friendly data center solutions
3.5.1.3.    Substantial growth with data center and power density

3.5.2.    Restraints

3.5.2.1.    Requirement of specialized infrastructure and higher investment cost
3.5.2.2.    Cooling challenges during power outage

3.5.3.    Opportunities

3.5.3.1.    Emergence of liquid-based cooling and portable cooling technology
3.5.3.2.    Growth in requirement for modular data center cooling approach

CHAPTER 4:    NORTH AMERICA DATA CENTER COOLING MARKET, BY COMPONENTS

4.1.    OVERVIEW
4.2.    SOLUTIONS

4.2.1.    Key market trends, growth factors, and opportunities
4.2.2.    Market size and forecast, by country
4.2.3.    Market analysis, by country
4.2.4.    Data center cooling solutions market, by component type

4.2.4.1.    Air conditioners
4.2.4.2.    Air handling unit
4.2.4.3.    Chiller
4.2.4.4.    Cooling towers
4.2.4.5.    Pumps
4.2.4.6.    Others
4.2.4.7.    North America data center cooling solutions market size and forecast, by component type

4.3.    SERVICES

4.3.1.    Key market trends, growth factors and opportunities
4.3.2.    Market size and forecast, by country
4.3.3.    Market analysis by country
4.3.4.    North America data center cooling services market, by type

4.3.4.1.    Installation & deployment
4.3.4.2.    Support & Maintenance
4.3.4.3.    Consulting
4.3.4.4.    North America data center cooling services market size and forecast, by type

CHAPTER 5:    NORTH AMERICA DATA CENTER COOLING MARKET, BY TYPE OF COOLING

5.1.    OVERVIEW
5.2.    ROOM-BASED COOLING

5.2.1.    Key market trends, growth factors, and opportunities
5.2.2.    Market size and forecast, by country
5.2.3.    Market analysis by country
5.2.4.    Route to market analysis

5.3.    RACK-BASED COOLING

5.3.1.    Key market trends, growth factors, and opportunities
5.3.2.    Market size and forecast, by country
5.3.3.    Market analysis by country
5.3.4.    Route to market analysis

5.4.    ROW-BASED COOLING

5.4.1.    Key market trends, growth factors and opportunities
5.4.2.    Market size and forecast, by country
5.4.3.    Market analysis by country
5.4.4.    Route to market analysis

CHAPTER 6:    DATA CENTER COOLING MARKET, BY TYPE OF DATA CENTER

6.1.    OVERVIEW
6.2.    ENTERPRISE DATA CENTER

6.2.1.    Key market trends, growth factors and opportunities
6.2.2.    Market size and forecast, by country
6.2.3.    Market analysis by country

6.3.    COLOCATION DATA CENTER

6.3.1.    Key market trends, growth factors and opportunities
6.3.2.    Market size and forecast, by country
6.3.3.    Market analysis by country

6.4.    WHOLESALE DATA CENTER

6.4.1.    Key market trends, growth factors, and opportunities
6.4.2.    Market size and forecast, by country
6.4.3.    Market analysis by country

6.5.    HYPERSCALE DATA CENTER

6.5.1.    Key market trends, growth factors, and opportunities
6.5.2.    Market size and forecast, by country
6.5.3.    Market analysis by country

6.6.    OTHERS

6.6.1.    Key market trends, growth factors, and opportunities
6.6.2.    Market size and forecast, by country
6.6.3.    Market analysis by country

CHAPTER 7:    NORTH AMERICA DATA CENTER COOLING MARKET, BY INDUSTRY VERTICAL

7.1.    OVERVIEW
7.2.    BFSI

7.2.1.    Key market trends, growth factors and opportunities
7.2.2.    Market size and forecast, by country
7.2.3.    Market analysis by country

7.3.    MANUFACTURING

7.3.1.    Key market trends, growth factors and opportunities
7.3.2.    Market size and forecast, by country
7.3.3.    Market analysis by country

7.4.    IT & TELECOM

7.4.1.    Key market trends, growth factors, and opportunities
7.4.2.    Market size and forecast, by country
7.4.3.    Market analysis by country

7.5.    MEDIA & ENTERTAINMENT

7.5.1.    Key market trends, growth factors, and opportunities
7.5.2.    Market size and forecast, by country
7.5.3.    Market analysis by country

7.6.    RETAIL

7.6.1.    Key market trends, growth factors and opportunities
7.6.2.    Market size and forecast, by country
7.6.3.    Market analysis, by country

7.7.    GOVERNMENT & DEFENSE

7.7.1.    Key market trends, growth factors, and opportunities
7.7.2.    Market size and forecast, by country
7.7.3.    Market analysis, by country

7.8.    HEALTHCARE

7.8.1.    Key market trends, growth factors, and opportunities
7.8.2.    Market size and forecast, by country
7.8.3.    Market analysis, by country

7.9.    ENERGY

7.9.1.    Key market trends, growth factors, and opportunities
7.9.2.    Market size and forecast, by country
7.9.3.    Market analysis, by country

7.10.    OTHERS

7.10.1.    Key market trends, growth factors, and opportunities
7.10.2.    Market size and forecast, by country
7.10.3.    Market analysis, by country

CHAPTER 8:    DATA CENTER COOLING MARKET, BY COUNTRY

8.1.    OVERVIEW
8.2.    U.S.

8.2.1.    Market size and forecast, by component
8.2.2.    Market size and forecast, by type of cooling
8.2.3.    Market size and forecast, by type of data center
8.2.4.    Market size and forecast, by industry vertical

8.3.    CANADA

8.3.1.    Market size and forecast, by component
8.3.2.    Market size and forecast, by type of cooling
8.3.3.    Market size and forecast, by type of data center
8.3.4.    Market size and forecast, by industry vertical

CHAPTER 9:    COMPANY PROFILE

9.1.    ASETEK

9.1.1.    Company overview
9.1.2.    Company snapshot
9.1.3.    Operating business segments
9.1.4.    Product portfolio
9.1.5.    Business performance
9.1.6.    Key strategic moves and developments

9.2.    BLACK BOX CORPORATION

9.2.1.    Company overview
9.2.2.    Company snapshot
9.2.3.    Product portfolio
9.2.4.    Business performance

9.3.    EMERSON ELECTRIC CO.

9.3.1.    Company overview
9.3.2.    Company snapshot
9.3.3.    Operating business segments
9.3.4.    Product portfolio
9.3.5.    Business performance
9.3.6.    Key strategic moves and developments

9.4.    FUJITSU LIMITED

9.4.1.    Company overview
9.4.2.    Company snapshot
9.4.3.    Operating business segments
9.4.4.    Product portfolio
9.4.5.    Business performance
9.4.6.    Key strategic moves and developments

9.5.    HITACHI, LTD.

9.5.1.    Company overview
9.5.2.    Company snapshot
9.5.3.    Operating business segments
9.5.4.    Product portfolio
9.5.5.    Business performance

9.6.    NORTEK AIR SOLUTIONS

9.6.1.    Company overview
9.6.2.    Company snapshot
9.6.3.    Product portfolio
9.6.4.    Key strategic moves and developments

9.7.    RITTAL GMBH & CO. KG

9.7.1.    Company overview
9.7.2.    Company snapshot
9.7.3.    Product portfolio
9.7.4.    Key strategic moves and developments

9.8.    STULZ GMBH

9.8.1.    Company overview
9.8.2.    Company snapshot
9.8.3.    Product portfolio
9.8.4.    Key strategic moves and developments

9.9.    SCHNEIDER ELECTRIC

9.9.1.    Company overview
9.9.2.    Company snapshot
9.9.3.    Operating business segments
9.9.4.    Product portfolio
9.9.5.    Business performance
9.9.6.    Key strategic moves and developments

9.10.    VERTIV CO.

9.10.1.    Company overview
9.10.2.    Company snapshot
9.10.3.    Operating business segments
9.10.4.    Product portfolio
9.10.5.    Key strategic moves and developments

LIST OF TABLES

TABLE 01.    NORTH AMERICA DATA CENTER COOLING MARKET REVENUE, BY COMPONENTS, 2017–2025($MILLION)
TABLE 02.    DATA CENTER COOLING MARKET REVENUE FOR SOLUTIONS, BY COUNTRY, 2017–2025($MILLION)
TABLE 03.    DATA CENTER COOLING MARKET REVENUE FOR SOLUTION, BY COMPONENT TYPE, 2017–2025($MILLION)
TABLE 04.    DATA CENTER COOLING MARKET REVENUE FOR SERVICES, BY COUNTRY, 2017–2025($MILLION)
TABLE 05.    DATA CENTER COOLING MARKET REVENUE FOR SOLUTION, BY TYPE, 2017–2025($MILLION)
TABLE 06.    NORTH AMERICA NORTH AMERICA DATA CENTER COOLING MARKET REVENUE, BY TYPE OF COOLING , 2017–2025($MILLION)
TABLE 07.    DATA CENTER COOLING MARKET REVENUE FOR ROOM-BASED COOLING TYPE, BY COUNTRY,2017-2025 ($MILLION)
TABLE 08.    DATA CENTER COOLING MARKET REVENUE FOR RACK-BASED COOLING TYPE, BY COUNTRY, 2017-2025 ($MILLION), BY COUNTRY, 2017–2025($MILLION)
TABLE 09.    DATA CENTER COOLING MARKET REVENUE FOR ROW-BASED COOLING TYPE, BY COUNTRY, 2017–2025($MILLION)
TABLE 10.    NORTH AMERICA DATA CENTER COOLING MARKET REVENUE, BY TYPE OF DATA CENTER, 2017–2025($MILLION)
TABLE 11.    NORTH AMERICA DATA CENTER COOLING MARKET REVENUE FOR ENTERPRISE DATA CENTER, BY COUNTRY, 2017–2025($MILLION)
TABLE 12.    NORTH AMERICA DATA CENTER COOLING MARKET REVENUE FOR COLOCATION DATA CENTER, BY COUNTRY, 2017–2025($MILLION)
TABLE 13.    NORTH AMERICA DATA CENTER COOLING MARKET REVENUE FOR WHOLESALE DATA CENTER, BY COUNTRY, 2017–2025($MILLION)
TABLE 14.    NORTH AMERICA DATA CENTER COOLING MARKET REVENUE FOR HYPERSCALE DATA CENTER, BY COUNTRY, 2017–2025($MILLION)
TABLE 15.    NORTH AMERICA DATA CENTER COOLING MARKET REVENUE FOR OTHER DATA CENTER, BY COUNTRY, 2017–2025($MILLION)
TABLE 16.    NORTH AMERICA DATA CENTER COOLING MARKET REVENUE, BY INDUSTRY VERTICAL, 2017–2025($MILLION)
TABLE 17.    NORTH AMERICA DATA CENTER COOLING MARKET REVENUE FOR BFSI , BY COUNTRY, 2017–2025($MILLION)
TABLE 18.    NORTH AMERICA DATA CENTER COOLING MARKET REVENUE FOR MANUFATURING, BY COUNTRY, 2017–2025($MILLION)
TABLE 19.    NORTH AMERICA DATA CENTER COOLING MARKET REVENUE FOR IT & TELECOM, BY COUNTRY, 2017–2025($MILLION)
TABLE 20.    NORTH AMERICA DATA CENTER COOLING MARKET REVENUE FOR MEDIA & ENTERTAINMENT, BY COUNTRY, 2017–2025($MILLION)
TABLE 21.    NORTH AMERICA DATA CENTER COOLING MARKET REVENUE FOR RETAIL , BY COUNTRY, 2017–2025($MILLION)
TABLE 22.    NORTH AMERICA DATA CENTER COOLING MARKET REVENUE FOR GOVERNMENT & DEFENCE, BY COUNTRY, 2017–2025($MILLION)
TABLE 23.    NORTH AMERICA DATA CENTER COOLING MARKET REVENUE FOR HEALTHCARE, BY COUNTRY, 2017–2025($MILLION)
TABLE 24.    NORTH AMERICA DATA CENTER COOLING MARKET REVENUE FOR ENERGY, BY COUNTRY, 2017–2025($MILLION)
TABLE 25.    NORTH AMERICA DATA CENTER COOLING MARKET REVENUE FOR OTHERS, BY COUNTRY, 2017–2025($MILLION)
TABLE 26.    DATA CENTER COOLING MARKET REVENUE, BY COUNTRY, 2017–2025($MILLION)
TABLE 27.    U.S. DATA CENTER COOLING MARKET, BY COMPONENT, 2017–2025($MILLION)
TABLE 28.    U.S. DATA CENTER COOLING MARKET, BY TYPE OF COOLING , 2017–2025($MILLION)
TABLE 29.    U.S. DATA CENTER COOLING MARKET, BY TYPE OF DATA CENTER, 2017–2025($MILLION)
TABLE 30.    U.S. DATA CENTER COOLING MARKET, BY INDUSTRY VERTICAL, 2017–2025($MILLION)
TABLE 31.    CANADA DATA CENTER COOLING MARKET, BY COMPONENT, 2017–2025($MILLION)
TABLE 32.    CANADA DATA CENTER COOLING MARKET, BY TYPE OF COOLING , 2017–2025($MILLION)
TABLE 33.    CANADA DATA CENTER COOLING MARKET, BY TYPE OF DATA CENTER, 2017–2025($MILLION)
TABLE 34.    CANADA DATA CENTER COOLING MARKET, BY INDUSTRY VERTICAL, 2017–2025($MILLION)
TABLE 35.    ASETEK: COMPANY SNAPSHOT
TABLE 36.    ASETEK: OPERATING SEGMENTS
TABLE 37.    ASETEK: PRODUCT PORTFOLIO
TABLE 38.    ASETEK: KEY STRATEGIC MOVES AND DEVELOPMENTS
TABLE 39.    BLACK BOX CORPORATION: COMPANY SNAPSHOT
TABLE 40.    BLACK BOX CORPORATION: PRODUCT PORTFOLIO
TABLE 41.    EMERSON ELECTRIC CO.: COMPANY SNAPSHOT
TABLE 42.    EMERSON ELECTRIC CO.: OPERATING SEGMENTS
TABLE 43.    EMERSON ELECTRIC CO.: PRODUCT PORTFOLIO
TABLE 44.    EMERSON ELECTRIC CO.: KEY STRATEGIC MOVES AND DEVELOPMENTS
TABLE 45.    FUJITSU: COMPANY SNAPSHOT
TABLE 46.    FUJITSU: OPERATING SEGMENTS
TABLE 47.    FUJITSU: PRODUCT PORTFOLIO
TABLE 48.    HITACHI, LTD.: COMPANY SNAPSHOT
TABLE 49.    HITACHI, LTD.: OPERATING SEGMENTS
TABLE 50.    HITACHI, LTD.: PRODUCT PORTFOLIO
TABLE 51.    NORTEK AIR SOLUTIONS: COMPANY SNAPSHOT
TABLE 52.    NORTEK AIR SOLUTIONS: PRODUCT PORTFOLIO
TABLE 53.    NORTEK AIR SOLUTIONS: KEY STRATEGIC MOVES AND DEVELOPMENTS
TABLE 54.    RITTAL GMBH & CO. KG: COMPANY SNAPSHOT
TABLE 55.    RITTAL GMBH & CO. KG: PRODUCT PORTFOLIO
TABLE 56.    RITTAL GMBH & CO. KG: KEY STRATEGIC MOVES AND DEVELOPMENTS
TABLE 57.    STULZ GMBH: COMPANY SNAPSHOT
TABLE 58.    STULZ GMBH: PRODUCT PORTFOLIO
TABLE 59.    STULZ GMBH: KEY STRATEGIC MOVES AND DEVELOPMENTS
TABLE 60.    SCHNEIDER ELECTRIC: COMPANY SNAPSHOT
TABLE 61.    SCHNEIDER ELECTRIC: OPERATING SEGMENTS
TABLE 62.    SCHNEIDER ELECTRIC: PRODUCT PORTFOLIO
TABLE 63.    SCHNEIDER ELECTRIC: KEY STRATEGIC MOVES AND DEVELOPMENTS
TABLE 64.    VERTIV CO.: COMPANY SNAPSHOT
TABLE 65.    VERTIV CO.: OPERATING SEGMENTS
TABLE 66.    VERTIV CO.: PRODUCT PORTFOLIO
TABLE 67.    VERTIV CO.: KEY STRATEGIC MOVES AND DEVELOPMENTS

LIST OF FIGURES

FIGURE 01.    NORTH AMERICA DATA CENTER COOLING MARKET, 2017–2025
FIGURE 02.    DATA CENTER COOLING MARKET, BY COUNTRY, 2017–2025
FIGURE 03.    NORTH AMERICA DATA CENTER COOLING MARKET: KEY PLAYERS
FIGURE 04.    NORTH AMERICA DATA CENTER COOLING MARKET SEGMENTATION
FIGURE 05.    TOP IMPACTING FACTORS
FIGURE 06.    TOP INVESTMENT POCKETS
FIGURE 07.    TOP WINNING STRATEGIES, BY YEAR, 2016-2019*
FIGURE 08.    TOP WINNING STRATEGIES, BY DEVELOPMENT, 2016-2019*
FIGURE 09.    TOP WINNING STRATEGIES, BY COMPANY, 2016-2019*
FIGURE 10.    MODERATE-TO-HIGH BARGAINING POWER OF SUPPLIER
FIGURE 11.    HIGH BARGAINING POWER OF BUYER
FIGURE 12.    MODERATE THREAT OF SUBSTITUTES
FIGURE 13.    MODERATE-TO-HIGH THREAT OF NEW ENTRANTS
FIGURE 14.    MODERATE-TO-HIGH COMPETITIVE RIVALRY
FIGURE 15.    DATA CENTER COOLING MARKET: KEY PLAYER POSITIONING, 2017
FIGURE 16.    DRIVERS, RESTRAINTS, AND OPPORTUNITIES
FIGURE 17.    COMPARATIVE SHARE ANALYSIS OF DATA CENTER COOLING MARKET FOR SOLUTIONS, BY COUNTRY,  2017 & 2025(%)
FIGURE 18.    COMPARATIVE SHARE ANALYSIS OF DATA CENTER COOLING MARKET FOR SERVICES, BY COUNTRY,  2017 & 2025(%)
FIGURE 19.    COMPARATIVE SHARE ANALYSIS OF ROOM-BASED COOLING MARKET, BY COUNTRY, 2017 & 2025(%)
FIGURE 20.    COMPARATIVE SHARE ANALYSIS OF RACK-BASED COOLING MARKET, BY COUNTRY, 2017 & 2025(%)
FIGURE 21.    COMPARATIVE SHARE ANALYSIS OF ROW-BASED COOLING MARKET, BY COUNTRY, 2017 & 2025(%)
FIGURE 22.    COMPARATIVE SHARE ANALYSIS OF DATA CENTER COOLING MARKET FOR ENTERPRISE DATA CENTER, BY COUNTRY, 2017 & 2025(%)
FIGURE 23.    COMPARATIVE SHARE ANALYSIS OF DATA CENTER COOLING MARKET REVENUE FOR COLOCATION DATA CENTER, BY COUNTRY, 2017 & 2025(%)
FIGURE 24.    COMPARATIVE SHARE ANALYSIS OF DATA CENTER COOLING MARKET REVENUE FOR WHOLESALE DATA CENTER, BY COUNTRY, 2017 & 2025(%)
FIGURE 25.    COMPARATIVE SHARE ANALYSIS OF DATA CENTER COOLING MARKET REVENUE FOR HYPERSCALE DATA CENTER, BY COUNTRY, 2017 & 2025(%)
FIGURE 26.    COMPARATIVE SHARE ANALYSIS OF DATA CENTER COOLING MARKET REVENUE FOR OTHER DATA CENTER, BY COUNTRY, 2017 & 2025(%)
FIGURE 27.    COMPARATIVE SHARE ANALYSIS OF DATA CENTER COOLING MARKET FOR BFSI, BY COUNTRY, 2017 & 2025(%)
FIGURE 28.    COMPARATIVE SHARE ANALYSIS OF DATA CENTER COOLING MARKET FOR MANUFACTURING, BY COUNTRY,  2017 & 2025(%)
FIGURE 29.    COMPARATIVE SHARE ANALYSIS OF DATA CENTER COOLING MARKET FOR IT & TELECOM, BY COUNTRY,  2017 & 2025(%)
FIGURE 30.    COMPARATIVE SHARE ANALYSIS OF DATA CENTER COOLING MARKET FOR MEDIA & ENTERTAINMENT, BY COUNTRY, 2017 & 2025(%)
FIGURE 31.    COMPARATIVE SHARE ANALYSIS OF DATA CENTER COOLING MARKET FOR RETAIL, BY COUNTRY, 2017 & 2025(%)
FIGURE 32.    COMPARATIVE SHARE ANALYSIS OF DATA CENTER COOLING MARKET FOR GOVERNMENT & DEFENCE, BY COUNTRY, 2017 & 2025(%)
FIGURE 33.    COMPARATIVE SHARE ANALYSIS OF DATA CENTER COOLING MARKET FOR HEALTHCARE, BY COUNTRY,  2017 & 2025(%)
FIGURE 34.    COMPARATIVE SHARE ANALYSIS OF DATA CENTER COOLING MARKET FOR ENERGY, BY COUNTRY,  2017 & 2025(%)
FIGURE 35.    COMPARATIVE SHARE ANALYSIS OF DATA CENTER COOLING MARKET FOR OTHERS, BY COUNTRY,  2017 & 2025(%)
FIGURE 36.    U.S. DATA CENTER COOLING MARKET, 2017–2025($MILLION)
FIGURE 37.    CANADA DATA CENTER COOLING MARKET, 2017–2025($MILLION)
FIGURE 38.    ASETEK: REVENUE, 2015–2017 ($MILLION)
FIGURE 39.    ASETEK: REVENUE SHARE BY SEGMENT, 2017 (%)
FIGURE 40.    ASETEK: REVENUE SHARE BY COUNTRY, 2017 (%)
FIGURE 41.    BLACK BOX CORPORATION: REVENUE, 2016–2018 ($MILLION)
FIGURE 42.    BLACK BOX CORPORATION: REVENUE SHARE BY SEGMENT, 2018 (%)
FIGURE 43.    EMERSON ELECTRIC CO.: REVENUE, 2016–2018 ($MILLION)
FIGURE 44.    EMERSON ELECTRIC CO.: REVENUE SHARE BY SEGMENT, 2018 (%)
FIGURE 45.    EMERSON ELECTRIC CO.: REVENUE SHARE BY COUNTRY, 2018 (%)
FIGURE 46.    FUJITSU: NET SALES, 2016–2018 ($MILLION)
FIGURE 47.    FUJITSU: REVENUE SHARE BY SEGMENT, 2018 (%)
FIGURE 48.    FUJITSU: REVENUE SHARE BY COUNTRY, 2018 (%)
FIGURE 49.    HITACHI, LTD.: REVENUE, 2016–2018 ($MILLION)
FIGURE 50.    HITACHI, LTD.: REVENUE SHARE BY SEGMENT, 2017 (%)
FIGURE 51.    HITACHI, LTD.: REVENUE SHARE BY COUNTRY, 2017 (%)
FIGURE 52.    SCHNEIDER ELECTRIC: REVENUE, 2016–2018 ($MILLION)
FIGURE 53.    SCHNEIDER ELECTRIC: REVENUE SHARE BY SEGMENT, 2018 (%)
FIGURE 54.    SCHNEIDER ELECTRIC: REVENUE SHARE BY COUNTRY, 2018 (%)


Owing to the increase in green initiatives and amid stringent environment regulations from government, data center operators are adopting cooling systems that emit least carbon footprints, thereby driving the growth of the global market. Moreover, data center cooling system manufacturers are introducing innovative products, which use less water while cooling the data centers. For instance, in June 2018, Microsoft has announced an eco-friendly data center that has been lowered into the sea waters near Orkney Island, Scotland, as a part of Phase 2 of Project Natick, which is expected to check the feasibility of systems on the seabed. Moreover, the data center operators are also focusing on using renewable source of energy such as geo-thermal energy to make data center cooling systems energy efficient and eco-friendly. Furthermore, data center operators are focusing to provide modular cooling and portable cooling to data centers present in mild temperature at reasonable pricing. The market is getting competitive with the rise in number of data centers.

Moreover, Canada has become an appealing data center location for number of companies, due to which large, global co-locators with customers based in Europe and Asia, who want to bring operations to North America but need regulations that protect the customer's privacy, are expanding their data center facilities in this region. For instance, according to “Data Centre Risk Index”, Canada is ranked second out of 20 countries, owing to numerous factors that are projected to affect successful data center operations. The North America data center cooling market is highly competitive due to the strong presence of the existing vendors. However, the data center cooling system vendors who have access to extensive technical and financial resources are anticipated to gain a competitive edge over their rivals, as they have the capacity to cater to the global market requirements. Furthermore, the competitive environment in this market is expected to further intensify with increase in technological innovations, product extensions, and different strategies adopted by the key vendors. Some of the major key players profiled in the report include Schneider Electric Se; Black Box Corporation; Nortek Air Solutions, LLC; Emerson Electric Co.; Hitachi, Ltd.; Rittal Gmbh & Co. Kg; Fujitsu Ltd.; Stulz Gmbh; Vertiv; and Asetek.

PURCHASE OPTIONS

Call or Email us

U.S.-Canada Toll-free: +1-800-792-5285
Int'l : +1-503-894-6022
Europe : +44-845-528-1300
Email : help@alliedmarketresearch.com

Looking for Customization?

 Customization Request

Have a Question?

 Speak with Analyst

Any Confusion?

 Inquire Before Buying

Have a glance of the Report

  Request Sample

Purchase Full Report of
North America Data Center Cooling Market

Start reading instantly.
This Report and over 67,068+ more Reports, Available with Avenue Library. T&C*.

  • Online Only
  • $3,456
  • Online cloud access only
  • Restricted print, copy, paste & download
  • Read only
  • Free industry update
    (Within 180 days)
  • Free report update in next update cycle
    (Mar 2020 - Mar 2021)
  • Data Pack
  • $3,840
  • Restricted to one authorized user
  • One print only
  • Available in
    Excel
  • Free industry update
    (Within 180 days)
  •   Free report update in next update cycle
    (Mar 2020 - Mar 2021)
  • Single User
  • $5,769
  • Restricted to one authorized user
  • One print only
  • Available in
    PDF
  • Free industry update
    (Within 180 days)
  •   Free report update in next update cycle
    (Mar 2020 - Mar 2021)
  • Five Users
  • $6,450
  • Limited to five authorized users
  • Print upto five copies
  • Available in
    PDF
  • Free industry update
    (Within 180 days)
  •   Free report update in next update cycle
    (Mar 2020 - Mar 2021)
  • Enterprise
    License/PDF

  • $10,995
  • Unlimited
    within
    company/enterprise
  • Available in Excel & PDF
  • Free industry update
    (Within 180 days)
  •   Free report update in next update cycle
    (Mar 2020 - Mar 2021)
  • Library
    Membership

  • $999 $ 1,175
    Per User/ Per month/ Billed annually
  • Published Content
    E-access
  • Company Profiles
    E-access
  • Newly Added Content Access
  • 10 PDF
    Downloads
  • 5 Excel Data
    Pack Downloads
  • 250 Company Profiles PDF Downloads
  • Buy Now

*Taxes/Fees, if applicable will be added during checkout. All prices in USD

RELATED REPORTS
 

Why Allied Market Research?


Infallible Methodology

To ensure high-level data integrity, accurate analysis, and impeccable forecasts

Analyst Support

For complete satisfaction

Customization

On-demand customization of scope of the report to exactly meet your needs

TARGETED MARKET VIEW

Targeted market view to provide pertinent information and save time of readers

Get fresh content delivered

Get insights on topics that are crucial for your business. Stay abreast of your interest areas.

Get Industry Data Alerts

Why Allied Market Research?

Infallible Methodology

To ensure high-level data integrity, accurate analysis, and impeccable forecasts

Analyst Support

For complete satisfaction

Customization

On-demand customization of scope of the report to exactly meet your needs

TARGETED MARKET VIEW

Targeted market view to provide pertinent information and save time of readers