
North America Premise Cable Market Overview:
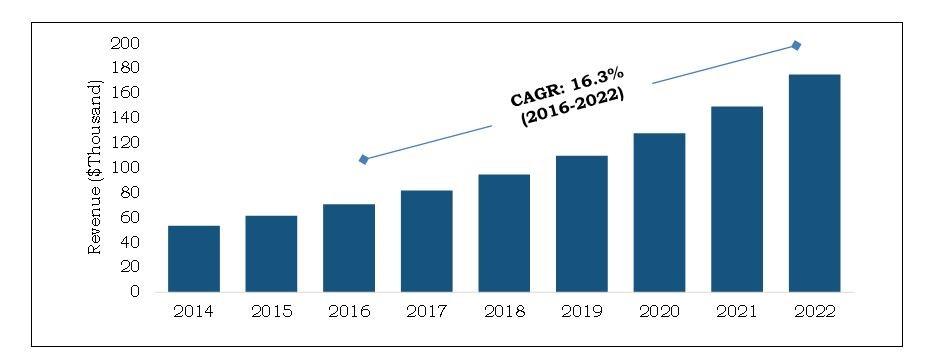
North America Premise Cable Market is expected to reach $2,004 million in 2022 from $1,173 million in 2015, growing at a CAGR of 7.9% from 2016 to 2022. Premise cables refer to inter-building or intra-building networking cables, which are used for data transmission in telecommunication closets, server rooms, and entrance facilities. These cables are used for short-distance data transmission, that is, within the premises. However, these cables cover a distance of around hundred m when operated on their maximum data transfer rate.
The growing demand for data on both fixed and mobile networks builds pressure on operators to invest in improved copper or fiber networks and provide connectivity in reach of consumers. In the recent years, increased Internet activity was witnessed, in terms of live content for media, which resulted in large volume of data generation. Therefore, requirement of high Internet speed and reliable data transmission cables drives the growth of the North America premise cable market. The improved cable technology and easy installation & connection are some of the factors augmenting the growth for the market. However, with the emergence of Internet of Things that promotes wireless networking, are expected to fail. This is expected to significantly impact the North America premise cable market in the forthcoming years.
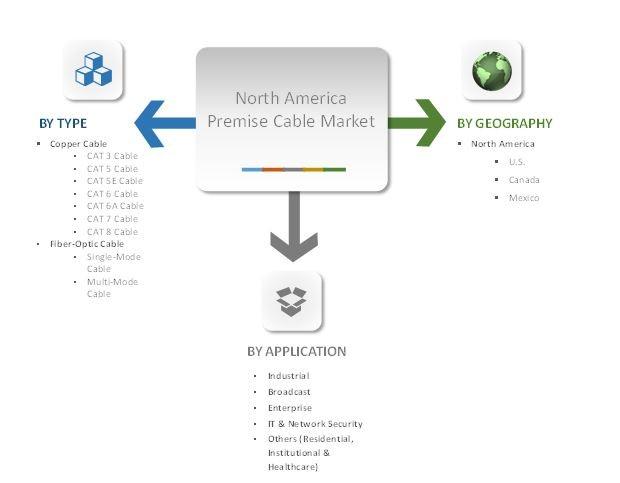
Market Segmentation
Escalated Demand for High Speed Connectivity Devices and Systems
Currently high-speed connectivity devices and systems gained popularity among the industrial applications to cater to the need of smooth and secure transmission of data. The use of high-speed networking lines helps the manufacturing facilities to analyze real-time data and improvise the production processes accordingly. For many connected devices such as networked surveillance cameras or IP cameras, two connections are needed, which include electrical connection and the actual network connection. Premise cabling provide several common techniques to transmit PoE cabling. Two of them were standardized by IEEE 802.3 in 2003. This advantage of premise cables is expected to provide lucrative opportunities to the market.
Geographical Scenario
The North America premise cable market in the U.S. is anticipated to witness decent growth throughout the forecast period. This is attributed to the focus on the U.S. market by the key market players operating in the North America region. The North America premise cable market in the U.S. dominated the market in 2015 during the forecast period.
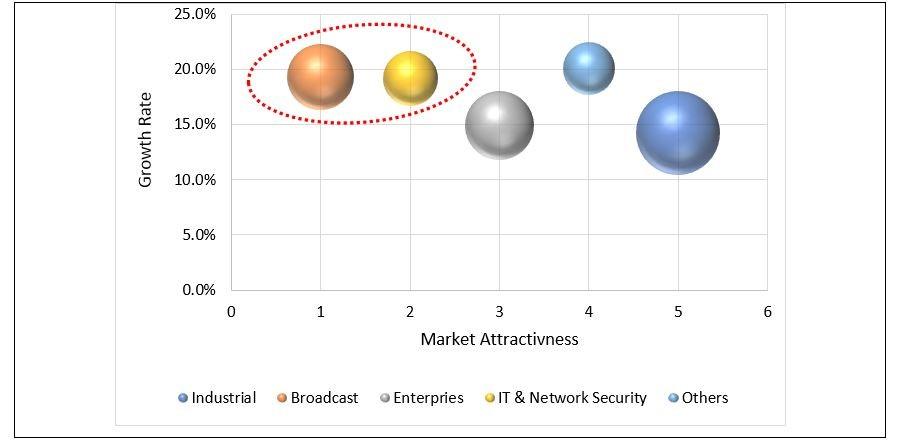
Top Investment Pockets
The North America premise cable market is segregated into five categories based on application, namely, industrial, broadcast, enterprise, IT & network security, and others. Industrial application has the highest revenue generating segment whereas broadcast followed by IT network and security are the most lucrative markets.
The key players profiled in the report are Anixter Inc., Belden Inc., General Cable Technologies Corporation, Hitachi, Ltd., HellermannTyton, Nexans, Prysmian Group, Schneider Electric, Siemens AG, and The Siemon Company. Other players in the value chain include Premise Cable Systems Inc., Comcast Cable, Sterlite Tech, AQ Communications LLC, GM Cable Contractors, Inc., and Copper State Communications.
Key Benefits
- The report provides an in-depth analysis of the North America premise cable market across countries in North America, and the estimated revenues generated during the forecast period.
- The projections in the report are based on the analysis of the current trends and highlight the North America premise cable market potential for the period of 2016-2022, in terms of value.
- Extensive analysis of the market by closely following product benchmarking, positioning, and monitoring of the top contenders within the industry.
- Provides quantitative and qualitative trends to help stakeholders to understand the situations prevailing in the North America premise cable market.
North America Premise Cable Market Report Highlights
| Aspects | Details |
| By Application |
|
| By Type |
|
| By Country |
|
| By Key Market Players |
|
Analyst Review
The growth in demand for data, data centers, and data transmission are making the use of advanced cables and wires imperative for the current time usage. The use of compatible cables is vital, owing to cloud computing entering in the data center ecosystem along with the growth in need for security, convergence of technologies, and use of software for improved data center infrastructure management.
Considering the increase in the requirement for high data transmission speed and ongoing advancements, the market participants of cables & wires industry focus on providing diverse category of products. Growth in inclination toward fiber-optic cables from the conventionally used copper cables exhibit the current scenario usage of much efficient cables for data transmission. However, the choice of cable type depends on multiple factors, such as data transmission speed, bandwidth, impact of the power loss, and distance range.
The copper cable manufacturers, such as Hitachi, Belden, and Nexans, are consistently trying to overcome the shortcomings in the existing products related to the issues mentioned earlier. The development of CAT8 cable is a significant example of the ongoing advancements in this industry, which is designed to support short-distance requirement (between 5 and 30 meters), runs at 25-40Gbit/s transmission rate.
Furthermore, the government across countries in North America are providing substantial support to the premise cable market by bringing advancement in the data transmission network through either new installation or improvisation in the existing ones. For instance, in 2016, the Government of Canada announced an investment of CAD 500 Million to improve the broadband services in rural and remote parts of the country by 2021. This will be achieved by the use of backbone network development through fiber-optic cables. The government primarily aims to enhance rural and remote communities through “Connect to Innovate” program so as to create jobs for middle-class families and their participation in digital economy.
Loading Table Of Content...

