
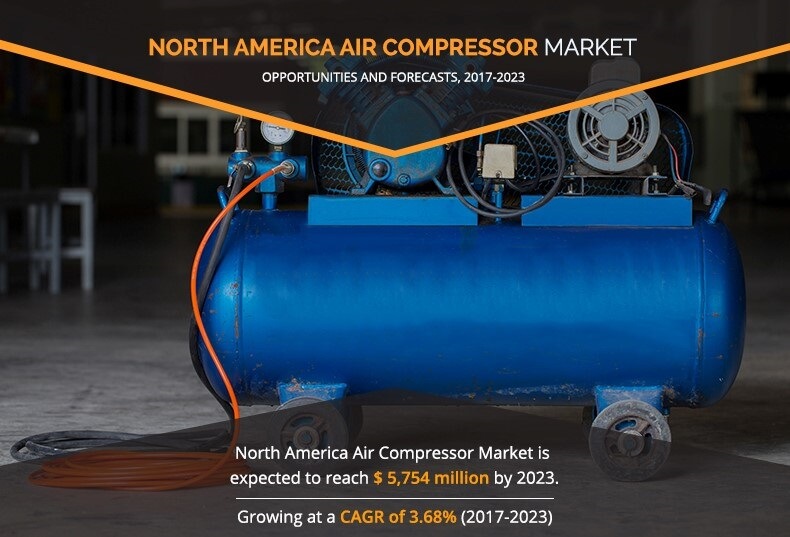
North America Air Compressor Market Overview:
The North America Air Compressor Market generated $4,475 million in 2016, and is projected to reach $5,754 million by 2023, registering a CAGR of 3.68% during the forecast period (2017-2023). The major factors that drive the market are high energy efficiency, low maintenance cost, environmental friendliness, portability, and ability to deliver variation in supplied pressure support the market growth. In addition, growth associated with end-use industries, surge in requirement for technologically advanced products, and rise in application areas also boost the growth of the North America air compressor market. On the other hand, some of the restraints associated with this market are increase in cost of raw material, noise pollution, emission of contaminated compressed air, bulky size, and others.
The increase in the number of industrial infrastructure projects, and the ever-increasing investment across all the process industries, especially oil & gas industry supplements the market growth across various industry domains. Further, penetration of IoT, initiatives such as Industry 4.0, and technological advancements related to new product development are expected to fuel the market demand during the forecast period. Wide-scale adoption of air compressors in industrial and personal applications is expected to drive the North American air compressor market growth.
Segment Overview
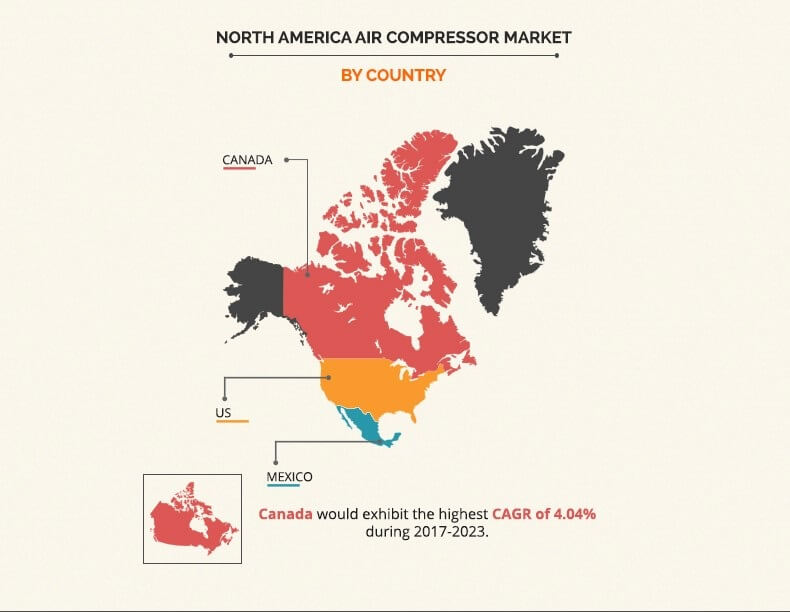
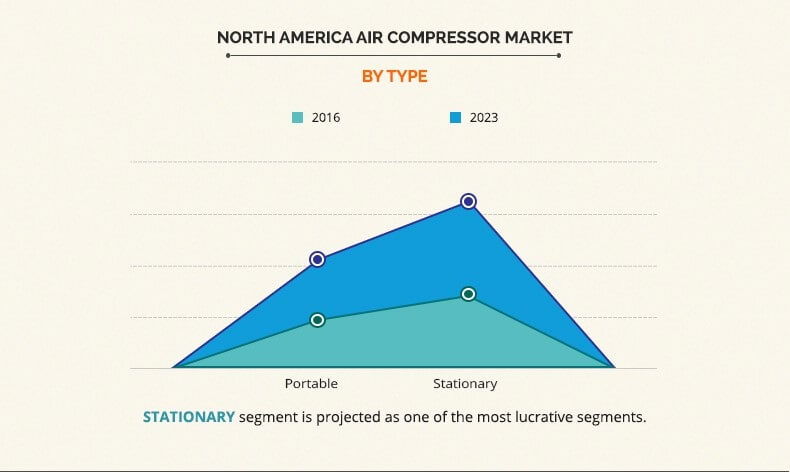
The North America air compressor market is segmented based on type, technology, lubrication method, and country. The type segment is bifurcated into portable and stationary air compressors. In accordance to the technology, air compressors are classified as rotary, centrifugal, and reciprocating. Based on the lubrication method, the market is classified into oiled and oil-free air compressors. To gain a diverse insight, the market is analyzed across major countries in North America. Based on countries, the North America air compressor market is analyzed across the U.S., Mexico, and Canada.
Key Market Segmentation

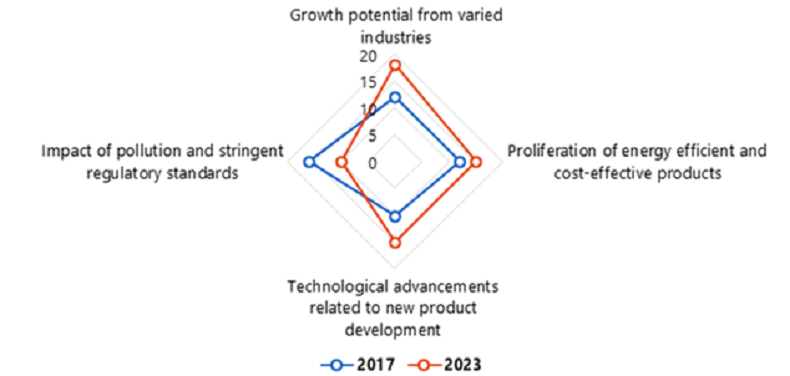
Top Impacting Factors
The North American air compressor market is influenced by numerous factors, including growth potential from varied industries, high adoption due to availability of energy-efficient products, demand for technologically advanced & low-cost products, and others. These factors collectively provide opportunities for the North American air compressor market growth. However, each factor has its definite impact on the market.
Top Impacting Factors
The North America Air Compressor Market
The North America Air Compressor Market by Country
The North America Air Compressor Market by Type
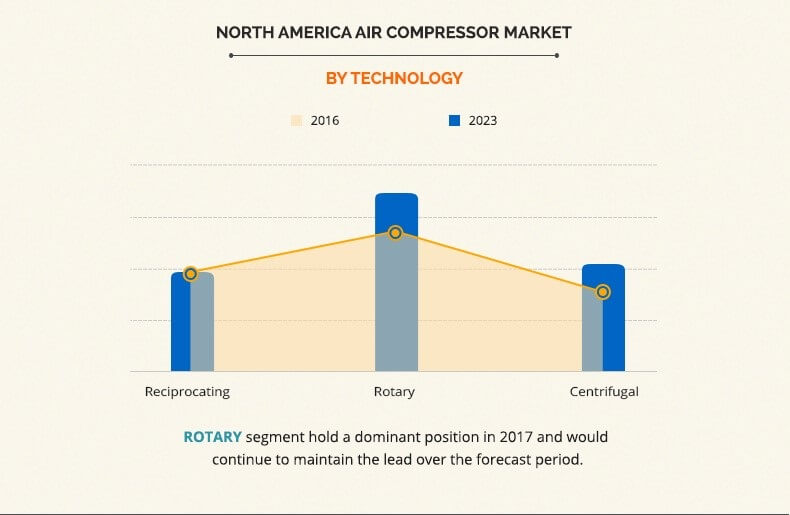
The North America Air Compressor Market by Technology
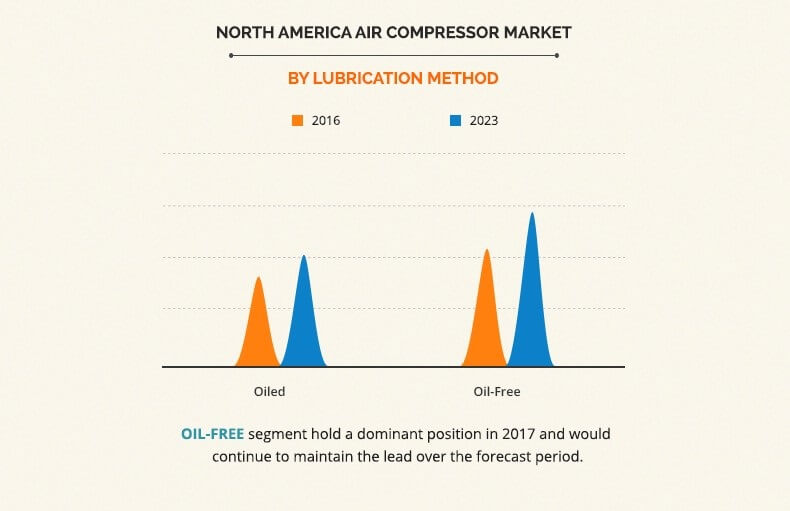
The North America Air Compressor Market by Lubrication Method
Growth of Oil and Mining Industries in North America
Growth associated with the oil industry and natural gas production in North America is a prominent factor that may fuel the market demand during the forecast period. According to EIA's Annual Energy Outlook, the U.S. crude output is going to increase by 20% by 2030, and the demand for natural gas is estimated to attain around 15.6% of growth over the next few years. Further, expenditure by the U.S. oil and gas companies is expected to increase during the forecast period. Natural gas is gaining importance as the preferred fuel option, owing to its low emission and low-cost properties. Thus, many projects in North America are currently focusing on exploration of the same. There are more than 14,000 small and large oil & gas companies in the U.S. alone. Air compressors have wide-scale application in the oil and mining industries, which may act as a driver for the air compressor industry.
Impact of Pollution and Stringent Regulatory Standards
Blowdown from air compressor, air contamination, and noise pollution hinder the adoption of air compressors in North America. Pollutants released can lead to a severe impact on the environment, workplace, and the product. Aerosols, condensed water, solid contamination, and others are some of the types of contamination that may cause environmental concerns, if not properly managed, which may restrain the market. However, key industry players and regulatory authorities are determined to reduce the impact of environmental hazards. For instance, in June 2017, Atlas Copco launched a range of oil-injected rotary screw air compressors. These compressors are powerful and are responsible for minimal noise pollution. Further, various industry standards such as ISO8573 Series, ISO12500 Series, ISO7183 Series, and others deal in this category. In addition, other industry standards, such as ISO 9001, ISO 14001, and OHSAS 18001, were introduced to improve quality standards by The International Organization for Standardization. Further, changing regulatory structure has affected the North America air compressor market adversely. For instance, the U.S. Department of Energy (DOE) published some new rules in 2017 related to testing of rotary screw compressors.
Key Benefits for Stakeholders
- The report provides an overview of the trends, structure, drivers, challenges, and opportunities in the North America air compressor market.
- Porter’s Five Forces analysis highlights the potential of buyers & suppliers and provides insights on the competitive structure of the market to determine the investment pockets.
- Current and future trends adopted by key market players are highlighted to determine overall competitiveness.
- The quantitative analysis of the market from 2016 to 2023 is provided to elaborate the market potential.
North America Air Compressor Market Key Segments:
By Type
- Portable
- Stationary
By Technology
- Rotary
- Centrifugal
- Reciprocating
By Lubrication Method
- Oiled
- Oil Free
By Country
- U.S.
- Canada
- Mexico
Key Players
- Atlas Copco
- Ingersoll Rand
- Suzler Ltd.
- Mitsubishi Heavy Industries
- Ebara Corp.
- Sullair
- Kobe Steel
- VMAC
- Campbell Hausfeld
- Porter Cable
North America Air Compressor Market Report Highlights
| Aspects | Details |
| By Type |
|
| By Technology |
|
| By Lubrication Method |
|
| By Country |
|
| Key Market Players | Ebara Corporation, Kobe Steel, Ltd., Ingersoll-Rand plc, Mitsubishi Heavy Industries Ltd., VMAC Global Technology Inc., Berkshire Hathaway Inc. (Campbell Hausfeld), Atlas Copco AB, Suzler Ltd, Hitachi, Ltd. (Sullair, LLC), Stanley Black & Decker Corporation (Porter Cable) |
Analyst Review
The North America air compressor market includes portable and stationary compressors. These compressors have witnessed increased adoption among manufacturing, energy, healthcare, chemicals, and other sectors over the past few years. Furthermore, the growth in demand for energy efficient and technologically advanced products, growth of end-use industries, and increased investment for new product development has encouraged the demand for the North America air compressor market. The market share is projected to grow at a CAGR of 3.68% from 2017 to 2023, owing to increase in demand for application-specific solutions.
Air compressors are increasingly deployed in the U.S., followed by Canada and Mexico. The U.S. showed the highest market share in 2016 due to increase in adoption air compressors end-use industries and rise in number of developmental strategies followed by market leaders for business expansion. The North America air compressor market is impacted by the need to improve the productivity of the business processes. However, air contamination caused due to oil lubrication in oiled air compressors and noisy operations of oil-free compressors limit the market growth.
In addition, various new products are being offered by air compressor manufacturers to meet the growing demand of consumers. For instance, in June 2017, Atlas Copco launched a range of oil-injected rotary screw air compressors. These compressors are powerful and are responsible for minimal noise pollution. In January 2017, Allmand Bros Inc. launched Maxi-Air portable air compressor. In October 2013, Senco launched range of 200 PSI oil-free portable air compressors.
Increased adoption of IoT among various industry verticals, rise in number of industrial infrastructure projects, and growth associated with end use industries are some of the factors projected to drive the North America air compressor market.
Industry players in the North America air compressor market are constantly upgrading and introducing innovative products and services to strengthen their North America air compressor market share and broaden customer base. For instance, in June 2017, Atlas Copco launched G200-250 (VSD) oil-injected rotary screw air compressor. It also increases energy efficiency by 10% and flow rate by 8%.
Loading Table Of Content...

