0
2022
Nose Reconstruction Market

Nose Reconstruction Market

by Type (Open Rhinoplasty, Closed Rhinoplasty), by Treatment (Augmentation, Reduction, Revision, Filler, Others), by End User (Hospitals, Plastic Surgery Clinics, Others): Global Opportunity Analysis and Industry Forecast, 2020-2030

Report Code: A13217
Mar 2022 | Pages: 212
Tables: 128
Charts: 55
  • Formats*:

  • pdf

    Single User License, Five User
    License & Enterprise User License

  • xls

    Data Pack Excel License

  • ppt

    It comes with the additional cost
    of $2500.00 contact sales.


Nose Reconstruction Market Research, 2030

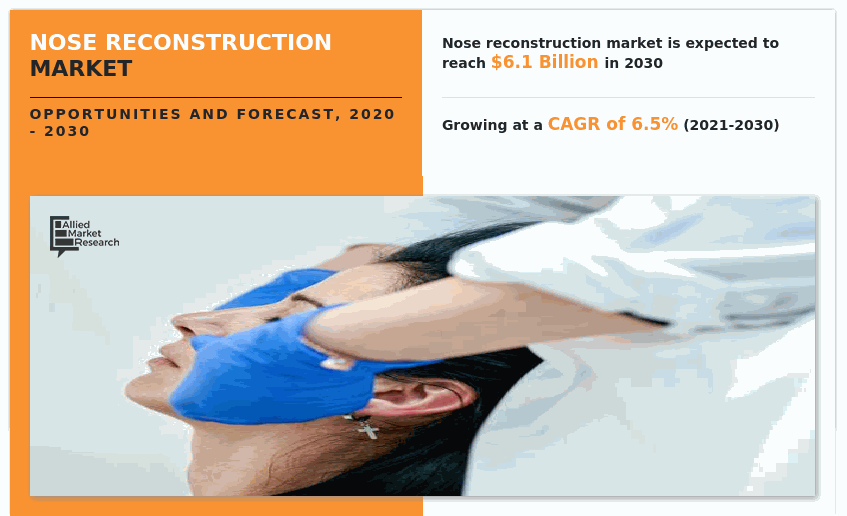
The global nose reconstruction market was valued at $3.3 billion in 2020, and is projected to reach $6.1 billion by 2030, growing at a CAGR of 6.5% from 2021 to 2030. Nose reconstruction is a method of changing the shape of the nose through surgical procedures to enhance the appearance and beauty of a person. Nose reconstruction surgery is also known as rhinoplasty. Nose reconstruction surgeries are mainly categorized as open rhinoplasty and closed rhinoplasty. Rhinoplasty is done to change the size, shape, or proportions of the nose. It may be done to repair deformities from an injury, correct a birth defect, or improve some breathing difficulties.
The market was negatively impacted by the COVID-19 pandemic. Owing to a decline in the number of surgeries or postponed worldwide to reserve or redirect the available limited capacities and resources (such as hospital beds and patient care professionals) toward COVID-19 patient care. This led to a decline in the number of patients visiting hospitals & clinics for nose reconstruction surgery, as these patients are more vulnerable to COVID-19 infection, which led to a decline in demand for nose reconstruction products across the world.

The Rhinoplasty Market trendsis majorly driven by an increase in the prevalence of road accidents, the presence of congenital nasal deformities, and an increase in healthcare expenditure of people. Many road accidents cause injuries to the nose and result in nasal deformation. Nasal reconstruction procedures are used to restore nose structure after accidental conditions. In addition, these nasal reconstruction surgeries boost confidence and help patients to recover from accident trauma. For instance, as per the U.S. Department of Transportation’s National Highway Traffic Safety Administration (NHTSA) report published in February 2022, an estimated 31,720 people died in motor vehicle traffic crashes from January through September 2021, an increase of approximately 12% from the 28,325 fatalities projected for the January to September of 2020. Moreover, the betterment of the financial condition of people from developing nations is expected to drive the Rhinoplasty Market growth.

Furthermore, an increase in advancements for nose reconstruction surgeries and a rise in the number of  R&D activities for new nose reconstruction instruments contribute to the growth of the market. In addition, an increase in demand for cosmetic reconstruction procedures to improve appearance drives the growth of the market. For instance, according to the American Society of Plastic Surgeons (ASPS), nearly 7 million reconstructive procedures were performed and about 352,555 nasal reshaping procedures were performed in 2020. However, these numbers decreased by 15% as plastic surgery clinics were closed due to COVID-19.

Technological advancements in nose reconstruction devices are anticipated to contribute to the growth of the market. In addition increase in the use of innovative products such as 3D integrated piezotome osteotomy and surgical intraoperative navigation and new approved ultrasound technological devices for nose rhinoplasty also propel the growth of the nose reconstruction market. In addition, new technologies such as minimally invasive rhinoplasty and 3D imaging help in faster recovery. Moreover, ultrasonic rhinoplasty uses specialized tools to reshape nasal bones for a more refined shape providing various Rhinoplasty Market opportunity.  However, the high cost of nose reconstruction surgeries impedes the growth of the market.

The global nose reconstruction market is segmented into type, treatment, end-user, and region. By type, the market is categorized into open rhinoplasty and closed rhinoplasty. Depending on the treatment, it is fragmented into augmentation, reduction, revision, filler, and others. By per end-user, it is divided into hospitals, plastic surgery clinics, and others. Region-wise, the Rhinoplasty Market analysis is done across North America, Europe, Asia-Pacific, and LAMEA.

By Type
Nose Reconstruction Market

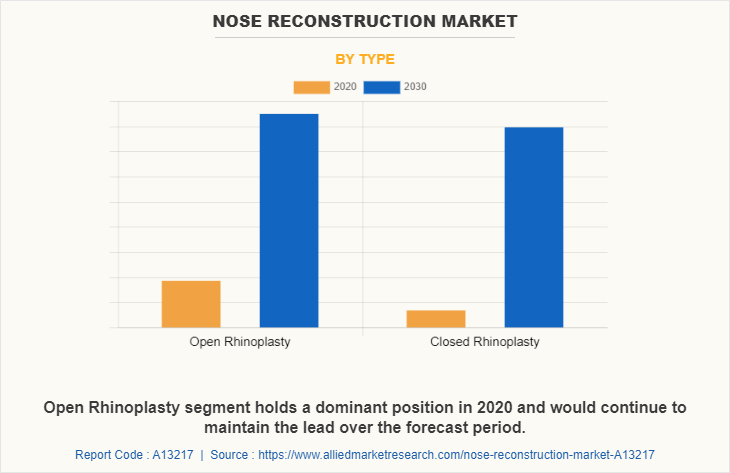
Depending on type, the open rhinoplasty segment dominated the market in 2020, and this trend is expected to continue during the forecast period, owing to increase in number of nose reshaping cases across the world. However, the closed rhinoplasty segment is expected to witness considerable growth during the forecast period, due to surge in adoption of nose reconstruction instruments are the key factors anticipating the growth of the market.

By Treatment
Nose Reconstruction Market

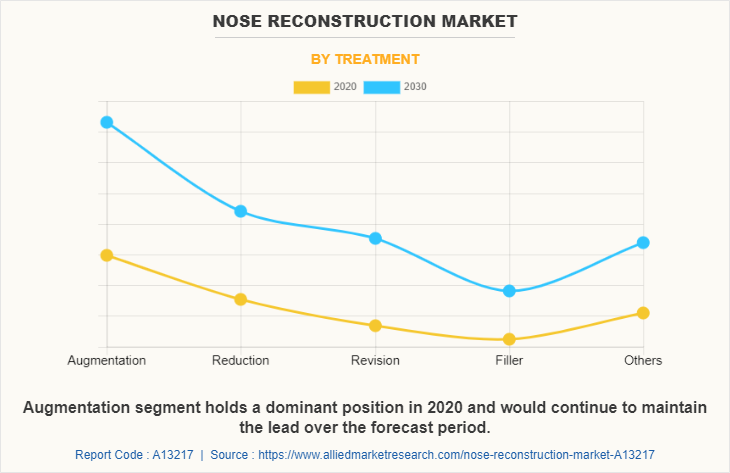
Based on treatment, the augmentation systems segment dominated the market in 2020, and this trend is expected to continue during the forecast period, owing to prevalence of congenital nasal defects across the world. However, the reduction segment is expected to witness considerable growth during the forecast period, nose reconstruction devices across the world is key factors anticipating the growth of market.

By End User
Nose Reconstruction Market

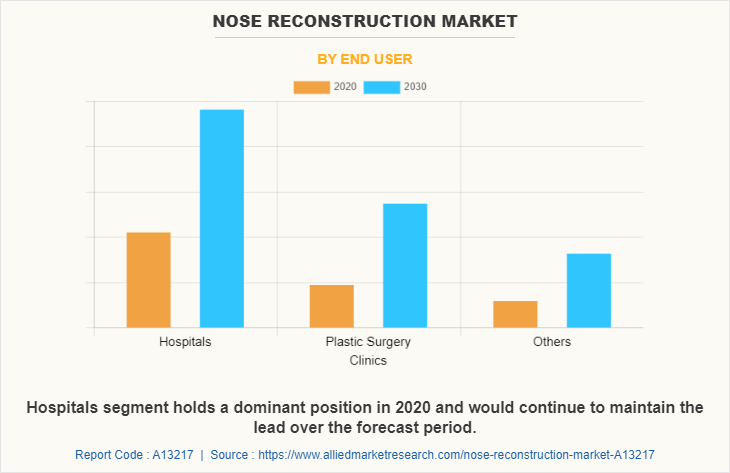
Depending on end user, the hospitals segment was the major contributor in 2020 and is expected to maintain its lead during the forecast period, owing to rise in number of patients visits in hospitals for nose reconstruction surgeries. However, the plastic surgery clinics segment is expected to witness considerable growth during the forecast period, increase in nasal surgeries and rise in adoption of nose reconstruction product across the world.

By Region
Nose Reconstruction Market

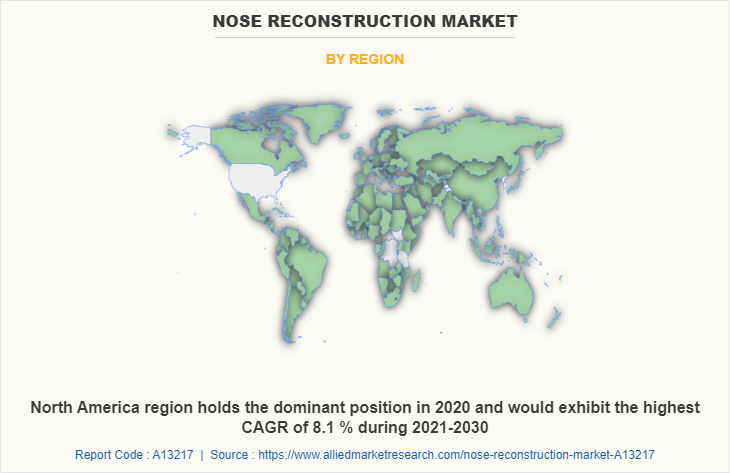
Depending on the region, North America garnered the major Rhinoplasty Market share in 2020, and is expected to dominate the global market during the forecast period, owing to the rise in prevalence of road accidents, presence of key players in the development of nasal reconstruction equipment and well-established healthcare infrastructure in the region. However, Asia-Pacific is expected to register the highest CAGR of 8.1% from 2021 to 2030, owing to an increase in the prevalence of congenital nasal deformities and a rise in healthcare expenditures are the key factors. anticipating the growth of the market.

The key players operating in the Rhinoplasty industry include Abbvie Inc., COMEG Medical Technologies, GC Aesthetics, Grand Aspeo, Implantech Associates, Johnson & Johnson, Koken, Stryker Corporation, Surgiform Technologies Ltd., and Wanhe Plastic Material.

Key Benefits For Stakeholders

  • This report provides a quantitative analysis of the market segments, current trends, estimations, and dynamics of the nose reconstruction market analysis from 2020 to 2030 to identify the prevailing nose reconstruction market opportunities.
  • The market research is offered along with information related to key drivers, restraints, and opportunities.
  • Porter's five forces analysis highlights the potency of buyers and suppliers to enable stakeholders make profit-oriented business decisions and strengthen their supplier-buyer network.
  • In-depth analysis of the nose reconstruction market segmentation assists to determine the prevailing market opportunities.
  • Major countries in each region are mapped according to their revenue contribution to the global market.
  • Market player positioning facilitates benchmarking and provides a clear understanding of the present position of the market players.
  • The report includes the analysis of the regional as well as global nose reconstruction market trends, key players, market segments, application areas, and market growth strategies.

Nose Reconstruction Market Report Highlights

Aspects Details
By End User
  • Hospitals
  • Plastic Surgery Clinics
  • Others
By Type
  • Open Rhinoplasty
  • Closed Rhinoplasty
By Treatment
  • Augmentation
  • Reduction
  • Revision
  • Filler
  • Others
By Region
  • North America  (U.S., Canada, Mexico)
  • Europe  (Spain, Rest of Europe, Germany, France, United Kingdom, Italy)
  • Asia-Pacific  (Japan, China, Australia, India, South Korea, Rest of Asia-Pacific)
  • LAMEA  (Brazil, Saudi Arabia, South Africa, Rest of LAMEA)
Key Market Players GC Aesthetics, Stryker, Surgiform Technologies LLC, Sunset Cosmetic Surgery, Implantech, Grover Aesthetics
 
  • CHAPTER 1:INTRODUCTION

    • 1.1.Report description

    • 1.2.Key market segments

    • 1.3.Key benefits to the stakeholders

    • 1.4.Research Methodology

      • 1.4.1.Secondary research

      • 1.4.2.Primary research

      • 1.4.3.Analyst tools and models

  • CHAPTER 2:EXECUTIVE SUMMARY

    • 2.1.Key findings of the study

    • 2.2.CXO Perspective

  • CHAPTER 3:MARKET OVERVIEW

    • 3.1.Market definition and scope

    • 3.2.Key findings

      • 3.2.1.Top investment pockets

    • 3.3.Porter’s five forces analysis

    • 3.4.Top player positioning

    • 3.5.Market dynamics

      • 3.5.1.Drivers

      • 3.5.2.Restraints

      • 3.5.3.Opportunities

    • 3.6.COVID-19 Impact Analysis on the market

  • CHAPTER 4: NOSE RECONSTRUCTION MARKET, BY TYPE

    • 4.1 Overview

      • 4.1.1 Market size and forecast

    • 4.2 Open Rhinoplasty

      • 4.2.1 Key market trends, growth factors and opportunities

      • 4.2.2 Market size and forecast, by region

      • 4.2.3 Market analysis by country

    • 4.3 Closed Rhinoplasty

      • 4.3.1 Key market trends, growth factors and opportunities

      • 4.3.2 Market size and forecast, by region

      • 4.3.3 Market analysis by country

  • CHAPTER 5: NOSE RECONSTRUCTION MARKET, BY TREATMENT

    • 5.1 Overview

      • 5.1.1 Market size and forecast

    • 5.2 Augmentation

      • 5.2.1 Key market trends, growth factors and opportunities

      • 5.2.2 Market size and forecast, by region

      • 5.2.3 Market analysis by country

    • 5.3 Reduction

      • 5.3.1 Key market trends, growth factors and opportunities

      • 5.3.2 Market size and forecast, by region

      • 5.3.3 Market analysis by country

    • 5.4 Revision

      • 5.4.1 Key market trends, growth factors and opportunities

      • 5.4.2 Market size and forecast, by region

      • 5.4.3 Market analysis by country

    • 5.5 Filler

      • 5.5.1 Key market trends, growth factors and opportunities

      • 5.5.2 Market size and forecast, by region

      • 5.5.3 Market analysis by country

    • 5.6 Others

      • 5.6.1 Key market trends, growth factors and opportunities

      • 5.6.2 Market size and forecast, by region

      • 5.6.3 Market analysis by country

  • CHAPTER 6: NOSE RECONSTRUCTION MARKET, BY END USER

    • 6.1 Overview

      • 6.1.1 Market size and forecast

    • 6.2 Hospitals

      • 6.2.1 Key market trends, growth factors and opportunities

      • 6.2.2 Market size and forecast, by region

      • 6.2.3 Market analysis by country

    • 6.3 Plastic Surgery Clinics

      • 6.3.1 Key market trends, growth factors and opportunities

      • 6.3.2 Market size and forecast, by region

      • 6.3.3 Market analysis by country

    • 6.4 Others

      • 6.4.1 Key market trends, growth factors and opportunities

      • 6.4.2 Market size and forecast, by region

      • 6.4.3 Market analysis by country

  • CHAPTER 7: NOSE RECONSTRUCTION MARKET, BY REGION

    • 7.1 Overview

      • 7.1.1 Market size and forecast

    • 7.2 North America

      • 7.2.1 Key trends and opportunities

      • 7.2.2 North America Market size and forecast, by Type

      • 7.2.3 North America Market size and forecast, by Treatment

      • 7.2.4 North America Market size and forecast, by End User

      • 7.2.5 North America Market size and forecast, by country

        • 7.2.5.1 U.S.
          • 7.2.5.1.1 Market size and forecast, by Type
          • 7.2.5.1.2 Market size and forecast, by Treatment
          • 7.2.5.1.3 Market size and forecast, by End User
        • 7.2.5.2 Canada
          • 7.2.5.2.1 Market size and forecast, by Type
          • 7.2.5.2.2 Market size and forecast, by Treatment
          • 7.2.5.2.3 Market size and forecast, by End User
        • 7.2.5.3 Mexico
          • 7.2.5.3.1 Market size and forecast, by Type
          • 7.2.5.3.2 Market size and forecast, by Treatment
          • 7.2.5.3.3 Market size and forecast, by End User
    • 7.3 Europe

      • 7.3.1 Key trends and opportunities

      • 7.3.2 Europe Market size and forecast, by Type

      • 7.3.3 Europe Market size and forecast, by Treatment

      • 7.3.4 Europe Market size and forecast, by End User

      • 7.3.5 Europe Market size and forecast, by country

        • 7.3.5.1 Germany
          • 7.3.5.1.1 Market size and forecast, by Type
          • 7.3.5.1.2 Market size and forecast, by Treatment
          • 7.3.5.1.3 Market size and forecast, by End User
        • 7.3.5.2 France
          • 7.3.5.2.1 Market size and forecast, by Type
          • 7.3.5.2.2 Market size and forecast, by Treatment
          • 7.3.5.2.3 Market size and forecast, by End User
        • 7.3.5.3 United Kingdom
          • 7.3.5.3.1 Market size and forecast, by Type
          • 7.3.5.3.2 Market size and forecast, by Treatment
          • 7.3.5.3.3 Market size and forecast, by End User
        • 7.3.5.4 Italy
          • 7.3.5.4.1 Market size and forecast, by Type
          • 7.3.5.4.2 Market size and forecast, by Treatment
          • 7.3.5.4.3 Market size and forecast, by End User
        • 7.3.5.5 Spain
          • 7.3.5.5.1 Market size and forecast, by Type
          • 7.3.5.5.2 Market size and forecast, by Treatment
          • 7.3.5.5.3 Market size and forecast, by End User
        • 7.3.5.6 Rest of Europe
          • 7.3.5.6.1 Market size and forecast, by Type
          • 7.3.5.6.2 Market size and forecast, by Treatment
          • 7.3.5.6.3 Market size and forecast, by End User
    • 7.4 Asia-Pacific

      • 7.4.1 Key trends and opportunities

      • 7.4.2 Asia-Pacific Market size and forecast, by Type

      • 7.4.3 Asia-Pacific Market size and forecast, by Treatment

      • 7.4.4 Asia-Pacific Market size and forecast, by End User

      • 7.4.5 Asia-Pacific Market size and forecast, by country

        • 7.4.5.1 Japan
          • 7.4.5.1.1 Market size and forecast, by Type
          • 7.4.5.1.2 Market size and forecast, by Treatment
          • 7.4.5.1.3 Market size and forecast, by End User
        • 7.4.5.2 China
          • 7.4.5.2.1 Market size and forecast, by Type
          • 7.4.5.2.2 Market size and forecast, by Treatment
          • 7.4.5.2.3 Market size and forecast, by End User
        • 7.4.5.3 Australia
          • 7.4.5.3.1 Market size and forecast, by Type
          • 7.4.5.3.2 Market size and forecast, by Treatment
          • 7.4.5.3.3 Market size and forecast, by End User
        • 7.4.5.4 India
          • 7.4.5.4.1 Market size and forecast, by Type
          • 7.4.5.4.2 Market size and forecast, by Treatment
          • 7.4.5.4.3 Market size and forecast, by End User
        • 7.4.5.5 South Korea
          • 7.4.5.5.1 Market size and forecast, by Type
          • 7.4.5.5.2 Market size and forecast, by Treatment
          • 7.4.5.5.3 Market size and forecast, by End User
        • 7.4.5.6 Rest of Asia-Pacific
          • 7.4.5.6.1 Market size and forecast, by Type
          • 7.4.5.6.2 Market size and forecast, by Treatment
          • 7.4.5.6.3 Market size and forecast, by End User
    • 7.5 LAMEA

      • 7.5.1 Key trends and opportunities

      • 7.5.2 LAMEA Market size and forecast, by Type

      • 7.5.3 LAMEA Market size and forecast, by Treatment

      • 7.5.4 LAMEA Market size and forecast, by End User

      • 7.5.5 LAMEA Market size and forecast, by country

        • 7.5.5.1 Brazil
          • 7.5.5.1.1 Market size and forecast, by Type
          • 7.5.5.1.2 Market size and forecast, by Treatment
          • 7.5.5.1.3 Market size and forecast, by End User
        • 7.5.5.2 Saudi Arabia
          • 7.5.5.2.1 Market size and forecast, by Type
          • 7.5.5.2.2 Market size and forecast, by Treatment
          • 7.5.5.2.3 Market size and forecast, by End User
        • 7.5.5.3 South Africa
          • 7.5.5.3.1 Market size and forecast, by Type
          • 7.5.5.3.2 Market size and forecast, by Treatment
          • 7.5.5.3.3 Market size and forecast, by End User
        • 7.5.5.4 Rest of LAMEA
          • 7.5.5.4.1 Market size and forecast, by Type
          • 7.5.5.4.2 Market size and forecast, by Treatment
          • 7.5.5.4.3 Market size and forecast, by End User
  • CHAPTER 8: COMPANY LANDSCAPE

    • 8.1. Introduction

    • 8.2. Top winning strategies

    • 8.3. Product Mapping of Top 10 Player

    • 8.4. Competitive Dashboard

    • 8.5. Competitive Heatmap

    • 8.6. Key developments

  • CHAPTER 9: COMPANY PROFILES

    • 9.1 Stryker

      • 9.1.1 Company overview

      • 9.1.2 Company snapshot

      • 9.1.3 Operating business segments

      • 9.1.4 Product portfolio

      • 9.1.5 Business performance

      • 9.1.6 Key strategic moves and developments

    • 9.2 Grover Aesthetics

      • 9.2.1 Company overview

      • 9.2.2 Company snapshot

      • 9.2.3 Operating business segments

      • 9.2.4 Product portfolio

      • 9.2.5 Business performance

      • 9.2.6 Key strategic moves and developments

    • 9.3 Sunset Cosmetic Surgery

      • 9.3.1 Company overview

      • 9.3.2 Company snapshot

      • 9.3.3 Operating business segments

      • 9.3.4 Product portfolio

      • 9.3.5 Business performance

      • 9.3.6 Key strategic moves and developments

    • 9.4 Implantech

      • 9.4.1 Company overview

      • 9.4.2 Company snapshot

      • 9.4.3 Operating business segments

      • 9.4.4 Product portfolio

      • 9.4.5 Business performance

      • 9.4.6 Key strategic moves and developments

    • 9.5 GC Aesthetics

      • 9.5.1 Company overview

      • 9.5.2 Company snapshot

      • 9.5.3 Operating business segments

      • 9.5.4 Product portfolio

      • 9.5.5 Business performance

      • 9.5.6 Key strategic moves and developments

    • 9.6 Surgiform Technologies LLC

      • 9.6.1 Company overview

      • 9.6.2 Company snapshot

      • 9.6.3 Operating business segments

      • 9.6.4 Product portfolio

      • 9.6.5 Business performance

      • 9.6.6 Key strategic moves and developments

  • LIST OF TABLES

  • TABLE 1. GLOBAL NOSE RECONSTRUCTION MARKET, BY TYPE, 2020-2030,($MILLION)
    TABLE 2. NOSE RECONSTRUCTION MARKET REVENUE, FOR OPEN RHINOPLASTY, BY REGION , 2020-2030,($MILLION)
    TABLE 3. NOSE RECONSTRUCTION MARKET OPEN RHINOPLASTY BY COUNTRY, 2020-2030,($MILLION)
    TABLE 4. NOSE RECONSTRUCTION MARKET REVENUE, FOR CLOSED RHINOPLASTY, BY REGION , 2020-2030,($MILLION)
    TABLE 5. NOSE RECONSTRUCTION MARKET CLOSED RHINOPLASTY BY COUNTRY, 2020-2030,($MILLION)
    TABLE 6. GLOBAL NOSE RECONSTRUCTION MARKET, BY TREATMENT, 2020-2030,($MILLION)
    TABLE 7. NOSE RECONSTRUCTION MARKET REVENUE, FOR AUGMENTATION, BY REGION , 2020-2030,($MILLION)
    TABLE 8. NOSE RECONSTRUCTION MARKET AUGMENTATION BY COUNTRY, 2020-2030,($MILLION)
    TABLE 9. NOSE RECONSTRUCTION MARKET REVENUE, FOR REDUCTION, BY REGION , 2020-2030,($MILLION)
    TABLE 10. NOSE RECONSTRUCTION MARKET REDUCTION BY COUNTRY, 2020-2030,($MILLION)
    TABLE 11. NOSE RECONSTRUCTION MARKET REVENUE, FOR REVISION, BY REGION , 2020-2030,($MILLION)
    TABLE 12. NOSE RECONSTRUCTION MARKET REVISION BY COUNTRY, 2020-2030,($MILLION)
    TABLE 13. NOSE RECONSTRUCTION MARKET REVENUE, FOR FILLER, BY REGION , 2020-2030,($MILLION)
    TABLE 14. NOSE RECONSTRUCTION MARKET FILLER BY COUNTRY, 2020-2030,($MILLION)
    TABLE 15. NOSE RECONSTRUCTION MARKET REVENUE, FOR OTHERS, BY REGION , 2020-2030,($MILLION)
    TABLE 16. NOSE RECONSTRUCTION MARKET OTHERS BY COUNTRY, 2020-2030,($MILLION)
    TABLE 17. GLOBAL NOSE RECONSTRUCTION MARKET, BY END USER, 2020-2030,($MILLION)
    TABLE 18. NOSE RECONSTRUCTION MARKET REVENUE, FOR HOSPITALS, BY REGION , 2020-2030,($MILLION)
    TABLE 19. NOSE RECONSTRUCTION MARKET HOSPITALS BY COUNTRY, 2020-2030,($MILLION)
    TABLE 20. NOSE RECONSTRUCTION MARKET REVENUE, FOR PLASTIC SURGERY CLINICS, BY REGION , 2020-2030,($MILLION)
    TABLE 21. NOSE RECONSTRUCTION MARKET PLASTIC SURGERY CLINICS BY COUNTRY, 2020-2030,($MILLION)
    TABLE 22. NOSE RECONSTRUCTION MARKET REVENUE, FOR OTHERS, BY REGION , 2020-2030,($MILLION)
    TABLE 23. NOSE RECONSTRUCTION MARKET OTHERS BY COUNTRY, 2020-2030,($MILLION)
    TABLE 24. NOSE RECONSTRUCTION MARKET, BY REGION, 2020-2030,($MILLION)
    TABLE 25. NORTH AMERICA NOSE RECONSTRUCTION MARKET, BY TYPE, 2020-2030,($MILLION)
    TABLE 26. NORTH AMERICA NOSE RECONSTRUCTION MARKET, BY TREATMENT, 2020-2030,($MILLION)
    TABLE 27. NORTH AMERICA NOSE RECONSTRUCTION MARKET, BY END USER, 2020-2030,($MILLION)
    TABLE 28. NORTH AMERICA NOSE RECONSTRUCTION MARKET, BY COUNTRY, 2020-2030,($MILLION)
    TABLE 29. U.S. NOSE RECONSTRUCTION MARKET BY TYPE 2020-2030,($MILLION)
    TABLE 30. U.S. NOSE RECONSTRUCTION MARKET BY TREATMENT 2020-2030,($MILLION)
    TABLE 31. U.S. NOSE RECONSTRUCTION MARKET BY END USER 2020-2030,($MILLION)
    TABLE 32. CANADA NOSE RECONSTRUCTION MARKET BY TYPE 2020-2030,($MILLION)
    TABLE 33. CANADA NOSE RECONSTRUCTION MARKET BY TREATMENT 2020-2030,($MILLION)
    TABLE 34. CANADA NOSE RECONSTRUCTION MARKET BY END USER 2020-2030,($MILLION)
    TABLE 35. MEXICO NOSE RECONSTRUCTION MARKET BY TYPE 2020-2030,($MILLION)
    TABLE 36. MEXICO NOSE RECONSTRUCTION MARKET BY TREATMENT 2020-2030,($MILLION)
    TABLE 37. MEXICO NOSE RECONSTRUCTION MARKET BY END USER 2020-2030,($MILLION)
    TABLE 38. EUROPE NOSE RECONSTRUCTION MARKET, BY TYPE, 2020-2030,($MILLION)
    TABLE 39. EUROPE NOSE RECONSTRUCTION MARKET, BY TREATMENT, 2020-2030,($MILLION)
    TABLE 40. EUROPE NOSE RECONSTRUCTION MARKET, BY END USER, 2020-2030,($MILLION)
    TABLE 41. EUROPE NOSE RECONSTRUCTION MARKET, BY COUNTRY, 2020-2030,($MILLION)
    TABLE 42. GERMANY NOSE RECONSTRUCTION MARKET BY TYPE 2020-2030,($MILLION)
    TABLE 43. GERMANY NOSE RECONSTRUCTION MARKET BY TREATMENT 2020-2030,($MILLION)
    TABLE 44. GERMANY NOSE RECONSTRUCTION MARKET BY END USER 2020-2030,($MILLION)
    TABLE 45. FRANCE NOSE RECONSTRUCTION MARKET BY TYPE 2020-2030,($MILLION)
    TABLE 46. FRANCE NOSE RECONSTRUCTION MARKET BY TREATMENT 2020-2030,($MILLION)
    TABLE 47. FRANCE NOSE RECONSTRUCTION MARKET BY END USER 2020-2030,($MILLION)
    TABLE 48. UNITED KINGDOM NOSE RECONSTRUCTION MARKET BY TYPE 2020-2030,($MILLION)
    TABLE 49. UNITED KINGDOM NOSE RECONSTRUCTION MARKET BY TREATMENT 2020-2030,($MILLION)
    TABLE 50. UNITED KINGDOM NOSE RECONSTRUCTION MARKET BY END USER 2020-2030,($MILLION)
    TABLE 51. ITALY NOSE RECONSTRUCTION MARKET BY TYPE 2020-2030,($MILLION)
    TABLE 52. ITALY NOSE RECONSTRUCTION MARKET BY TREATMENT 2020-2030,($MILLION)
    TABLE 53. ITALY NOSE RECONSTRUCTION MARKET BY END USER 2020-2030,($MILLION)
    TABLE 54. SPAIN NOSE RECONSTRUCTION MARKET BY TYPE 2020-2030,($MILLION)
    TABLE 55. SPAIN NOSE RECONSTRUCTION MARKET BY TREATMENT 2020-2030,($MILLION)
    TABLE 56. SPAIN NOSE RECONSTRUCTION MARKET BY END USER 2020-2030,($MILLION)
    TABLE 57. REST OF EUROPE NOSE RECONSTRUCTION MARKET BY TYPE 2020-2030,($MILLION)
    TABLE 58. REST OF EUROPE NOSE RECONSTRUCTION MARKET BY TREATMENT 2020-2030,($MILLION)
    TABLE 59. REST OF EUROPE NOSE RECONSTRUCTION MARKET BY END USER 2020-2030,($MILLION)
    TABLE 60. ASIA-PACIFIC NOSE RECONSTRUCTION MARKET, BY TYPE, 2020-2030,($MILLION)
    TABLE 61. ASIA-PACIFIC NOSE RECONSTRUCTION MARKET, BY TREATMENT, 2020-2030,($MILLION)
    TABLE 62. ASIA-PACIFIC NOSE RECONSTRUCTION MARKET, BY END USER, 2020-2030,($MILLION)
    TABLE 63. ASIA-PACIFIC NOSE RECONSTRUCTION MARKET, BY COUNTRY, 2020-2030,($MILLION)
    TABLE 64. JAPAN NOSE RECONSTRUCTION MARKET BY TYPE 2020-2030,($MILLION)
    TABLE 65. JAPAN NOSE RECONSTRUCTION MARKET BY TREATMENT 2020-2030,($MILLION)
    TABLE 66. JAPAN NOSE RECONSTRUCTION MARKET BY END USER 2020-2030,($MILLION)
    TABLE 67. CHINA NOSE RECONSTRUCTION MARKET BY TYPE 2020-2030,($MILLION)
    TABLE 68. CHINA NOSE RECONSTRUCTION MARKET BY TREATMENT 2020-2030,($MILLION)
    TABLE 69. CHINA NOSE RECONSTRUCTION MARKET BY END USER 2020-2030,($MILLION)
    TABLE 70. AUSTRALIA NOSE RECONSTRUCTION MARKET BY TYPE 2020-2030,($MILLION)
    TABLE 71. AUSTRALIA NOSE RECONSTRUCTION MARKET BY TREATMENT 2020-2030,($MILLION)
    TABLE 72. AUSTRALIA NOSE RECONSTRUCTION MARKET BY END USER 2020-2030,($MILLION)
    TABLE 73. INDIA NOSE RECONSTRUCTION MARKET BY TYPE 2020-2030,($MILLION)
    TABLE 74. INDIA NOSE RECONSTRUCTION MARKET BY TREATMENT 2020-2030,($MILLION)
    TABLE 75. INDIA NOSE RECONSTRUCTION MARKET BY END USER 2020-2030,($MILLION)
    TABLE 76. SOUTH KOREA NOSE RECONSTRUCTION MARKET BY TYPE 2020-2030,($MILLION)
    TABLE 77. SOUTH KOREA NOSE RECONSTRUCTION MARKET BY TREATMENT 2020-2030,($MILLION)
    TABLE 78. SOUTH KOREA NOSE RECONSTRUCTION MARKET BY END USER 2020-2030,($MILLION)
    TABLE 79. REST OF ASIA-PACIFIC NOSE RECONSTRUCTION MARKET BY TYPE 2020-2030,($MILLION)
    TABLE 80. REST OF ASIA-PACIFIC NOSE RECONSTRUCTION MARKET BY TREATMENT 2020-2030,($MILLION)
    TABLE 81. REST OF ASIA-PACIFIC NOSE RECONSTRUCTION MARKET BY END USER 2020-2030,($MILLION)
    TABLE 82. LAMEA NOSE RECONSTRUCTION MARKET, BY TYPE, 2020-2030,($MILLION)
    TABLE 83. LAMEA NOSE RECONSTRUCTION MARKET, BY TREATMENT, 2020-2030,($MILLION)
    TABLE 84. LAMEA NOSE RECONSTRUCTION MARKET, BY END USER, 2020-2030,($MILLION)
    TABLE 85. LAMEA NOSE RECONSTRUCTION MARKET, BY COUNTRY, 2020-2030,($MILLION)
    TABLE 86. BRAZIL NOSE RECONSTRUCTION MARKET BY TYPE 2020-2030,($MILLION)
    TABLE 87. BRAZIL NOSE RECONSTRUCTION MARKET BY TREATMENT 2020-2030,($MILLION)
    TABLE 88. BRAZIL NOSE RECONSTRUCTION MARKET BY END USER 2020-2030,($MILLION)
    TABLE 89. SAUDI ARABIA NOSE RECONSTRUCTION MARKET BY TYPE 2020-2030,($MILLION)
    TABLE 90. SAUDI ARABIA NOSE RECONSTRUCTION MARKET BY TREATMENT 2020-2030,($MILLION)
    TABLE 91. SAUDI ARABIA NOSE RECONSTRUCTION MARKET BY END USER 2020-2030,($MILLION)
    TABLE 92. SOUTH AFRICA NOSE RECONSTRUCTION MARKET BY TYPE 2020-2030,($MILLION)
    TABLE 93. SOUTH AFRICA NOSE RECONSTRUCTION MARKET BY TREATMENT 2020-2030,($MILLION)
    TABLE 94. SOUTH AFRICA NOSE RECONSTRUCTION MARKET BY END USER 2020-2030,($MILLION)
    TABLE 95. REST OF LAMEA NOSE RECONSTRUCTION MARKET BY TYPE 2020-2030,($MILLION)
    TABLE 96. REST OF LAMEA NOSE RECONSTRUCTION MARKET BY TREATMENT 2020-2030,($MILLION)
    TABLE 97. REST OF LAMEA NOSE RECONSTRUCTION MARKET BY END USER 2020-2030,($MILLION)
    TABLE 98.STRYKER: COMPANY SNAPSHOT
    TABLE 99.STRYKER: OPERATING SEGMENTS
    TABLE 100.STRYKER: PRODUCT PORTFOLIO
    TABLE 101.STRYKER: NET SALES,
    TABLE 102.STRYKER: KEY STRATERGIES
    TABLE 103.GROVER AESTHETICS: COMPANY SNAPSHOT
    TABLE 104.GROVER AESTHETICS: OPERATING SEGMENTS
    TABLE 105.GROVER AESTHETICS: PRODUCT PORTFOLIO
    TABLE 106.GROVER AESTHETICS: NET SALES,
    TABLE 107.GROVER AESTHETICS: KEY STRATERGIES
    TABLE 108.SUNSET COSMETIC SURGERY: COMPANY SNAPSHOT
    TABLE 109.SUNSET COSMETIC SURGERY: OPERATING SEGMENTS
    TABLE 110.SUNSET COSMETIC SURGERY: PRODUCT PORTFOLIO
    TABLE 111.SUNSET COSMETIC SURGERY: NET SALES,
    TABLE 112.SUNSET COSMETIC SURGERY: KEY STRATERGIES
    TABLE 113.IMPLANTECH: COMPANY SNAPSHOT
    TABLE 114.IMPLANTECH: OPERATING SEGMENTS
    TABLE 115.IMPLANTECH: PRODUCT PORTFOLIO
    TABLE 116.IMPLANTECH: NET SALES,
    TABLE 117.IMPLANTECH: KEY STRATERGIES
    TABLE 118.GC AESTHETICS: COMPANY SNAPSHOT
    TABLE 119.GC AESTHETICS: OPERATING SEGMENTS
    TABLE 120.GC AESTHETICS: PRODUCT PORTFOLIO
    TABLE 121.GC AESTHETICS: NET SALES,
    TABLE 122.GC AESTHETICS: KEY STRATERGIES
    TABLE 123.SURGIFORM TECHNOLOGIES LLC: COMPANY SNAPSHOT
    TABLE 124.SURGIFORM TECHNOLOGIES LLC: OPERATING SEGMENTS
    TABLE 125.SURGIFORM TECHNOLOGIES LLC: PRODUCT PORTFOLIO
    TABLE 126.SURGIFORM TECHNOLOGIES LLC: NET SALES,
    TABLE 127.SURGIFORM TECHNOLOGIES LLC: KEY STRATERGIES
  • LIST OF FIGURES

  • FIGURE 1.NOSE RECONSTRUCTION MARKET SEGMENTATION
    FIGURE 2.NOSE RECONSTRUCTION MARKET,2020-2030
    FIGURE 3.NOSE RECONSTRUCTION MARKET,2020-2030
    FIGURE 4. TOP INVESTMENT POCKETS, BY REGION
    FIGURE 5.PORTER FIVE-1
    FIGURE 6.PORTER FIVE-2
    FIGURE 7.PORTER FIVE-3
    FIGURE 8.PORTER FIVE-4
    FIGURE 9.PORTER FIVE-5
    FIGURE 10.TOP PLAYER POSITIONING
    FIGURE 11.NOSE RECONSTRUCTION MARKET:DRIVERS, RESTRAINTS AND OPPORTUNITIES
    FIGURE 11.NOSE RECONSTRUCTION MARKET,BY TYPE,2020(%)
    FIGURE 12.COMPARATIVE SHARE ANALYSIS OF OPEN RHINOPLASTY NOSE RECONSTRUCTION MARKET,2020-2030(%)
    FIGURE 13.COMPARATIVE SHARE ANALYSIS OF CLOSED RHINOPLASTY NOSE RECONSTRUCTION MARKET,2020-2030(%)
    FIGURE 14.NOSE RECONSTRUCTION MARKET,BY TREATMENT,2020(%)
    FIGURE 15.COMPARATIVE SHARE ANALYSIS OF AUGMENTATION NOSE RECONSTRUCTION MARKET,2020-2030(%)
    FIGURE 16.COMPARATIVE SHARE ANALYSIS OF REDUCTION NOSE RECONSTRUCTION MARKET,2020-2030(%)
    FIGURE 17.COMPARATIVE SHARE ANALYSIS OF REVISION NOSE RECONSTRUCTION MARKET,2020-2030(%)
    FIGURE 18.COMPARATIVE SHARE ANALYSIS OF FILLER NOSE RECONSTRUCTION MARKET,2020-2030(%)
    FIGURE 19.COMPARATIVE SHARE ANALYSIS OF OTHERS NOSE RECONSTRUCTION MARKET,2020-2030(%)
    FIGURE 20.NOSE RECONSTRUCTION MARKET,BY END USER,2020(%)
    FIGURE 21.COMPARATIVE SHARE ANALYSIS OF HOSPITALS NOSE RECONSTRUCTION MARKET,2020-2030(%)
    FIGURE 22.COMPARATIVE SHARE ANALYSIS OF PLASTIC SURGERY CLINICS NOSE RECONSTRUCTION MARKET,2020-2030(%)
    FIGURE 23.COMPARATIVE SHARE ANALYSIS OF OTHERS NOSE RECONSTRUCTION MARKET,2020-2030(%)
    FIGURE 24.NOSE RECONSTRUCTION MARKET BY REGION,2020
    FIGURE 25.U.S. NOSE RECONSTRUCTION MARKET,2020-2030($MILLION)
    FIGURE 26.CANADA NOSE RECONSTRUCTION MARKET,2020-2030($MILLION)
    FIGURE 27.MEXICO NOSE RECONSTRUCTION MARKET,2020-2030($MILLION)
    FIGURE 28.GERMANY NOSE RECONSTRUCTION MARKET,2020-2030($MILLION)
    FIGURE 29.FRANCE NOSE RECONSTRUCTION MARKET,2020-2030($MILLION)
    FIGURE 30.UNITED KINGDOM NOSE RECONSTRUCTION MARKET,2020-2030($MILLION)
    FIGURE 31.ITALY NOSE RECONSTRUCTION MARKET,2020-2030($MILLION)
    FIGURE 32.SPAIN NOSE RECONSTRUCTION MARKET,2020-2030($MILLION)
    FIGURE 33.REST OF EUROPE NOSE RECONSTRUCTION MARKET,2020-2030($MILLION)
    FIGURE 34.JAPAN NOSE RECONSTRUCTION MARKET,2020-2030($MILLION)
    FIGURE 35.CHINA NOSE RECONSTRUCTION MARKET,2020-2030($MILLION)
    FIGURE 36.AUSTRALIA NOSE RECONSTRUCTION MARKET,2020-2030($MILLION)
    FIGURE 37.INDIA NOSE RECONSTRUCTION MARKET,2020-2030($MILLION)
    FIGURE 38.SOUTH KOREA NOSE RECONSTRUCTION MARKET,2020-2030($MILLION)
    FIGURE 39.REST OF ASIA-PACIFIC NOSE RECONSTRUCTION MARKET,2020-2030($MILLION)
    FIGURE 40.BRAZIL NOSE RECONSTRUCTION MARKET,2020-2030($MILLION)
    FIGURE 41.SAUDI ARABIA NOSE RECONSTRUCTION MARKET,2020-2030($MILLION)
    FIGURE 42.SOUTH AFRICA NOSE RECONSTRUCTION MARKET,2020-2030($MILLION)
    FIGURE 43.REST OF LAMEA NOSE RECONSTRUCTION MARKET,2020-2030($MILLION)
    FIGURE 44. TOP WINNING STRATEGIES, BY YEAR
    FIGURE 45. TOP WINNING STRATEGIES, BY DEVELOPMENT
    FIGURE 46. TOP WINNING STRATEGIES, BY COMPANY
    FIGURE 47.PRODUCT MAPPING OF TOP 10 PLAYERS
    FIGURE 48.COMPETITIVE DASHBOARD
    FIGURE 49.COMPETITIVE HEATMAP OF TOP 10 KEY PLAYERS
    FIGURE 50.STRYKER.: NET SALES ,($MILLION)
    FIGURE 51.GROVER AESTHETICS.: NET SALES ,($MILLION)
    FIGURE 52.SUNSET COSMETIC SURGERY.: NET SALES ,($MILLION)
    FIGURE 53.IMPLANTECH.: NET SALES ,($MILLION)
    FIGURE 54.GC AESTHETICS.: NET SALES ,($MILLION)
    FIGURE 55.SURGIFORM TECHNOLOGIES LLC.: NET SALES ,($MILLION)


According to the insights of CXOs, surge in usage of cosmetic procedures, surge in cases of accident across the world, and advancements in new device launches are all attributed propel growth of the nose reconstruction market.

CXOs further added greater consumer awareness and demand for preventive healthcare services, escalating demand for healthcare services from overall population, and new advancements are predicted to broaden nose reconstruction devices clinical Treatments and increase the number of product approvals. Furthermore, increase in incidences by birth disorders contributes toward growth of the market.

The market gains interest of healthcare companies owing to focus on preventive facilities provided to patients who are undergoing nose plastic surgery. This leads to increase in utilization for nose reconstruction devices; thus is a great opportunity that further propels growth of the market.

North America is expected to witness highest growth, in terms of revenue owing to rise in geriatric population, presence of key players, and advancements in healthcare investments. Asia-Pacific was the second largest contributor to the market in 2020, and is expected to register fastest CAGR during the forecast period owing to increase in number of cosmetic surgeries and unmet needs for advanced surgical clamps devices. However, high cost associated with nose reconstruction devices restrain the market growth during the forecast period.

PURCHASE OPTIONS

Call or Email us

U.S.-Canada Toll-free: +1-800-792-5285
Int'l : +1-503-894-6022
Europe : +44-845-528-1300
Email : help@alliedmarketresearch.com
 
FREQUENTLY ASKED QUESTIONS?

A. The upcoming trends in the Nose Reconstruction Market are increase in the number of road accidents and injuries; a rise in government initiatives for the development of the pharmaceutical and medical device industry and an increase in the number of product approvals for nose reconstruction

A. The total market value of the Nose Reconstruction Market is $6,085.92 Million in 2030

A. The market value of the Nose Reconstruction Market in 2020 was $3,306.28 million in 2020

A. No, there is no value chain analysis provided in the Nose Reconstruction Market report

Looking for Customization?

 Customization Request

Have a Question?

 Speak with Analyst

Any Confusion?

 Inquire Before Buying

Have a glance of the Report

  Request Sample
RELATED TAGS

Purchase Full Report of
Nose Reconstruction Market

Start reading instantly.
This Report and over 66,944+ more Reports, Available with Avenue Library. T&C*.

  • Online Only
  • $3,456
  • Online cloud access only
  • Restricted print, copy, paste & download
  • Read only
  • Free industry update
    (Within 180 days)
  • Free report update in next update cycle
    (Mar 2023 - Mar 2024)
  • Data Pack
  • $3,840
  • Restricted to one authorized user
  • One print only
  • Available in
    Excel
  • Free industry update
    (Within 180 days)
  •   Free report update in next update cycle
    (Mar 2023 - Mar 2024)
  • Single User
  • $5,769
  • Restricted to one authorized user
  • One print only
  • Available in
    PDF
  • Free industry update
    (Within 180 days)
  •   Free report update in next update cycle
    (Mar 2023 - Mar 2024)
  • Five Users
  • $6,450
  • Limited to five authorized users
  • Print upto five copies
  • Available in
    PDF
  • Free industry update
    (Within 180 days)
  •   Free report update in next update cycle
    (Mar 2023 - Mar 2024)
  • Enterprise
    License/PDF

  • $10,995
  • Unlimited
    within
    company/enterprise
  • Available in Excel & PDF
  • Free industry update
    (Within 180 days)
  •   Free report update in next update cycle
    (Mar 2023 - Mar 2024)
  • Library
    Membership

  • $999 $ 1,175
    Per User/ Per month/ Billed annually
  • Published Content
    E-access
  • Company Profiles
    E-access
  • Newly Added Content Access
  • 10 PDF
    Downloads
  • 5 Excel Data
    Pack Downloads
  • 250 Company Profiles PDF Downloads
  • Buy Now

*Taxes/Fees, if applicable will be added during checkout. All prices in USD

RELATED REPORTS
 

Why Allied Market Research?


Infallible Methodology

To ensure high-level data integrity, accurate analysis, and impeccable forecasts

Analyst Support

For complete satisfaction

Customization

On-demand customization of scope of the report to exactly meet your needs

TARGETED MARKET VIEW

Targeted market view to provide pertinent information and save time of readers

Get fresh content delivered

Get insights on topics that are crucial for your business. Stay abreast of your interest areas.

Get Industry Data Alerts

Why Allied Market Research?

Infallible Methodology

To ensure high-level data integrity, accurate analysis, and impeccable forecasts

Analyst Support

For complete satisfaction

Customization

On-demand customization of scope of the report to exactly meet your needs

TARGETED MARKET VIEW

Targeted market view to provide pertinent information and save time of readers