0
2022
Nuclear Bombs And Missiles Market

Nuclear Bombs and Missiles Market

By Type (Aircraft Bomber and Land based missiles, ICBM, SLBM, Other), By Range (<1000km, 1000km-5000km, >5000km), By Status (Active, Reserve And Retired): Global Opportunity Analysis and Industry Forecast, 2021-2030

Report Code: A10717
Mar 2022 | Pages: 230
Tables: 103
Charts: 48
  • Formats*:

  • pdf

    Single User License, Five User
    License & Enterprise User License

  • xls

    Data Pack Excel License

  • ppt

    It comes with the additional cost
    of $2500.00 contact sales.


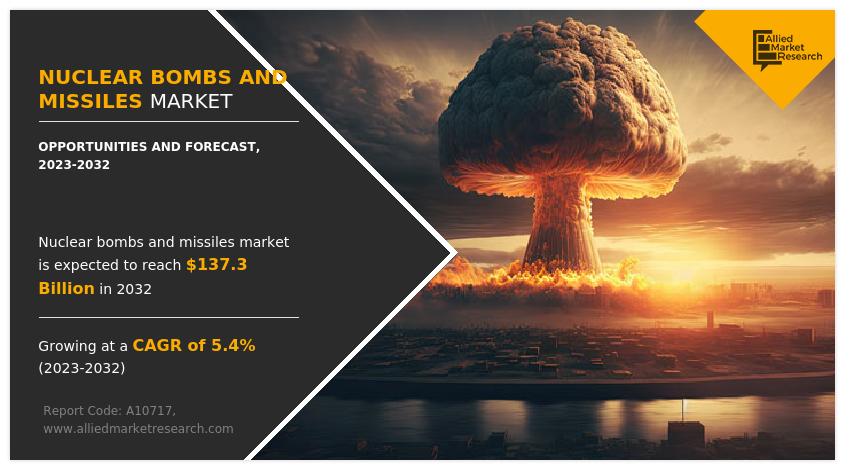
The global nuclear missile and bomb market size was valued at $72.64 billion in 2020 and is projected to reach $126.34 billion in 2030, registering a CAGR of 5.4%.   

Nuclear Bombs and Missiles Market

Nuclear bombs and missiles can be referred to as the weapons of mass destruction that use nuclear fission, fusion, or a combination of both to release huge amounts of heat and energy. These weapons use fissile materials as raw materials. The effects of nuclear weapons are not limited to the initial blast. These weapons release a huge amount of nuclear radiation such as gamma radiation, neutron radiation, and ionizing radiation for a long timeframe after detonation. The first nuclear weapon was tested by the U.S. in 1946, followed by other nations. Soviet Union tested the its first weapon in 1949, the UK in 1952, France in 1960, China in 1964, India in 1974, Pakistan in 1998, and North Korea in 2006. Such destructive ability of these weapons has allowed several nations and international organizations to put a ban on the design, development, and testing of nuclear bombs and missiles. Active efforts are being made to dismantle the existing nuclear arsenal by major countries. Despite such efforts, a notable budget is allocated towards the acquisition, maintenance, and renewal of these weapons, backed by defense think tanks and military leaders.

A group and countries as well as continents have formed treaties and comities to eliminate their existing nuclear arsenal. For instance, Antarctica banned nuclear tests in 1959, followed by a treaty banning to test nuclear weapon in our space or underwater in 1963. Regions such as South Pacific, South Africa, Southeast Asia and Africa have taken rigorous actions to limit proliferation of nuclear weapons, followed by countries such as Ukraine and Belarus that became nuclear free by 1996.

Nuclear Bombs and Missiles Market
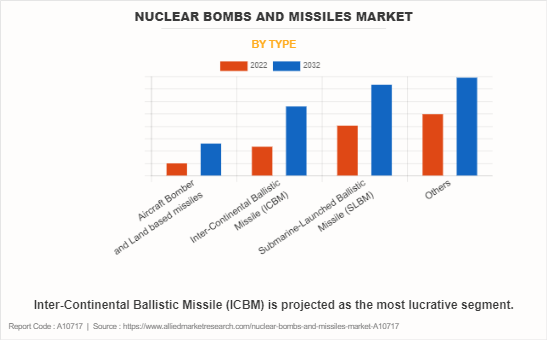
By Type

Your browser does not support the canvas element.

Aircraft bombers is projected as the most lucrative segment

Get more information on this report : Request Sample Pages

Factors such as rise in geopolitical conflicts and increase in defense budget allocation toward nuclear expenditure, are expected to support the nuclear missile and bomb market growth. For instance, the U.S. allocated 5.7% of total defense budget toward nuclear weapon spending in 2021, which is expected to rise 8.0% of total defense spending in 2030. The nuclear arms acquisition race by superpowers such as the U.S. and Russia to accelerate business opportunism within the coming years. In 2021, the U.S. and Russia had 5,550 and 6,255 nuclear warheads and are expected to reach 6,380 and 6,734 by 2030 respectively. The expenditure by major companies such as Lockheed Martin, BAE Systems, Airbus, and Boeing, toward research, development, management, conducting exhibitions and seminars to conduct importance and feasibility of nuclear weapons will encourage nations to increase their budget allocation. In 2021, the lobbyists engaged in conducting seminars, exhibitions, and business meetings along with think tanks responsible for future planning and management received around $120 million from corporate bodies and defense organizations, supporting business potential over the coming years.

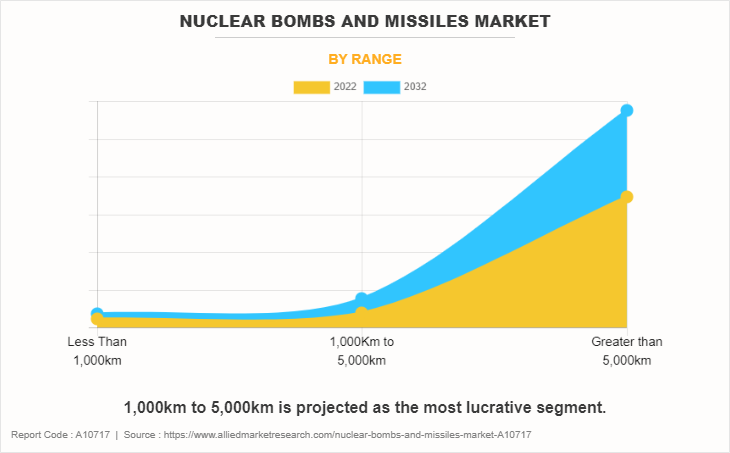
The global nuclear missile and bomb market is segmented on the basis of type, range, status and region. By type, the market is divided into aircraft bombers and land base missiles, inter-continental ballistic missiles (ICBM), submarine-launched ballistic missile (SLBM), and others. The others segment includes reserve and retired nuclear warheads within the type segment. By range, the market is segmented into less than 1,000km, 1,000Km to 5,000km and greater than 5,000km. The status segment is bifurcated into active and reserve and retired. By region, the market is analyzed across North America, Europe, Asia-Pacific, and LAMEA. Companies have adopted collaboration, long term agreements, joint ventures and association with think tanks such as Atlantic council, Brookings Institution, and Carnegie Endowment for International Peace as their key development strategies in the nuclear missile and bomb market.

The prominent players operating in the nuclear missile and bomb market are Airbus, Ariane group Sas, Bae Systems, Brahmos Aerospace, Lockheed Martin Corporation, MBDA, Northrop Grumman Corporation, Rafael Advanced Defense Systems Ltd, Raytheon Technologies Corporation, and The Boeing Company.

Nuclear Bombs and Missiles Market
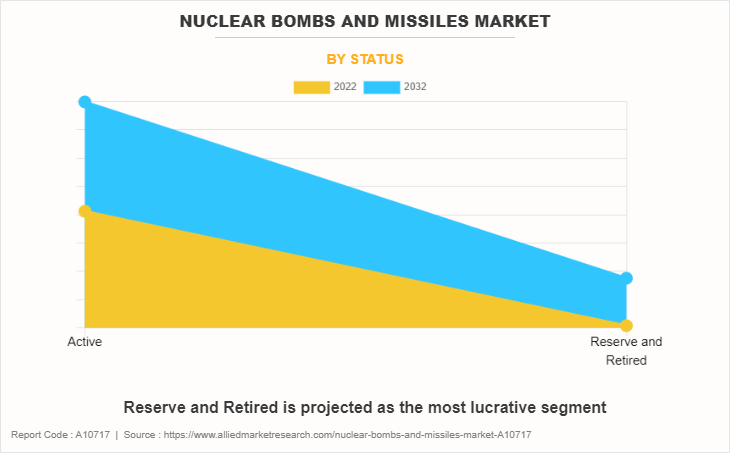
By Status

Your browser does not support the canvas element.

Reserve and retired is projected as the most lucrative segment

Get more information on this report : Request Sample Pages

Increase in cross border conflicts

The rise in border disputes among neighboring nations, plans for territorial expansion and efforts to establish strategic and political dominance at global level remain primary factors that support the nuclear missile and bomb market. The ongoing dispute between Ukraine and Russia as of March 2022 is expected to notably impact the business dynamics in coming years. Other nations such as India and Pakistan, are entering a race to increase their nuclear arsenal to ensure political dominance.

The group of nations such as NATO are actively participating in discussion and initiatives taken within the nuclear weaponries segment and looking to update their existing forces. The UK has one of the strongest naval forces and relies on their nuclear submarine launch ballistic missiles. The country has done notable investment on developing Dreadnought-class, capable of carrying nuclear weapons. The submarine is expected to be in service by 2030. On similar lines, China is expected to develop 200 launch silos that are capable of launching nuclear warheads to close proximity regions.

Rise in nuclear testing and technology transfers

The rise in testing and experimentation of nuclear weapon testing and ratification of non-nuclear proliferation treaties will positively impact the business dynamics of nuclear missile and bomb market. Though the Treaty on the Prohibition of nuclear weapons (TPNW) entered into force as of January 2021, eight nuclear armed countries including the UK, Russia, France, China, India, Pakistan, Israel and North Korea have not supported the amendment whereas the U.S. has nor declined neither accepted the treaty. The policy prohibits development, testing, production, possession or sale of nuclear weapons.

New policies drafted by individual nations allowing them to develop, use and test nuclear weapons will have a major impact on the market in coming years. For instance, in 2020, France stated that the country will use its nuclear capabilities under extreme situation. Only one-time unique warning will be given to the opposition, barring which the country will be liable to use nuclear weapons by any means possible. Prolonged operations and life extension of nuclear reactors to be fully operational and supporting nuclear R&D activities are augmenting the nuclear missile and bomb market. For instance, an ageing nuclear reactor of Israel was scheduled to stop its operation in 2003; but has been postponed to 2023 and the Israel Atomic Energy Commission is exploring ways to prolong its operational life till 2040.

Collaboration with government, thin tanks and lobbyist

Collaboration with government bodies, research institutes, and think tanks will remain primary strategic initiatives practiced by companies across the globe to secure their market share. The increasing conflict between Russia and Ukraine as of March 2022, ratification of nonnuclear proliferation and testing treaties by several nations in past years, and formulation of nuclear strike policies will define the business opportunities in the coming years.

Collaboration of several companies into a single entity to engage in arms research, development and manufacturing activity is a command strategic initiative practiced by companies operating at the global level. For instance, MBDA is a consortium of three companies, Airbus (37.5%), BAE System (37.5%) and Leonardo (25%).

Nuclear Bombs and Missiles Market
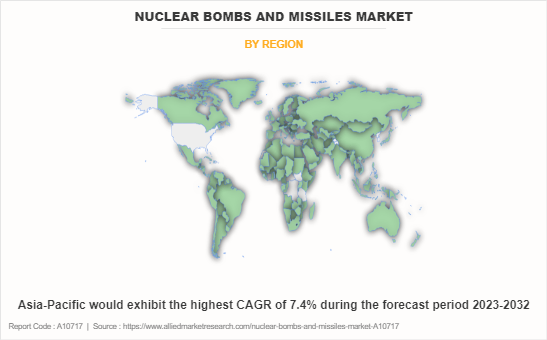
By Region

2030
North America 
Europe
Asia-Pacific
LAMEA

Asia-Pacific would exhibit the highest CAGR of 6.5% during 2021-2030

Get more information on this report : Request Sample Pages

High initial investment and maintenance cost

A notable investment is required to test, develop, modernize and maintain nuclear arsenal. Such huge investments have a notable implication on defense budgets and economy of region. The rising cost of fissile material and costing to develop and test nuclear weapons is a major market challenge. To counter such huge costs and overheads, nations possessing nuclear weapons increase their budget allocation. For instance, the U.S. allocated 5.7% of its total nuclear budget toward nuclear expenditure, and plans to raise their allocation to 8.0% of total defense budget by 2030. Apart from the budget allocation toward nuclear spending, each test utilizes tremendous amount of financial as well as non-financial resources. Each test is expected to be worth $45 million to $95 million.

KEY BENEFITS FOR STAKEHOLDERS

  • This study presents the analytical depiction of the global nuclear missile and bomb market analysis along with the current trends and future estimations to depict imminent investment pockets.
  • The overall nuclear missile and bomb market opportunity is determined by understanding profitable trends to gain a stronger foothold.
  • The report presents information related to the key drivers, restraints, and opportunities of the global nuclear missile and bomb market with a detailed impact analysis.
  • The current nuclear missile and bomb market is quantitatively analyzed from 2020 to 2030 to benchmark financial competency.
  • Porter’s five forces analysis illustrates the potency of the buyers and suppliers in the industry.


Nuclear Bombs and Missiles Market Report Highlights

Aspects Details
Market Size By 2030 USD 126.3 billion
Growth Rate CAGR of 5.4%
Forecast period 2020 - 2030
Report Pages 230
By Type
  • ICBM
  • SLBM
  • Other
  • Aircraft Bomber and Land based missiles
By Range
  • <1000km
  • 1000km-5000km
  • >5000km
By Status
  • Active
  • Reserve And Retired
By Region
  • North America  (U.S.)
  • Europe  (Russia, France, U.K.)
  • Asia-Pacific  (China, India, Pakistan, North Korea)
  • LAMEA  (Israel)
Key Market Players BrahMos Aerospace, BAE Systems, ArianeGroup SAS, Rafael Advanced Defense Systems Ltd., Northrop Grumman Corporation, Raytheon Technologies Corporation, MBDA, Lockheed Martin Corporation, Airbus, The Boeing Company

Analyst Review

The rise in dependency on nuclear arsenal to ensure global dominancy and safeguarding themselves in cross-border conflicts will support business opportunities. The nuclear bombs and missiles market in developed countries are projected to capture the highest value over the coming years whereas countries in Asia-Pacific such as China, India, Pakistan, and North Korea, are expected to witness the highest CAGR. China is expected to increase its nuclear arsenal by almost 60% by 2030 as compared to 2021. The non-nuclear proliferation treaties will play a major role in defining the market dynamics over the coming years. Collaboration with government bodies, research institutes, and think tanks will remain primary strategic initiatives practiced by companies across the globe to secure their market share. The increasing conflict between Russia and Ukraine as of March 2022, ratification of nonnuclear proliferation and testing treaties by several nations in past years, and formulation of nuclear strike policies will define the business opportunities in the coming years.

Nuclear bombs and missiles manufacturing companies such as Airbus, Boeing, Lockheed Martin, MBDA, and Northrop Grumman in association with think tanks including Atlantic Council, Brookings Institution, Carnegie Endowment for International Peace, Center for New American Security (CNAS), and Center for Strategic and International Studies (CSIS) among other will play a major role in the evolution of nuclear missiles and bombs market. These companies in collaboration with think tanks and government bodies analyze the need for nuclear weapons. The guidance provided by such think tanks stating the importance of nuclear warheads to ensure self-interest and border safety has supported business opportunities. Long-term modification contracts as well as introduction of new weaponry by the UK, and China among others are having a notable global impact.

The Submarine-Launched Ballistic Missile (SLBM) segment within type is poised to have higher growth potential as compared to aircraft bombers/land-based missiles or Inter-Continental Ballistic Missile (ICBM). Retirement of old SLBM and naval vessels capable of launching nuclear warheads and increasing investment toward the development of new naval silos and vehicles are expected to support the segment growth. The aircraft carriers and bombers will also witness notable growth rate over the coming years. Easy to maintain and launch with comparatively less blast radius as compared to SLBM and ICBM will augment business opportunities within the segment. The growth rate of aircraft bombers/land missiles will be proportional to the rise in cross-border conflicts as they are used for short-range operations whereas the ICBM and SLBM will be used for long-range operations.

Among the analyzed regions, Asia-Pacific is the highest revenue contributor followed by Europe, North America, and LAMEA. Based on forecast, Europe is expected to maintain the lead during the forecast period owing to an increased CAGR as compared to other regions.

 
  • CHAPTER 1: INTRODUCTION

    • 1.1. Report description

    • 1.2. Key market segments

    • 1.3. Key benefits to the stakeholders

    • 1.4. Research Methodology

      • 1.4.1. Primary research

      • 1.4.2. Secondary research

      • 1.4.3. Analyst tools and models

  • CHAPTER 2: EXECUTIVE SUMMARY

    • 2.1. CXO Perspective

  • CHAPTER 3: MARKET OVERVIEW

    • 3.1. Market definition and scope

    • 3.2. Key findings

      • 3.2.1. Top impacting factors

      • 3.2.2. Top investment pockets

    • 3.3. Porter’s five forces analysis

      • 3.3.1. Low bargaining power of suppliers

      • 3.3.2. Low threat of new entrants

      • 3.3.3. Low threat of substitutes

      • 3.3.4. Low intensity of rivalry

      • 3.3.5. Low bargaining power of buyers

    • 3.4. Market dynamics

      • 3.4.1. Drivers

        • 3.4.1.1. Increase in investments by government bodies and corporate giants
        • 3.4.1.2. Increase in cross border conflicts
        • 3.4.1.3. Rise in nuclear testing and technology transfers
      • 3.4.2. Restraints

        • 3.4.2.1. International Treaties and Consortiums discouraging nuclear testing
        • 3.4.2.2. High initial investment and maintenance cost
      • 3.4.3. Opportunities

        • 3.4.3.1. Collaboration with government, thin tanks and lobbyist
  • CHAPTER 4: NUCLEAR BOMBS AND MISSILES MARKET, BY TYPE

    • 4.1. Overview

      • 4.1.1. Market size and forecast

    • 4.2. Aircraft Bomber and Land based missiles

      • 4.2.1. Key market trends, growth factors and opportunities

      • 4.2.2. Market size and forecast, by region

      • 4.2.3. Market share analysis by country

    • 4.3. ICBM

      • 4.3.1. Key market trends, growth factors and opportunities

      • 4.3.2. Market size and forecast, by region

      • 4.3.3. Market share analysis by country

    • 4.4. SLBM

      • 4.4.1. Key market trends, growth factors and opportunities

      • 4.4.2. Market size and forecast, by region

      • 4.4.3. Market share analysis by country

    • 4.5. Other

      • 4.5.1. Key market trends, growth factors and opportunities

      • 4.5.2. Market size and forecast, by region

      • 4.5.3. Market share analysis by country

  • CHAPTER 5: NUCLEAR BOMBS AND MISSILES MARKET, BY RANGE

    • 5.1. Overview

      • 5.1.1. Market size and forecast

    • 5.2. <1000km

      • 5.2.1. Key market trends, growth factors and opportunities

      • 5.2.2. Market size and forecast, by region

      • 5.2.3. Market share analysis by country

    • 5.3. 1000km-5000km

      • 5.3.1. Key market trends, growth factors and opportunities

      • 5.3.2. Market size and forecast, by region

      • 5.3.3. Market share analysis by country

    • 5.4. >5000km

      • 5.4.1. Key market trends, growth factors and opportunities

      • 5.4.2. Market size and forecast, by region

      • 5.4.3. Market share analysis by country

  • CHAPTER 6: NUCLEAR BOMBS AND MISSILES MARKET, BY STATUS

    • 6.1. Overview

      • 6.1.1. Market size and forecast

    • 6.2. Active

      • 6.2.1. Key market trends, growth factors and opportunities

      • 6.2.2. Market size and forecast, by region

      • 6.2.3. Market share analysis by country

    • 6.3. Reserve And Retired

      • 6.3.1. Key market trends, growth factors and opportunities

      • 6.3.2. Market size and forecast, by region

      • 6.3.3. Market share analysis by country

  • CHAPTER 7: NUCLEAR BOMBS AND MISSILES MARKET, BY REGION

    • 7.1. Overview

      • 7.1.1. Market size and forecast By Region

    • 7.2. North America

      • 7.2.1. Key market trends, growth factors and opportunities

      • 7.2.2. Market size and forecast, by Type

      • 7.2.3. Market size and forecast, by Range

      • 7.2.4. Market size and forecast, by Status

      • 7.2.5. Market size and forecast, by country

        • 7.2.5.1. U.S.
          • 7.2.5.1.1. Market size and forecast, by Type
          • 7.2.5.1.2. Market size and forecast, by Range
          • 7.2.5.1.3. Market size and forecast, by Status
    • 7.3. Europe

      • 7.3.1. Key market trends, growth factors and opportunities

      • 7.3.2. Market size and forecast, by Type

      • 7.3.3. Market size and forecast, by Range

      • 7.3.4. Market size and forecast, by Status

      • 7.3.5. Market size and forecast, by country

        • 7.3.5.1. Russia
          • 7.3.5.1.1. Market size and forecast, by Type
          • 7.3.5.1.2. Market size and forecast, by Range
          • 7.3.5.1.3. Market size and forecast, by Status
        • 7.3.5.2. France
          • 7.3.5.2.1. Market size and forecast, by Type
          • 7.3.5.2.2. Market size and forecast, by Range
          • 7.3.5.2.3. Market size and forecast, by Status
        • 7.3.5.3. U.K.
          • 7.3.5.3.1. Market size and forecast, by Type
          • 7.3.5.3.2. Market size and forecast, by Range
          • 7.3.5.3.3. Market size and forecast, by Status
    • 7.4. Asia-Pacific

      • 7.4.1. Key market trends, growth factors and opportunities

      • 7.4.2. Market size and forecast, by Type

      • 7.4.3. Market size and forecast, by Range

      • 7.4.4. Market size and forecast, by Status

      • 7.4.5. Market size and forecast, by country

        • 7.4.5.1. China
          • 7.4.5.1.1. Market size and forecast, by Type
          • 7.4.5.1.2. Market size and forecast, by Range
          • 7.4.5.1.3. Market size and forecast, by Status
        • 7.4.5.2. India
          • 7.4.5.2.1. Market size and forecast, by Type
          • 7.4.5.2.2. Market size and forecast, by Range
          • 7.4.5.2.3. Market size and forecast, by Status
        • 7.4.5.3. Pakistan
          • 7.4.5.3.1. Market size and forecast, by Type
          • 7.4.5.3.2. Market size and forecast, by Range
          • 7.4.5.3.3. Market size and forecast, by Status
        • 7.4.5.4. North Korea
          • 7.4.5.4.1. Market size and forecast, by Type
          • 7.4.5.4.2. Market size and forecast, by Range
          • 7.4.5.4.3. Market size and forecast, by Status
    • 7.5. LAMEA

      • 7.5.1. Key market trends, growth factors and opportunities

      • 7.5.2. Market size and forecast, by Type

      • 7.5.3. Market size and forecast, by Range

      • 7.5.4. Market size and forecast, by Status

      • 7.5.5. Market size and forecast, by country

        • 7.5.5.1. Israel
          • 7.5.5.1.1. Market size and forecast, by Type
          • 7.5.5.1.2. Market size and forecast, by Range
          • 7.5.5.1.3. Market size and forecast, by Status
  • CHAPTER 8: COMPETITIVE LANDSCAPE

    • 8.1. Introduction

    • 8.2. Top winning strategies

    • 8.3. Product Mapping of Top 10 Player

    • 8.4. Competitive Dashboard

    • 8.5. Competitive Heatmap

    • 8.6. Top player positioning, 2020

  • CHAPTER 9: COMPANY PROFILES

    • 9.1. Airbus

      • 9.1.1. Company overview

      • 9.1.2. Key Executives

      • 9.1.3. Company snapshot

      • 9.1.4. Operating business segments

      • 9.1.5. Product portfolio

      • 9.1.6. Business performance

    • 9.2. ArianeGroup SAS

      • 9.2.1. Company overview

      • 9.2.2. Key Executives

      • 9.2.3. Company snapshot

      • 9.2.4. Operating business segments

      • 9.2.5. Product portfolio

      • 9.2.6. Key strategic moves and developments

    • 9.3. BAE Systems

      • 9.3.1. Company overview

      • 9.3.2. Key Executives

      • 9.3.3. Company snapshot

      • 9.3.4. Operating business segments

      • 9.3.5. Product portfolio

      • 9.3.6. Business performance

      • 9.3.7. Key strategic moves and developments

    • 9.4. BrahMos Aerospace

      • 9.4.1. Company overview

      • 9.4.2. Key Executives

      • 9.4.3. Company snapshot

      • 9.4.4. Operating business segments

      • 9.4.5. Product portfolio

      • 9.4.6. Key strategic moves and developments

    • 9.5. Lockheed Martin Corporation

      • 9.5.1. Company overview

      • 9.5.2. Key Executives

      • 9.5.3. Company snapshot

      • 9.5.4. Operating business segments

      • 9.5.5. Product portfolio

      • 9.5.6. Business performance

    • 9.6. MBDA

      • 9.6.1. Company overview

      • 9.6.2. Key Executives

      • 9.6.3. Company snapshot

      • 9.6.4. Operating business segments

      • 9.6.5. Product portfolio

      • 9.6.6. Key strategic moves and developments

    • 9.7. Northrop Grumman Corporation

      • 9.7.1. Company overview

      • 9.7.2. Key Executives

      • 9.7.3. Company snapshot

      • 9.7.4. Operating business segments

      • 9.7.5. Product portfolio

      • 9.7.6. Business performance

      • 9.7.7. Key strategic moves and developments

    • 9.8. Rafael Advanced Defense Systems Ltd.

      • 9.8.1. Company overview

      • 9.8.2. Key Executives

      • 9.8.3. Company snapshot

      • 9.8.4. Operating business segments

      • 9.8.5. Product portfolio

    • 9.9. Raytheon Technologies Corporation

      • 9.9.1. Company overview

      • 9.9.2. Key Executives

      • 9.9.3. Company snapshot

      • 9.9.4. Operating business segments

      • 9.9.5. Product portfolio

      • 9.9.6. Business performance

      • 9.9.7. Key strategic moves and developments

    • 9.10. The Boeing Company

      • 9.10.1. Company overview

      • 9.10.2. Key Executives

      • 9.10.3. Company snapshot

      • 9.10.4. Operating business segments

      • 9.10.5. Product portfolio

      • 9.10.6. Business performance

      • 9.10.7. Key strategic moves and developments

  • LIST OF TABLES

  • TABLE 01. GLOBAL NUCLEAR BOMBS AND MISSILES MARKET, BY TYPE, 2020-2030 ($BILLION)
    TABLE 02. NUCLEAR BOMBS AND MISSILES MARKET FOR AIRCRAFT BOMBER AND LAND BASED MISSILES, BY REGION, 2020-2030 ($BILLION)
    TABLE 03. NUCLEAR BOMBS AND MISSILES MARKET FOR ICBM, BY REGION, 2020-2030 ($BILLION)
    TABLE 04. NUCLEAR BOMBS AND MISSILES MARKET FOR SLBM, BY REGION, 2020-2030 ($BILLION)
    TABLE 05. NUCLEAR BOMBS AND MISSILES MARKET FOR OTHER, BY REGION, 2020-2030 ($BILLION)
    TABLE 06. GLOBAL NUCLEAR BOMBS AND MISSILES MARKET, BY RANGE, 2020-2030 ($BILLION)
    TABLE 07. NUCLEAR BOMBS AND MISSILES MARKET FOR <1000KM, BY REGION, 2020-2030 ($BILLION)
    TABLE 08. NUCLEAR BOMBS AND MISSILES MARKET FOR 1000KM-5000KM, BY REGION, 2020-2030 ($BILLION)
    TABLE 09. NUCLEAR BOMBS AND MISSILES MARKET FOR >5000KM, BY REGION, 2020-2030 ($BILLION)
    TABLE 10. GLOBAL NUCLEAR BOMBS AND MISSILES MARKET, BY STATUS, 2020-2030 ($BILLION)
    TABLE 11. NUCLEAR BOMBS AND MISSILES MARKET FOR ACTIVE, BY REGION, 2020-2030 ($BILLION)
    TABLE 12. NUCLEAR BOMBS AND MISSILES MARKET FOR RESERVE AND RETIRED, BY REGION, 2020-2030 ($BILLION)
    TABLE 13. NUCLEAR BOMBS AND MISSILES MARKET, BY REGION, 2020-2030 ($BILLION)
    TABLE 14. NORTH AMERICA NUCLEAR BOMBS AND MISSILES MARKET, BY TYPE, 2020-2030 ($BILLION)
    TABLE 15. NORTH AMERICA NUCLEAR BOMBS AND MISSILES MARKET, BY RANGE, 2020-2030 ($BILLION)
    TABLE 16. NORTH AMERICA NUCLEAR BOMBS AND MISSILES MARKET, BY STATUS, 2020-2030 ($BILLION)
    TABLE 17. NORTH AMERICA NUCLEAR BOMBS AND MISSILES MARKET, BY COUNTRY, 2020-2030 ($BILLION)
    TABLE 18. U.S. NUCLEAR BOMBS AND MISSILES MARKET, BY TYPE, 2020-2030 ($BILLION)
    TABLE 19. U.S. NUCLEAR BOMBS AND MISSILES MARKET, BY RANGE, 2020-2030 ($BILLION)
    TABLE 20. U.S. NUCLEAR BOMBS AND MISSILES MARKET, BY STATUS, 2020-2030 ($BILLION)
    TABLE 21. EUROPE NUCLEAR BOMBS AND MISSILES MARKET, BY TYPE, 2020-2030 ($BILLION)
    TABLE 22. EUROPE NUCLEAR BOMBS AND MISSILES MARKET, BY RANGE, 2020-2030 ($BILLION)
    TABLE 23. EUROPE NUCLEAR BOMBS AND MISSILES MARKET, BY STATUS, 2020-2030 ($BILLION)
    TABLE 24. EUROPE NUCLEAR BOMBS AND MISSILES MARKET, BY COUNTRY, 2020-2030 ($BILLION)
    TABLE 25. RUSSIA NUCLEAR BOMBS AND MISSILES MARKET, BY TYPE, 2020-2030 ($BILLION)
    TABLE 26. RUSSIA NUCLEAR BOMBS AND MISSILES MARKET, BY RANGE, 2020-2030 ($BILLION)
    TABLE 27. RUSSIA NUCLEAR BOMBS AND MISSILES MARKET, BY STATUS, 2020-2030 ($BILLION)
    TABLE 28. FRANCE NUCLEAR BOMBS AND MISSILES MARKET, BY TYPE, 2020-2030 ($BILLION)
    TABLE 29. FRANCE NUCLEAR BOMBS AND MISSILES MARKET, BY RANGE, 2020-2030 ($BILLION)
    TABLE 30. FRANCE NUCLEAR BOMBS AND MISSILES MARKET, BY STATUS, 2020-2030 ($BILLION)
    TABLE 31. U.K. NUCLEAR BOMBS AND MISSILES MARKET, BY TYPE, 2020-2030 ($BILLION)
    TABLE 32. U.K. NUCLEAR BOMBS AND MISSILES MARKET, BY RANGE, 2020-2030 ($BILLION)
    TABLE 33. U.K. NUCLEAR BOMBS AND MISSILES MARKET, BY STATUS, 2020-2030 ($BILLION)
    TABLE 34. ASIA-PACIFIC NUCLEAR BOMBS AND MISSILES MARKET, BY TYPE, 2020-2030 ($BILLION)
    TABLE 35. ASIA-PACIFIC NUCLEAR BOMBS AND MISSILES MARKET, BY RANGE, 2020-2030 ($BILLION)
    TABLE 36. ASIA-PACIFIC NUCLEAR BOMBS AND MISSILES MARKET, BY STATUS, 2020-2030 ($BILLION)
    TABLE 37. ASIA-PACIFIC NUCLEAR BOMBS AND MISSILES MARKET, BY COUNTRY, 2020-2030 ($BILLION)
    TABLE 38. CHINA NUCLEAR BOMBS AND MISSILES MARKET, BY TYPE, 2020-2030 ($BILLION)
    TABLE 39. CHINA NUCLEAR BOMBS AND MISSILES MARKET, BY RANGE, 2020-2030 ($BILLION)
    TABLE 40. CHINA NUCLEAR BOMBS AND MISSILES MARKET, BY STATUS, 2020-2030 ($BILLION)
    TABLE 41. INDIA NUCLEAR BOMBS AND MISSILES MARKET, BY TYPE, 2020-2030 ($BILLION)
    TABLE 42. INDIA NUCLEAR BOMBS AND MISSILES MARKET, BY RANGE, 2020-2030 ($BILLION)
    TABLE 43. INDIA NUCLEAR BOMBS AND MISSILES MARKET, BY STATUS, 2020-2030 ($BILLION)
    TABLE 44. PAKISTAN NUCLEAR BOMBS AND MISSILES MARKET, BY TYPE, 2020-2030 ($BILLION)
    TABLE 45. PAKISTAN NUCLEAR BOMBS AND MISSILES MARKET, BY RANGE, 2020-2030 ($BILLION)
    TABLE 46. PAKISTAN NUCLEAR BOMBS AND MISSILES MARKET, BY STATUS, 2020-2030 ($BILLION)
    TABLE 47. NORTH KOREA NUCLEAR BOMBS AND MISSILES MARKET, BY TYPE, 2020-2030 ($BILLION)
    TABLE 48. NORTH KOREA NUCLEAR BOMBS AND MISSILES MARKET, BY RANGE, 2020-2030 ($BILLION)
    TABLE 49. NORTH KOREA NUCLEAR BOMBS AND MISSILES MARKET, BY STATUS, 2020-2030 ($BILLION)
    TABLE 50. LAMEA NUCLEAR BOMBS AND MISSILES MARKET, BY TYPE, 2020-2030 ($BILLION)
    TABLE 51. LAMEA NUCLEAR BOMBS AND MISSILES MARKET, BY RANGE, 2020-2030 ($BILLION)
    TABLE 52. LAMEA NUCLEAR BOMBS AND MISSILES MARKET, BY STATUS, 2020-2030 ($BILLION)
    TABLE 53. LAMEA NUCLEAR BOMBS AND MISSILES MARKET, BY COUNTRY, 2020-2030 ($BILLION)
    TABLE 54. ISRAEL NUCLEAR BOMBS AND MISSILES MARKET, BY TYPE, 2020-2030 ($BILLION)
    TABLE 55. ISRAEL NUCLEAR BOMBS AND MISSILES MARKET, BY RANGE, 2020-2030 ($BILLION)
    TABLE 56. ISRAEL NUCLEAR BOMBS AND MISSILES MARKET, BY STATUS, 2020-2030 ($BILLION)
    TABLE 57. AIRBUS: KEY EXECUTIVES
    TABLE 58. AIRBUS: COMPANY SNAPSHOT
    TABLE 59. AIRBUS: PRODUCT SEGMENTS
    TABLE 60. AIRBUS: PRODUCT PORTFOLIO
    TABLE 61. ARIANEGROUP SAS: KEY EXECUTIVES
    TABLE 62. ARIANEGROUP SAS: COMPANY SNAPSHOT
    TABLE 63. ARIANEGROUP SAS: PRODUCT SEGMENTS
    TABLE 64. ARIANEGROUP SAS: PRODUCT PORTFOLIO
    TABLE 65. ARIANEGROUP SAS: KEY STRATERGIES
    TABLE 66. BAE SYSTEMS: KEY EXECUTIVES
    TABLE 67. BAE SYSTEMS: COMPANY SNAPSHOT
    TABLE 68. BAE SYSTEMS: PRODUCT SEGMENTS
    TABLE 69. BAE SYSTEMS: PRODUCT PORTFOLIO
    TABLE 70. BAE SYSTEMS: KEY STRATERGIES
    TABLE 71. BRAHMOS AEROSPACE: KEY EXECUTIVES
    TABLE 72. BRAHMOS AEROSPACE: COMPANY SNAPSHOT
    TABLE 73. BRAHMOS AEROSPACE: PRODUCT SEGMENTS
    TABLE 74. BRAHMOS AEROSPACE: PRODUCT PORTFOLIO
    TABLE 75. BRAHMOS AEROSPACE: KEY STRATERGIES
    TABLE 76. LOCKHEED MARTIN CORPORATION: KEY EXECUTIVES
    TABLE 77. LOCKHEED MARTIN CORPORATION: COMPANY SNAPSHOT
    TABLE 78. LOCKHEED MARTIN CORPORATION: PRODUCT SEGMENTS
    TABLE 79. LOCKHEED MARTIN CORPORATION: PRODUCT PORTFOLIO
    TABLE 80. MBDA: KEY EXECUTIVES
    TABLE 81. MBDA: COMPANY SNAPSHOT
    TABLE 82. MBDA: PRODUCT SEGMENTS
    TABLE 83. MBDA: PRODUCT PORTFOLIO
    TABLE 84. MBDA: KEY STRATERGIES
    TABLE 85. NORTHROP GRUMMAN CORPORATION: KEY EXECUTIVES
    TABLE 86. NORTHROP GRUMMAN CORPORATION: COMPANY SNAPSHOT
    TABLE 87. NORTHROP GRUMMAN CORPORATION: PRODUCT SEGMENTS
    TABLE 88. NORTHROP GRUMMAN CORPORATION: PRODUCT PORTFOLIO
    TABLE 89. NORTHROP GRUMMAN CORPORATION: KEY STRATERGIES
    TABLE 90. RAFAEL ADVANCED DEFENSE SYSTEMS LTD.: KEY EXECUTIVES
    TABLE 91. RAFAEL ADVANCED DEFENSE SYSTEMS LTD.: COMPANY SNAPSHOT
    TABLE 92. RAFAEL ADVANCED DEFENSE SYSTEMS LTD.: PRODUCT SEGMENTS
    TABLE 93. RAFAEL ADVANCED DEFENSE SYSTEMS LTD.: PRODUCT PORTFOLIO
    TABLE 94. RAYTHEON TECHNOLOGIES CORPORATION: KEY EXECUTIVES
    TABLE 95. RAYTHEON TECHNOLOGIES CORPORATION: COMPANY SNAPSHOT
    TABLE 96. RAYTHEON TECHNOLOGIES CORPORATION: PRODUCT SEGMENTS
    TABLE 97. RAYTHEON TECHNOLOGIES CORPORATION: PRODUCT PORTFOLIO
    TABLE 98. RAYTHEON TECHNOLOGIES CORPORATION: KEY STRATERGIES
    TABLE 99. THE BOEING COMPANY: KEY EXECUTIVES
    TABLE 100. THE BOEING COMPANY: COMPANY SNAPSHOT
    TABLE 101. THE BOEING COMPANY: PRODUCT SEGMENTS
    TABLE 102. THE BOEING COMPANY: PRODUCT PORTFOLIO
    TABLE 103. THE BOEING COMPANY: KEY STRATERGIES
  • LIST OF FIGURES

  • FIGURE 1.NUCLEAR BOMBS AND MISSILES MARKET SEGMENTATION
    FIGURE 2.NUCLEAR BOMBS AND MISSILES MARKET,2020-2030
    FIGURE 3.NUCLEAR BOMBS AND MISSILES MARKET,2020-2030
    FIGURE 4. TOP INVESTMENT POCKETS, BY REGION
    FIGURE 5.PORTER FIVE-1
    FIGURE 6.PORTER FIVE-2
    FIGURE 7.PORTER FIVE-3
    FIGURE 8.PORTER FIVE-4
    FIGURE 9.PORTER FIVE-5
    FIGURE 10.TOP PLAYER POSITIONING
    FIGURE 11.NUCLEAR BOMBS AND MISSILES MARKET:DRIVERS, RESTRAINTS AND OPPORTUNITIES
    FIGURE 11.NUCLEAR BOMBS AND MISSILES MARKET,BY TYPE,2020(%)
    FIGURE 12.COMPARATIVE SHARE ANALYSIS OF AIRCRAFT BOMBERS NUCLEAR BOMBS AND MISSILES MARKET,2020-2030(%)
    FIGURE 13.COMPARATIVE SHARE ANALYSIS OF ICBM NUCLEAR BOMBS AND MISSILES MARKET,2020-2030(%)
    FIGURE 14.COMPARATIVE SHARE ANALYSIS OF SLBM NUCLEAR BOMBS AND MISSILES MARKET,2020-2030(%)
    FIGURE 15.COMPARATIVE SHARE ANALYSIS OF OTHER NUCLEAR BOMBS AND MISSILES MARKET,2020-2030(%)
    FIGURE 16.NUCLEAR BOMBS AND MISSILES MARKET,BY RANGE,2020(%)
    FIGURE 17.COMPARATIVE SHARE ANALYSIS OF AAA NUCLEAR BOMBS AND MISSILES MARKET,2020-2030(%)
    FIGURE 18.COMPARATIVE SHARE ANALYSIS OF BBB NUCLEAR BOMBS AND MISSILES MARKET,2020-2030(%)
    FIGURE 19.COMPARATIVE SHARE ANALYSIS OF CCC NUCLEAR BOMBS AND MISSILES MARKET,2020-2030(%)
    FIGURE 20.NUCLEAR BOMBS AND MISSILES MARKET,BY STATUS,2020(%)
    FIGURE 21.COMPARATIVE SHARE ANALYSIS OF ACTIVE NUCLEAR BOMBS AND MISSILES MARKET,2020-2030(%)
    FIGURE 22.COMPARATIVE SHARE ANALYSIS OF RESERVE AND RETIRED NUCLEAR BOMBS AND MISSILES MARKET,2020-2030(%)
    FIGURE 23.NUCLEAR BOMBS AND MISSILES MARKET BY REGION,2020
    FIGURE 24.U.S. NUCLEAR BOMBS AND MISSILES MARKET,2020-2030($BILLION)
    FIGURE 25.RUSSIA NUCLEAR BOMBS AND MISSILES MARKET,2020-2030($BILLION)
    FIGURE 26.FRANCE NUCLEAR BOMBS AND MISSILES MARKET,2020-2030($BILLION)
    FIGURE 27.U.K. NUCLEAR BOMBS AND MISSILES MARKET,2020-2030($BILLION)
    FIGURE 28.CHINA NUCLEAR BOMBS AND MISSILES MARKET,2020-2030($BILLION)
    FIGURE 29.INDIA NUCLEAR BOMBS AND MISSILES MARKET,2020-2030($BILLION)
    FIGURE 30.PAKISTAN NUCLEAR BOMBS AND MISSILES MARKET,2020-2030($BILLION)
    FIGURE 31.NORTH KOREA NUCLEAR BOMBS AND MISSILES MARKET,2020-2030($BILLION)
    FIGURE 32.ISRAEL NUCLEAR BOMBS AND MISSILES MARKET,2020-2030($BILLION)
    FIGURE 33. TOP WINNING STRATEGIES, BY YEAR
    FIGURE 34. TOP WINNING STRATEGIES, BY DEVELOPMENT
    FIGURE 35. TOP WINNING STRATEGIES, BY COMPANY
    FIGURE 36.PRODUCT MAPPING OF TOP 10 PLAYERS
    FIGURE 37.COMPETITIVE DASHBOARD
    FIGURE 38.COMPETITIVE HEATMAP OF TOP 10 KEY PLAYERS
    FIGURE 39.AIRBUS GROUP.: NET SALES ,($BILLION)
    FIGURE 40.ARIANEGROUP SAS.: NET SALES ,($BILLION)
    FIGURE 41.BAE SYSTEMS.: NET SALES ,($BILLION)
    FIGURE 42.BRAHMOS AEROSPACE.: NET SALES ,($BILLION)
    FIGURE 43.LOCKHEED MARTIN CORPORATION.: NET SALES ,($BILLION)
    FIGURE 44.MBDA.: NET SALES ,($BILLION)
    FIGURE 45.NORTHROP GRUMMAN CORPORATION.: NET SALES ,($BILLION)
    FIGURE 46.RAFAEL ADVANCED DEFENSE SYSTEMS LTD..: NET SALES ,($BILLION)
    FIGURE 47.RAYTHEON TECHNOLOGIES CORPORATION.: NET SALES ,($BILLION)
    FIGURE 48.THE BOEING COMPANY.: NET SALES ,($BILLION)


PURCHASE OPTIONS

Call or Email us

U.S.-Canada Toll-free: +1-800-792-5285
Int'l : +1-503-894-6022
Europe : +44-845-528-1300
Email : help@alliedmarketresearch.com
 
FREQUENTLY ASKED QUESTIONS?

A. The nuclear bombs and missiles market is valued at $72.64 billion in 2020. The market is expected to growth at a CAGR of 5.4% within the forecast timeframe.

A. The nations having nuclear capabilities are increasing their budget allocation towards modification and integration of nuclear weapons. The NEWSTART policy between the U.S. and Russia will have a notable market impact.

A. The sample for nuclear bombs and missiles market report can be obtained on demand from the website. Also, the 24*7 chat support and direct call services are provided to procure the sample report

A. The increase in geopolitical conflicts between nations across the globe and the arms acquisition race has increased the importance of nuclear arsenal among nations.

A. The company profiles of the top market players in nuclear bombs and missiles industry can be obtained from the company profile section mentioned in the report. This section includes an analysis of the top ten player’s operating in the nuclear bombs and missiles industry as well as their last three-year revenue, segmental revenue, product offerings, key strategies adopted, and geographical revenue generated.

Looking for Customization?

 Customization Request

Have a Question?

 Speak with Analyst

Any Confusion?

 Inquire Before Buying

Have a glance of the Report

  Request Sample
RELATED TAGS

Purchase Full Report of
Nuclear Bombs And Missiles Market

Start reading instantly.
This Report and over 66,905+ more Reports, Available with Avenue Library. T&C*.

  • Online Only
  • $3,570
  • Online cloud access only
  • Restricted print, copy, paste & download
  • Read only
  • Free industry update
    (Within 180 days)
  • Free report update in next update cycle
    (Mar 2023 - Mar 2024)
  • Data Pack
  • $3,840
  • Restricted to one authorized user
  • One print only
  • Available in
    Excel
  • Free industry update
    (Within 180 days)
  •   Free report update in next update cycle
    (Mar 2023 - Mar 2024)
  • Single User
  • $5,730
  • Restricted to one authorized user
  • One print only
  • Available in
    PDF
  • Free industry update
    (Within 180 days)
  •   Free report update in next update cycle
    (Mar 2023 - Mar 2024)
  • Five Users
  • $6,450
  • Limited to five authorized users
  • Print upto five copies
  • Available in
    PDF
  • Free industry update
    (Within 180 days)
  •   Free report update in next update cycle
    (Mar 2023 - Mar 2024)
  • Enterprise
    License/PDF

  • $9,600
  • Unlimited
    within
    company/enterprise
  • Available in Excel & PDF
  • Free industry update
    (Within 180 days)
  •   Free report update in next update cycle
    (Mar 2023 - Mar 2024)
  • Library
    Membership

  • $999 $ 1,175
    Per User/ Per month/ Billed annually
  • Published Content
    E-access
  • Company Profiles
    E-access
  • Newly Added Content Access
  • 10 PDF
    Downloads
  • 5 Excel Data
    Pack Downloads
  • 250 Company Profiles PDF Downloads
  • Buy Now

*Taxes/Fees, if applicable will be added during checkout. All prices in USD

RELATED REPORTS
 

Why Allied Market Research?


Infallible Methodology

To ensure high-level data integrity, accurate analysis, and impeccable forecasts

Analyst Support

For complete satisfaction

Customization

On-demand customization of scope of the report to exactly meet your needs

TARGETED MARKET VIEW

Targeted market view to provide pertinent information and save time of readers

Get fresh content delivered

Get insights on topics that are crucial for your business. Stay abreast of your interest areas.

Get Industry Data Alerts

Why Allied Market Research?

Infallible Methodology

To ensure high-level data integrity, accurate analysis, and impeccable forecasts

Analyst Support

For complete satisfaction

Customization

On-demand customization of scope of the report to exactly meet your needs

TARGETED MARKET VIEW

Targeted market view to provide pertinent information and save time of readers