0
2022
Nuclear Power Plant And Equipment Market

Nuclear Power Plant and Equipment Market

by Reactor Type (Pressurized Water Reactor (PWR), Pressurized Heavy Water Reactor (PHWR), Boiling Water Reactor (BWR), Light Water Graphite Reactor (LWGR), Gas Cooled Reactor (GCR), and Others) and Equipment Type (Island Equipment and Auxiliary Equipment): Global Opportunity Analysis and Industry Forecast 2021-2030

✷  Report Code: A00822
Feb 2022 | Pages: 225
Tables: 95
Charts: 42
  • Formats*:

  • pdf

    Single User License, Five User
    License & Enterprise User License

  • xls

    Data Pack Excel License

  • ppt

    It comes with the additional cost
    of $2500.00 contact sales.


COVID-19

Pandemic disrupted the entire world and affected many industries.

Get detailed COVID-19 impact analysis on the Nuclear Power Plant And Equipment Market

Request Now !

Nuclear Power Plant And Equipment Market Outlook - 2030

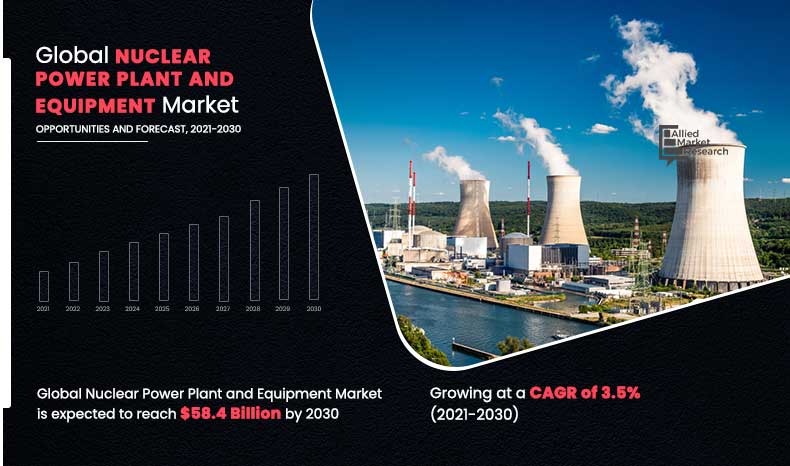
The global nuclear power plant and equipment market size was valued at $41.1 billion in 2020, and is projected to reach $58.4 billion by 2030, growing at a CAGR of 3.5% from 2021 to 2030. A nuclear power plant is a thermal power station in which a nuclear reactor is the heat source. Furthermore, it is a thermal power plant, where heat is generated and used to drive a steam turbine, which is connected to a generator that generates electricity.

The COVID-19 pandemic has impacted nuclear power and the nuclear fuel industry on both the supply and demand side.

Nuclear energy is derived from the energy produced during a fission reaction induced by the splitting of an atom. The technique was derived from the nuclear weapon created during World War II. Nuclear fission in a nuclear power plant is carried out in a controlled environment, which generates tremendous amount of heat. This heat is then converted into steam by the heat exchanger used to produce electricity. There are various types of reactors used in a nuclear power plant.

Nuclear-Power-Plant-and-Equipment,-2021-2030

The global nuclear power plant and equipment market is driven by increase in energy demand and generation of clean electricity across the globe. As the demand for energy continues to increase, countries look for clean and efficient ways such as nuclear power to produce energy. Furthermore, technological advancements in nuclear power equipment have fueled the growth of the market. However, difficulty in management of nuclear waste that includes radioactive waste has restrained the market growth. Increase in reliability on nuclear energy by the countries in Asia-Pacific is expected to create lucrative opportunities for the growth of the market in future.

The nuclear power plant and equipment market is segmented on the basis of reactor type, equipment type, and region. On the basis of reactor type, the market is categorized into pressurized water reactor (PWR), pressurized heavy water reactor (PHWR), boiling water reactor (BWR), light water graphite reactor (LWGR), gas-cooled reactor (GCR), and others. On the basis of equipment type, it is divided into island equipment and auxiliary equipment. On the basis of region,  it is analyzed across North America, Europe, Asia-Pacific, and LAMEA.

The global nuclear power plant and equipment market analysis covers in-depth information about the major industry participants. The key players operating and profiled in the report include BWX Technologies, INC, Dongfang Electric Co., Ltd., Doosan Corporation, General Electric, Korea Electric Power Corporation, Larsen & Toubro Limited, Mitsubishi Heavy Industries, LTD., Alstom SA, the State Atomic Energy Corporation (ROSATOM), and Toshiba International Corporation.

The other players in the value chain (not included in the report) include Hitachi, Ltd., Babcock and Wilcox, Orano, and Korea Hydro & Nuclear Energy.

Nuclear Power Plant and Equipment Market
By Reactor Type

Your browser does not support the canvas element.

PWR ( Pressurized Water Reactor ) segment is projected as the most lucrative segment.

Get more information on this report : Request Sample Pages

Global Nuclear Power Plant And Equipment Market, By Reactor Type

The pressurized Water Reactor (PWR) reactor type is projected to be the most lucrative segment, owing to its stability at high temperatures. This makes it easy to operate the reactor from the stability standpoint

Nuclear Power Plant and Equipment Market
By Equipment Type

Your browser does not support the canvas element.

Auxiliary Equipment is projected as the most lucrative segment.

Get more information on this report : Request Sample Pages

Global Nuclear Power Plant And Equipment Market, By Equipment Type

The auxiliary equipment segment is estimated to grow at the highest CAGR 4.0% during the forecast period, since it plays a crucial role in operation safety and has numerous applications in a nuclear power plant.

Nuclear Power Plant and Equipment Market
By Region

2030
Asia-pacific 
North America
Europe
LAMEA

Asia-Pacific holds a dominant position in 2020 and would continue to maintain the lead over the forecast period.

Get more information on this report : Request Sample Pages

Global Nuclear Power Plant And Equipment Market, By Region

By region, Asia-Pacific dominated the global nuclear power plant and equipment market in 2020, and is projected to remain the fastest-growing segment during the forecast period. This is attributed to rapid increase in the demand for power in this region. Furthermore, power shortages and chronic smog in countries such as India and China, are attributed to the growth of clean energy such as nuclear energy.

Key Benefits For Stakeholders

  • The report provides an in-depth analysis of the global nuclear power plant and equipment market trends along with the current and future market forecast.
  • This report highlights the key drivers, opportunities, and restraints of the market along with the impact analyses during the forecast period.
  • Porter’s Five Forces analysis helps analyze the potential of the buyers & suppliers and the competitive scenario of the global nuclear power plant and equipment market for strategy building.
  • A comprehensive global nuclear power plant and equipment market analysis covers factors that drive and restrain the market growth.
  • The qualitative data in this report aims on market dynamics, trends, and developments.

Impact Of Covid-19 On The Global Nuclear Power Plant And Equipment Market

  • COVID-19 has impacted various industries due to shut down of different industrial operations and disrupted supply chain. Maximum companies halted their operation due to less workforce. However, there is a gradual decline in the equipment segment of the nuclear power plant and equipment market due to the impact of COVID-19. 
  • The electric industry accounted for significant share in terms of consumption during global lockdown. Electricity consumption has grown due to large decreases in services and industry, which have only been partially compensated by rise in household use, which has raised demand for nuclear power plants and equipment.
  • The COVID-19 pandemic has impacted nuclear power and the nuclear fuel industry on both the supply and demand side. In the short term, the impact is greatest on the supply side for uranium, as various mines and nuclear fuel cycle facilities are suspending operations due to health concerns. As a result, the uranium price increased 33% from its lowest point registered in mid-March this 2020.
  • Demand for nuclear power is directly proportional to the demand for nuclear fuel which was highly impacted due to COVID-19, but not nearly to the same extent as oil due to the nature of underlying demand for electricity versus oil. The Energy Information Administration estimates that the demand for electricity in the U.S. was declined by 3% in 2020. In France, where nearly 75% of electrical generation comes from nuclear energy, electricity demand is projected to decline by 15-20% in 2020. As a result, France’s EDF has already downgraded its nuclear power generation outlook for both 2020 and 2021 by 8-12% less than its pre-pandemic forecasts.
  • Reactor construction schedules have also been impacted due to COVID-19 issues. China, which accounts for much of the world’s new reactor build, some new reactor projects have been halted temporarily. Reactor construction in the U.S., France, the United Arab Emirates, Bangladesh, and the UK have also been negatively impacted. These delays are a function of the reduction of staff at the construction sites and disruptions in the supply chain.
  • The delay in reactor construction along with the drop in electricity demand negatively affected the nuclear power output in the 2021, but the extent of the impact is uncertain. In China, which has the largest new reactor construction program, economic growth has suffered as a result of the COVID-19 pandemic (due to developments on both of the sides of China) and thus the need for new electricity generation has slowed. 
  • The nuclear industry has been taking special measures to cope with the global pandemic, and no country has reported the enforced shutdown of a nuclear power reactor due to the effects of COVID-19 on the workforce or supply chains. This is according to reports from operators and regulators received through the IAEA’s COVID-19 Operational Experience Network (OPEX) and International Reporting System for Operating Experience (IRS). However, the abovementioned point shows that there is a sluggish decline in the nuclear power plant and equipment market.

Nuclear Power Plant and Equipment Market Report Highlights

Aspects Details
By Reactor Type
  • Pressurized Water Reactor (PWR)
  • Pressurized Heavy Water Reactor (PHWR)
  • Boiling Water Reactor (BWR)
  • Light Water Graphite Reactor (LWGR)
  • Gas-Cooled Reactor (GCR)
  • Others
By Equipment Type
  • Island Equipment
  • Auxiliary Equipment
By Region
  • North America  (U.S., Canada, Mexico)
  • Europe  (France, Germany, Russia, Spain, U.K., Rest of Europe)
  • Asia-Pacific  (Japan, China, India, South Korea, Rest of Asia-Pacific)
  • LAMEA  (Brazil, U.A.E., South Africa, Rest of LAMEA)
 

CHAPTER 1:INTRODUCTION

1.1.Report description
1.2.Key benefits for stakeholders
1.3.Key market segments
1.4.Research methodology

1.4.1.Secondary research
1.4.2.Primary research
1.4.3.Analyst tools and models

CHAPTER 2:EXECUTIVE SUMMARY

2.1.Key findings of the study
2.2.CXO perspective

CHAPTER 3:MARKET OVERVIEW

3.1.Market definition and scope
3.2.Key findings

3.2.1.Top investment pockets
3.2.2.Top winning strategies

3.3.Porter’s five forces analysis
3.4.Market dynamics

3.4.1.Drivers

3.4.1.1.Ascend in energy demand and prerequisite of cleaner generation of power
3.4.1.2.   Innovative headways in nuclear power equipment

3.4.2.Restraint

3.4.2.1.Trouble in the administration of atomic waste of nuclear waste (Radioactive waste) 

3.4.3.Opportunities

3.4.3.1.Rise in demand from APAC

3.5.Top player positioning, 202
3.5. Impact OF COVID-19 on GLOBAL NUCLEAR POWER PLANT AND EQUIPMENT MARKET

CHAPTER 4:GLOBAL NUCLEAR POWER PLANT AND EQUIPMENT MARKET, BY REACTOR TYPE

4.1.Overview

4.1.1.Market size and forecast

4.2.PWR (Pressurized water reactor) 

4.2.1.Key market trends, growth factors, and opportunities
4.2.2.Market size and forecast
4.2.3.Market analysis, by country

4.3.PHWR (Pressurized heavy water reactor) 

4.3.1.Key market trends, growth factors, and opportunities
4.3.2.Market size and forecast

4.4.Boiling water reactor (BWR) 

4.4.1.Key market trends, growth factors, and opportunities
4.4.2.Market size and forecast
4.4.3.Market analysis, by country

4.5.Light water graphite reactor (LWGR) 

4.5.1.Key market trends, growth factors, and opportunities
4.5.2.Market size and forecast
4.5.3.Market analysis, by country

4.6.Gas cooled reactor (GCR) 

4.6.1.Key market trends, growth factors, and opportunities
4.6.2.Market size and forecast
4.6.3.Market analysis, by country

4.7.Others

4.7.1.Key market trends, growth factors, and opportunities
4.7.2.Market size and forecast
4.7.3.Market analysis, by country

CHAPTER 5:GLOBAL NUCLEAR POWER PLANT AND EQUIPMENT MARKET, BY EQUIPMENT TYPE

5.1.Overview

5.1.1.Market size and forecast

5.2.Island equipment

5.2.1.Market size and forecast
5.2.2.Market analysis, by country

5.3.Auxiliary equipment

5.3.1.Market size and forecast
5.3.2.Market analysis, by country
 

CHAPTER 6:NUCLEAR POWER PLANT AND EQUIPMENT MARKET, BY REGION

6.1.Overview

6.1.1.Market size and forecast

6.2.North America

6.2.1.Key market trends, growth factors, and opportunities
6.2.2.Market size and forecast by reactor type
6.2.3.Market size and forecast by equipment type
6.2.4.Market size and forecast by country88

6.2.4.1.U.S. 

6.2.4.1.1.Market size and forecast by reactor type
6.2.4.1.2.Market size and forecast by equipment type

6.2.4.2.Canada

6.2.4.2.1.Market size and forecast by reactor type
6.2.4.2.2.Market size and forecast by equipment type

6.2.4.3.Mexico

6.2.4.3.1.Market size and forecast by reactor type
6.2.4.3.2.Market size and forecast by equipment type

6.3.Europe

6.3.1.Key market trends, growth factors, and opportunities
6.3.2.Market size and forecast by reactor type
6.3.3.Market size and forecast by equipment type
6.3.4.Market size and forecast by country

6.3.4.1.France

6.3.4.1.1.Market size and forecast by reactor type
6.3.4.1.2.Market size and forecast by equipment type

6.3.4.2.Germany

6.3.4.2.1.Market size and forecast by reactor type
6.3.4.2.2.Market size and forecast by equipment type

6.3.4.3.Spain

6.3.4.3.1.Market size and forecast by reactor type
6.3.4.3.2.Market size and forecast by equipment type

6.3.4.4.Russia

6.3.4.4.1.Market size and forecast by reactor type
6.3.4.4.2.Market size and forecast by equipment type

6.3.4.5.UK

6.3.4.5.1.Market size and forecast by reactor type
6.3.4.5.2.Market size and forecast by equipment type

6.3.4.6.Rest of Europe

6.3.4.6.1.Market size and forecast by reactor type
6.3.4.6.2.Market size and forecast by equipment type

6.4.Asia-Pacific

6.4.1.Key market trends, growth factors, and opportunities
6.4.2.Market size and forecast by reactor type
6.4.3.Market size and forecast by equipment type
6.4.4.Market size and forecast by country

6.4.4.1.Japan

6.4.4.1.1.Market size and forecast by reactor type
6.4.4.1.2.Market size and forecast by equipment type

6.4.4.2.China

6.4.4.2.1.Market size and forecast by reactor type
6.4.4.2.2.Market size and forecast by equipment type

6.4.4.3.India

6.4.4.3.1.Market size and forecast by reactor type
6.4.4.3.2.Market size and forecast by equipment type

6.4.4.4.South Korea

6.4.4.4.1.Market size and forecast by reactor type
6.4.4.4.2.Market size and forecast by equipment type

6.4.4.5.Rest of Asia-Pacific

6.4.4.5.1.Market size and forecast by reactor type
6.4.4.5.2.Market size and forecast by equipment type

6.5.LAMEA

6.5.1.Key market trends, growth factors, and opportunities
6.5.2.Market size and forecast by reactor type
6.5.3.Market size and forecast by equipment type
6.5.4.Market size and forecast by country

6.5.4.1.Brazil

6.5.4.1.1.Market Size and forecast by reactor type
6.5.4.1.2.Market size and forecast by equipment type

6.5.4.2.UAE

6.5.4.2.1.Market size and forecast by reactor type
6.5.4.2.2.Market size and forecast by equipment type

6.5.4.3.South Africa

6.5.4.3.1.Market size and forecast by reactor type
6.5.4.3.2.Market size and forecast by equipment type

6.5.4.4.Rest of LAMEA

6.5.4.4.1.Market size and forecast by reactor type
6.5.4.4.2.Market size and forecast by equipment type

CHAPTER 7:COMPANY PROFILES

7.1. ALSTOM SA

7.1.1.Company overview
7.1.2.Company snapshot
7.1.3.Operating business segments
7.1.4.Product portfolio
7.1.5.Business performance
7.1.6.Key strategic moves and developments

7.2. BWX Technologies, Inc. 

7.2.1.Company overview
7.2.2.Company snapshot
7.2.3.Operating business segments
7.2.4.Product portfolio
7.2.5.Business performance
7.2.6.Key strategic moves and developments

7.3. Dongfang Electric Co., Ltd. 

7.3.1.Company overview
7.3.2.Company snapshot
7.3.3.Operating business segments
7.3.4.Product portfolio
7.3.5.Business performance

7.4. DOOSAN CORPORATION 

7.4.1.Company overview
7.4.2.Company snapshot
7.4.3.Operating business segments
7.4.4.Product portfolio
7.4.5.Business performance

7.5. GENERAL ELECTRIC

7.5.1.Company overview
7.5.2.Company snapshot
7.5.3.Operating business segments
7.5.4.Product portfolio
7.5.5.Business performance
7.5.6.Key strategic moves and developments

7.6. Korea Electric Power Corporation

7.6.1.Company overview
7.6.2.Company snapshot
7.6.3.Operating business segments
7.6.4.Product portfolio
7.6.5.Business performance

7.7. Toshiba International Corporation

7.7.1.Company overview
7.7.2.Company snapshot
7.7.3.Operating business segments
7.7.4.Product portfolio
7.7.5.Business performance
7.7.6.Key strategic moves and developments

7.8. Mitsubishi Heavy Industries, Ltd.

7.8.1.Company overview
7.8.2.Company snapshot
7.8.3.Operating business segments
7.8.4.Product portfolio
7.8.5.Business performance
7.8.6.Key strategic moves and developments
 

7.9. LARSEN & TOUBRO LIMITED (L&T PIPING CENTER) 

7.9.1.Company overview
7.9.2.Company snapshot
7.9.3.Operating business segments
7.9.4.Product portfolio
7.9.5.Business performance

7.10. THE STATE ATOMIC ENERGY CORPORATION

7.10.1.Company overview
7.10.2.Company snapshot
7.10.3.Operating business segments
7.10.4.Product portfolio
7.10.5.Business performance
7.10.6.Key strategic moves and developments

LIST OF TABLES

TABLE 01.GLOBAL NUCLEAR POWER PLANT AND EQUIPMENT MARKET BY REACTOR TYPE, 2020-2030, ($MILLION) 
TABLE 02.PWR NUCLEAR POWER PLANT AND EQUIPMENT MARKET BY GEOGRAPHY 2020-2030, ($MILLION)
TABLE 03.PHWR NUCLEAR POWER PLANT AND EQUIPMENT MARKET BY GEOGRAPHY 2020-2030, ($MILLION) 
TABLE 04.BWR NUCLEAR POWER PLANT AND EQUIPMENT MARKET BY GEOGRAPHY 2020-2030, ($MILLION) 
TABLE 05.LWGR NUCLEAR POWER PLANT AND EQUIPMENT MARKET BY GEOGRAPHY 2020-2030, ($MILLION) 
TABLE 06.GCR NUCLEAR POWER PLANT AND EQUIPMENT MARKET BY GEOGRAPHY 2020-2030, ($MILLION) 
TABLE 07.OTHERS NUCLEAR POWER PLANT AND EQUIPMENT MARKET BY GEOGRAPHY 2020-2030, ($MILLION) 
TABLE 08.GLOBAL NUCLEAR POWER PLANT AND EQUIPMENT MARKET BY EQUIPMENT TYPE, 2020-2030, ($MILLION) 
TABLE 09.ISLAND EQUIPMENT NUCLEAR POWER PLANT AND EQUIPMENT MARKET BY GEOGRAPHY 
2020-2030, ($MILLION) 
TABLE 10.AUXILIARY EQUIPMENT NUCLEAR POWER PLANT AND EQUIPMENT MARKET BY GEOGRAPHY 
2020-2030, ($MILLION) 
TABLE 11.GLOBAL NUCLEAR POWER PLANT AND EQUIPMENT MARKET BY REGION, 2020-2030, ($MILLION) 
TABLE 12.NORTH AMERICA NUCLEAR POWER PLANT AND EQUIPMENT MARKET BY REACTOR TYPE, 
2020-2030, ($MILLION) 
TABLE 13.NORTH AMERICA NUCLEAR POWER PLANT AND EQUIPMENT MARKET BY EQUIPMENT TYPE, 
2020-2030, ($MILLION) 
TABLE 14.NORTH AMERICA NUCLEAR POWER PLANT AND EQUIPMENT MARKET BY COUNTRY, 2020-2030, ($MILLION) 
TABLE 15.U.S. NUCLEAR POWER PLANT AND EQUIPMENT MARKET VALUE, BY REACTOR TYPE, 2020 - 2030 ($MILLION) 
TABLE 16.U.S. NUCLEAR POWER PLANT AND EQUIPMENT MARKET BY EQUIPMENT TYPE, 2020-2030, ($MILLION) 
TABLE 17.CANADA NUCLEAR POWER PLANT AND EQUIPMENT MARKET BY REACTOR TYPE, 2020-2030, ($MILLION) 
TABLE 18.CANADA NUCLEAR POWER PLANT AND EQUIPMENT MARKET BY EQUIPMENT TYPE, 2020-2030, ($MILLION) 
TABLE 19.MEXICO NUCLEAR POWER PLANT AND EQUIPMENT MARKET BY REACTOR TYPE, 2020-2030, ($MILLION) 
TABLE 20.MEXICO NUCLEAR POWER PLANT AND EQUIPMENT MARKET BY EQUIPMENT TYPE, 2020-2030, ($MILLION) 
TABLE 21.EUROPE NUCLEAR POWER PLANT AND EQUIPMENT MARKET BY REACTOR TYPE, 2020-2030, ($MILLION) 
TABLE 22.EUROPE NUCLEAR POWER PLANT AND EQUIPMENT MARKET BY EQUIPMENT TYPE, 2020-2030, ($MILLION) 
TABLE 23.EUROPE NUCLEAR POWER PLANT AND EQUIPMENT MARKET BY COUNTRY, 2020-2030, ($MILLION) 
TABLE 24.FRANCE NUCLEAR POWER PLANT AND EQUIPMENT MARKET BY REACTOR TYPE, 2020-2030, ($MILLION) 
TABLE 25.FRANCE NUCLEAR POWER PLANT AND EQUIPMENT MARKET BY EQUIPMENT TYPE, 2020-2030, ($MILLION) 
TABLE 26.GERMANY NUCLEAR POWER PLANT AND EQUIPMENT MARKET BY REACTOR TYPE, 
2020-2030, ($MILLION) 
TABLE 27.GERMANY NUCLEAR POWER PLANT AND EQUIPMENT MARKET BY EQUIPMENT TYPE, 
2020-2030, ($MILLION) 
TABLE 28.SPAIN NUCLEAR POWER PLANT AND EQUIPMENT MARKET BY REACTOR TYPE, 2020-2030, ($MILLION) 
TABLE 29.SPAIN NUCLEAR POWER PLANT AND EQUIPMENT MARKET BY EQUIPMENT TYPE, 2020-2030, ($MILLION) 
TABLE 30.RUSSIA NUCLEAR POWER PLANT AND EQUIPMENT MARKET BY REACTOR TYPE, 2020-2030, ($MILLION) 
TABLE 31.RUSSIA NUCLEAR POWER PLANT AND EQUIPMENT MARKET BY EQUIPMENT TYPE, 2020-2030, ($MILLION) 
TABLE 32.UK NUCLEAR POWER PLANT AND EQUIPMENT MARKET BY REACTOR TYPE, 2020-2030, ($MILLION) 
TABLE 33.UK NUCLEAR POWER PLANT AND EQUIPMENT MARKET BY EQUIPMENT TYPE, 2020-2030, ($MILLION) 
TABLE 34.REST OF EUROPE NUCLEAR POWER PLANT AND EQUIPMENT MARKET BY REACTOR TYPE, 2020-2030, ($MILLION) 
TABLE 35.REST OF EUROPE NUCLEAR POWER PLANT AND EQUIPMENT MARKET BY EQUIPMENT TYPE, 2020-2030, ($MILLION) 
TABLE 36.ASIA-PACIFIC NUCLEAR POWER PLANT AND EQUIPMENT MARKET BY REACTOR TYPE, 2020-2030, ($MILLION) 
TABLE 37.ASIA-PACIFIC NUCLEAR POWER PLANT AND EQUIPMENT MARKET BY EQUIPMENT TYPE, 2020-2030, ($MILLION) 
TABLE 38.ASIA-PACIFIC NUCLEAR POWER PLANT AND EQUIPMENT MARKET BY COUNTRY, 2020-2030, ($MILLION) 
TABLE 39.JAPAN NUCLEAR POWER PLANT AND EQUIPMENT MARKET BY REACTOR TYPE, 2020-2030, ($MILLION) 
TABLE 40.JAPAN NUCLEAR POWER PLANT AND EQUIPMENT MARKET BY EQUIPMENT TYPE, 2020-2030, ($MILLION) 
TABLE 41.CHINA NUCLEAR POWER PLANT AND EQUIPMENT MARKET BY REACTOR TYPE, 2020-2030, ($MILLION) 
TABLE 42.CHINA NUCLEAR POWER PLANT AND EQUIPMENT MARKET BY EQUIPMENT TYPE, 2020-2030, ($MILLION) 
TABLE 43.INDIA NUCLEAR POWER PLANT AND EQUIPMENT MARKET BY REACTOR TYPE, 2020-2030, ($MILLION) 
TABLE 44.INDIA NUCLEAR POWER PLANT AND EQUIPMENT MARKET BY EQUIPMENT TYPE, 2020-2030, ($MILLION) 
TABLE 45.SOUTH KOREA NUCLEAR POWER PLANT AND EQUIPMENT MARKET BY REACTOR TYPE, 2020-2030, ($MILLION)
TABLE 46.SOUTH KOREA NUCLEAR POWER PLANT AND EQUIPMENT MARKET BY EQUIPMENT TYPE, 2020-2030, ($MILLION)
TABLE 47.REST OF ASIA-PACIFIC NUCLEAR POWER PLANT AND EQUIPMENT MARKET BY REACTOR TYPE, 2020-2030, ($MILLION) 
TABLE 48.REST OF ASIA-PACIFIC NUCLEAR POWER PLANT AND EQUIPMENT MARKET BY EQUIPMENT TYPE, 2020-2030, ($MILLION) 
TABLE 49.LAMEA NUCLEAR POWER PLANT AND EQUIPMENT MARKET BY REACTOR TYPE, 2020-2030, ($MILLION) 
TABLE 50.LAMEA NUCLEAR POWER PLANT AND EQUIPMENT MARKET BY EQUIPMENT TYPE, 2020-2030, ($MILLION) 
TABLE 51.LAMEA NUCLEAR POWER PLANT AND EQUIPMENT MARKET BY COUNTRY, 2020-2030, ($MILLION) 
TABLE 52.BRAZIL NUCLEAR POWER PLANT AND EQUIPMENT MARKET BY REACTOR TYPE, 2020-2030, ($MILLION) 
TABLE 53.BRAZIL NUCLEAR POWER PLANT AND EQUIPMENT MARKET BY EQUIPMENT TYPE, 2020-2030, ($MILLION) 
TABLE 54.UAE NUCLEAR POWER PLANT AND EQUIPMENT MARKET BY REACTOR TYPE, 2020-2030, ($MILLION) 
TABLE 55.UAE NUCLEAR POWER PLANT AND EQUIPMENT MARKET BY EQUIPMENT TYPE, 2020-2030, ($MILLION) 
TABLE 56.SOUTH AFRICA NUCLEAR POWER PLANT AND EQUIPMENT MARKET BY REACTOR TYPE, 2020-2030, ($MILLION) 
TABLE 57.SOUTH AFRICA NUCLEAR POWER PLANT AND EQUIPMENT MARKET BY EQUIPMENT TYPE, 2020-2030, ($MILLION) 
TABLE 58.REST OF LAMEA NUCLEAR POWER PLANT AND EQUIPMENT MARKET BY REACTOR TYPE, 2020-2030, ($MILLION) 
TABLE 59.REST OF LAMEA NUCLEAR POWER PLANT AND EQUIPMENT MARKET BY EQUIPMENT TYPE, 2020-2030, ($MILLION) 
TABLE 60.GE: COMPANY SNAPSHOT
TABLE 61.GE: OPERATING SEGMENTS
TABLE 62.GE: PRODUCT PORTFOLIO
TABLE 63.GE: KEY STRATEGIC MOVES AND DEVELOPMENTS
TABLE 64. ALSTOM SA: COMPANY SNAPSHOT
TABLE 65.MHI: OPERATING SEGMENTS
TABLE 66.MHI: PRODUCT PORTFOLIO
TABLE 67.MHI: KEY STRATEGIC MOVES AND DEVELOPMENTS
TABLE 68.DOOSAN: COMPANY SNAPSHOT
TABLE 69.DOOSAN: OPERATING SEGMENTS
TABLE 70.DOOSAN: PRODUCT PORTFOLIO
TABLE 71.ALSTOM SA : COMPANY SNAPSHOT
TABLE 72.ALSTOM SA : OPERATING SEGMENTS
TABLE 73.ALSTOM SA : PRODUCT PORTFOLIO
TABLE 74.TOSHIBA: COMPANY SNAPSHOT
TABLE 75.TOSHIBA: OPERATING SEGMENTS
TABLE 76.TOSHIBA: PRODUCT PORTFOLIO
TABLE 77.TOSHIBA: KEY STRATEGIC MOVES AND DEVELOPMENTS187
TABLE 78.DONGFANG: COMPANY SNAPSHOT
TABLE 79.DONGFANG: OPERATING SEGMENTS
TABLE 80.DONGFANG: PRODUCT PORTFOLIO
TABLE 81.ROSATOM: COMPANY SNAPSHOT
TABLE 82.ROSATOM: OPERATING SEGMENTS
TABLE 83.ROSATOM: PRODUCT PORTFOLIO
TABLE 84.ROSATOM: KEY STRATEGIC MOVES AND DEVELOPMENTS195
TABLE 85.BWX.: COMPANY SNAPSHOT
TABLE 86.BWX: OPERATING SEGMENTS
TABLE 87.BWX: PRODUCT PORTFOLIO
TABLE 88.BWX: KEY STRATEGIC MOVES AND DEVELOPMENTS
TABLE 89.KEPCO: COMPANY SNAPSHOT
TABLE 90.KEPCO: OPERATING SEGMENTS
TABLE 91.KEPCO: PRODUCT PORTFOLIO
TABLE 92.L&T: COMPANY SNAPSHOT
TABLE 93.L&T: OPERATING SEGMENTS
TABLE 94.L&T: PRODUCT PORTFOLIO
TABLE 95.L&T: KEY STRATEGIC MOVES AND DEVELOPMENTS

LIST OF FIGURES

FIGURE 01.MARKET SEGMENTATION: GLOBAL NUCLEAR POWER PLANT AND EQUIPMENT MARKET
FIGURE 02.TOP INVESTMENT POCKETS: NUCLEAR POWER PLANT AND EQUIPMENT MARKET, BY REACTOR TYPE
FIGURE 03.HIGH BARGAINING POWER OF SUPPLIERS
FIGURE 04.LOW BARGAINING POWER OF BUYERS
FIGURE 05.LOW THREAT OF NEW ENTRANTS
FIGURE 06.LOW THREAT OF SUBSTITUTES
FIGURE 07.HIGH INTENSITY OF COMPETITIVE RIVALRY
FIGURE 08.NUCLEAR POWER PLANT AND EQUIPMENT MARKET: IMPACT ANALYSES
FIGURE 09.TOP PLAYER POSITIONNG, 2020
FIGURE 10.COMPARATIVE ANALYSIS OF PWR MARKET, BY COUNTRY, 2020 & 20230 (%)
FIGURE 11.COMPARATIVE ANALYSIS OF PHWR MARKET, BY COUNTRY, 2020 & 2030 (%)
FIGURE 12.COMPARATIVE SHARE ANALYSIS OF BWR MARKET, BY COUNTRY, 2020 & 2030 (%)
FIGURE 13.COMPARATIVE ANALYSIS OF LWGR MARKET, BY COUNTRY, 2020 & 2030 (%)
FIGURE 14.COMPARATIVE  ANALYSIS OF GCR MARKET, BY COUNTRY, 2020 & 2030 (%)
FIGURE 15.COMPARATIVE  ANALYSIS OF OTHERS MARKET, BY COUNTRY, 2020 & 2030 (%)
FIGURE 16.COMPARATIVE  ANALYSIS OF ISLAND EQUIPMENT MARKET, BY COUNTRY, 2020 & 2030 (%)
FIGURE 17.COMPARATIVE  ANALYSIS OF AUXILIARY EQUIPMENT MARKET, BY COUNTRY, 2020 & 2030 (%)
FIGURE 18.GE: REVENUE, 2018-2020 ($MILLION) 
FIGURE 19.GE: REVENUE SHARE BY SEGMENT,2020 (%)
FIGURE 20.GE: REVENUE SHARE BY GEOGRAPHY (%)
FIGURE 21.MHI: REVENUE, 2018-2020 ($MILLION) 
FIGURE 22.MHI: REVENUE SHARE BY SEGMENT, 2020 (%)
FIGURE 23.MHI: REVENUE SHARE BY GEOGRAPHY, 2020 (%)
FIGURE 24.DOOSAN: REVENUE, 2018-2020 ($MILLION) 
FIGURE 25.DOOSAN: REVENUE SHARE BY SEGMENT, 2020 (%)
FIGURE 26.DOOSAN: REVENUE SHARE BY GEOGRAPHY, 2020 (%)
FIGURE 27.ALSTOM SA: REVENUE, 2018-2020 ($MILLION) 
FIGURE 28.ALSTOM SA: REVENUE SHARE BY SEGMENT, 2020 (%)
FIGURE 29.ALSTOM SA: REVENUE SHARE BY GEOGRAPHY, 2020 (%)
FIGURE 30.TOSHIBA: REVENUE, 2018-2020–2020 ($MILLION) 
FIGURE 31.TOSHIBA: REVENUE SHARE BY SEGMENT, 2020 (%)
FIGURE 32.TOSHIBA: REVENUE SHARE BY GEOGRAPHY, 2020 (%)
FIGURE 33.DONGFANG: REVENUE, 2018-2020 ($MILLION) 
FIGURE 34.ROSATOM: REVENUE, 2014–2018-2020 ($MILLION) 
FIGURE 35.BWX: REVENUE, 2018-2020 ($MILLION) 
FIGURE 36.BWX: REVENUE SHARE BY SEGMENT, 2020 (%)
FIGURE 37.BWX: REVENUE SHARE BY GEOGRAPHY, 2020 (%)
FIGURE 38.KEPCO: REVENUE, 2018-2020 ($MILLION) 
FIGURE 39.KEPCO: REVENUE SHARE BY SEGMENT, 2020 (%)
FIGURE 40.L&T: REVENUE, 2018-2020 ($MILLION) 
FIGURE 41.L&T: REVENUE SHARE BY SEGMENT, 2020 (%)
FIGURE 42.L&T: REVENUE SHARE BY GEOGRAPHY, 2020 (%)


The global nuclear power plant and equipment market registered a dynamic growth over the past few years, owing to drastic growth in electricity generation. In addition, huge investment plans of government of every nation with respect to nuclear power & energy generation boosted the nuclear power plant and equipment market across the globe. Moreover, nuclear power plants are used more often because they requires less maintenance and are designed to operate for longer stretches before refueling (typically every 1.5 or 2 years). According to the  report of the U.S. Department of Energy, the nuclear energy has by far the highest capacity factor of any other energy source. This means nuclear power plants are producing maximum power more than 93% of the time in 2021. It is about 1.5 to 2 times more as natural gas and coal units, and 2.5 to 3.5 times more reliable than wind and solar plants. Furthermore, nuclear power plant and equipment can operate in the long term and are energy-efficient as they use heat to generate steam that drives a steam turbine connected to a generator that produces electricity. However, growth in infrastructure development also boost the demand for nuclear power plant and equipment system. In addition, developing nations such as India, China, and & Japan plans to increase the urbanization and launched new projects such as smart cities which led to increase in the demand for electricity which, in turn, increase the demand for nuclear power plant & equipment market which may create wide opportunities.

PURCHASE OPTIONS

Call or Email us

U.S.-Canada Toll-free: +1-800-792-5285
Int'l : +1-503-894-6022
Europe : +44-845-528-1300
Email : help@alliedmarketresearch.com
 
FREQUENTLY ASKED QUESTIONS?

A. Power producers, warship and nuclear submarine manufacturers are the potential customers of Nuclear Power Plant and Equipment industry.

A. Pressurized water reactor segment holds the maximum share of the Nuclear Power Plant and Equipment market.

A. To get latest version of nuclear power plant and equipment market report can be obtained on demand from the website.

A. Asia-Pacific will provide more business opportunities for Nuclear Power Plant and Equipment in future, owing to rapid increase in the demand for power in this region.

A. Energy source for destroyers, warships, submarines and the need for un-interrupted power supply for the rockets are key applications expected to drive the adoption of Nuclear Power Plant and Equipment.

A. The top ten market players are selected based on two key attributes - competitive strength and market positioning

A. Rapid industrialization and technological advancements especially as electricity as energy source; led to rise in energy demand and generation of clean electricity across the globe. Countries investment for clean and efficient ways such as nuclear power to produce is a major driving factors and opportunities in the Nuclear Power Plant and Equipment market.

A. Agreement, joint venture, innovation, and product launch are the key growth strategy for Nuclear Power Plant and Equipment market players in order to attract the end users.

A. Alstom SA, BWX Technologies, Inc., Dongfang Electric Co., Ltd., Doosan Corporation, General Electric, Korea Electric Power Corporation, Larsen & Toubro Limited, Mitsubishi Heavy Industries, LTD, Toshiba Corporation, and The State Atomic Energy Corporation (ROSATOM).

A. Increase in investment in the development of energy resources due to depletion of conventional resources and innovation of safe nuclear fission power reactors such as small modular reactors; is a major influencing factor for the growth of the market in the coming years.

Looking for Customization?

 Customization Request

Have a Question?

 Speak with Analyst

Any Confusion?

 Inquire Before Buying

Have a glance of the Report

  Request Sample
RELATED TAGS

Purchase Full Report of
Nuclear Power Plant And Equipment Market

Start reading instantly.
This Report and over 68,399+ more Reports, Available with Avenue Library. T&C*.

  • Online Only
  • $3,712
  • Online cloud access only
  • Restricted print, copy, paste & download
  • Read only
  • Free industry update
    (Within 180 days)
  • Free report update in next update cycle
    (Feb 2023 - Feb 2024)
  • Data Pack
  • $4,125
  • Restricted to one authorized user
  • One print only
  • Available in
    Excel
  • Free industry update
    (Within 180 days)
  •   Free report update in next update cycle
    (Feb 2023 - Feb 2024)
  • Single User
  • $5,769
  • Restricted to one authorized user
  • One print only
  • Available in
    PDF
  • Free industry update
    (Within 180 days)
  •   Free report update in next update cycle
    (Feb 2023 - Feb 2024)
  • Five Users
  • $6,929
  • Limited to five authorized users
  • Print upto five copies
  • Available in
    PDF
  • Free industry update
    (Within 180 days)
  •   Free report update in next update cycle
    (Feb 2023 - Feb 2024)
  • Enterprise
    License/PDF

  • $10,663
  • Unlimited
    within
    company/enterprise
  • Available in Excel & PDF
  • Free industry update
    (Within 180 days)
  •   Free report update in next update cycle
    (Feb 2023 - Feb 2024)
  • Library
    Membership

  • $999 $ 1,175
    Per User/ Per month/ Billed annually
  • Published Content
    E-access
  • Company Profiles
    E-access
  • Newly Added Content Access
  • 10 PDF
    Downloads
  • 5 Excel Data
    Pack Downloads
  • 250 Company Profiles PDF Downloads
  • Buy Now

*Taxes/Fees, if applicable will be added during checkout. All prices in USD

RELATED REPORTS
 

Why Allied Market Research?


Infallible Methodology

To ensure high-level data integrity, accurate analysis, and impeccable forecasts

Analyst Support

For complete satisfaction

Customization

On-demand customization of scope of the report to exactly meet your needs

TARGETED MARKET VIEW

Targeted market view to provide pertinent information and save time of readers

Get fresh content delivered

Get insights on topics that are crucial for your business. Stay abreast of your interest areas.

Get Industry Data Alerts

Why Allied Market Research?

Infallible Methodology

To ensure high-level data integrity, accurate analysis, and impeccable forecasts

Analyst Support

For complete satisfaction

Customization

On-demand customization of scope of the report to exactly meet your needs

TARGETED MARKET VIEW

Targeted market view to provide pertinent information and save time of readers