
Nylon Market Research, 2033
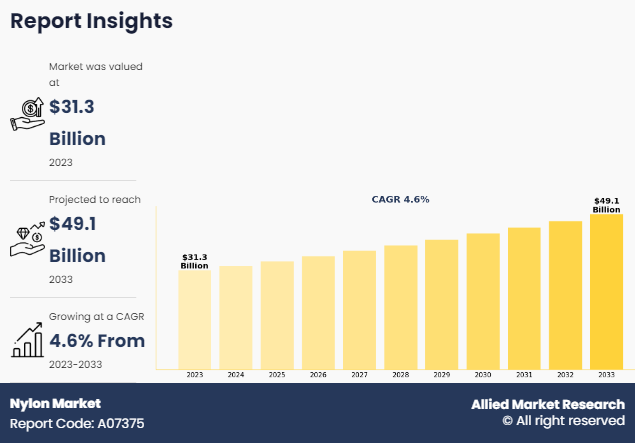
The global nylon market size was valued at $31.3 billion in 2023, and is projected to reach $49.1 billion by 2033, growing at a CAGR of 4.6% from 2023 to 2033. Nylon is a versatile synthetic polymer known for its durability, elasticity, and resistance to abrasion, chemicals, and moisture. It was first developed by a team of chemists led by Wallace Carothers at DuPont in the late 1930s. It is created through a process called polymerization, where molecules called monomers are combined to form long chains. These chains are then melted and spun into fibers, which are woven into textiles or molded into various shapes. Nylon's properties make it suitable for a wide range of applications, including clothing, carpets, ropes, and industrial components such as gears and bearings. Its strength-to-weight ratio is particularly notable, making it a popular choice for outdoor gear and sports equipment. In addition, nylon's ability to be easily dyed and molded has led to its widespread use in consumer products and industrial applications worldwide.
Key Takeaways:
- The report provides competitive dynamics by evaluating business segments, product portfolios, target market revenue, geographical presence and key strategic developments by prominent manufacturers.
- The nylon market is fragmented in nature among prominent companies such as Akzonobel, BASF SE, Cargill, CHEMPLAST SANMAR LIMITED, Dow, Hindustan Organic Chemicals Limited, and Royal Dutch Shell plc.
- The study contains qualitative information such as the market dynamics (drivers, restraints, challenges, and opportunities), public policy analysis, and Porter’s Five Force Analysis across North America, Europe, Asia-Pacific, LAMEA regions.
- Latest trends in global nylon market such as undergoing R&D activities, regulatory guidelines, and government initiatives are analyzed across 16 countries in 4 different regions.
- More than 3,100 nylon-related product literatures, industry releases, annual reports, and other such documents of key industry participants along with authentic industry journals and government websites have been reviewed for generating high-value industry insights for global nylon market.
Market Dynamics:
One of the primary drivers is the industry's ongoing focus on lightweighting to enhance fuel efficiency and reduce emissions. Nylon, being a lightweight and durable material, offers an attractive alternative to metals in various aerospace components. By replacing heavier materials with nylon composites or engineered polymers, aircraft manufacturers achieve significant weight savings without compromising structural integrity or performance. This contributes to fuel savings during flight operations, ultimately reducing operating costs for airlines and improving environmental sustainability.
Moreover, nylon's versatility and ability to be molded into complex shapes make it well-suited for manufacturing aerospace components with intricate geometries. Advanced manufacturing techniques such as injection molding and additive manufacturing enable the production of lightweight yet robust parts with tailored properties. This design flexibility allows engineers to optimize component performance, minimize material waste, and streamline assembly processes, leading to overall efficiency gains in aircraft production.
Nylon offers excellent barrier properties against oxygen, moisture, and other gases, making it an ideal material for packaging applications where product protection and shelf-life extension are critical. Nylon films or coatings are incorporated into packaging structures to create high-performance barrier layers, preserving the freshness, flavor, & quality of food, pharmaceuticals, and other perishable products. This capability enhances the appeal of nylon packaging solutions for manufacturers seeking to maintain product integrity and meet regulatory requirements.
In addition, nylon packaging materials provide a printable surface for branding, marketing, and product information purposes. Whether through flexographic, gravure, or digital printing technologies, manufacturers apply vibrant graphics, logos, and text onto nylon packaging films to enhance shelf appeal and communicate product attributes to consumers. This branding opportunity allows brands to differentiate their products in crowded markets, build brand recognition, and engage consumers at the point of purchase, driving sales and brand loyalty.
Furthermore, the demand for nylon is heavily influenced by its extensive use across various end-user industries. In the automotive sector, nylon is employed in the manufacturing of lightweight components, reducing fuel consumption and emissions. Similarly, in the textile industry, nylon fibers are prized for their strength and elasticity, making them ideal for clothing, carpets, and industrial fabrics. Moreover, the electronics industry utilizes nylon for its insulating properties, contributing to the production of electronic devices and components.
However, nylon’s production heavily relies on the availability and cost of its raw materials, primarily adipic acid and hexamethylene diamine. Any fluctuations in the prices or availability of these materials significantly impact the nylon market. Moreover, the procurement of these raw materials might face geopolitical risks, trade restrictions, or environmental regulations, further complicating the supply chain.
Furthermore, the nylon industry faces pressure from environmental regulations aimed at reducing pollution and carbon emissions. Nylon production involves energy-intensive processes and the release of greenhouse gases and other pollutants. Compliance with stringent environmental standards necessitates investments in cleaner technologies and processes, which increases production costs.
On the contrary, the advent of 3D printing technology has opened up new avenues for nylon in the manufacturing industry. Nylon's compatibility with additive manufacturing processes, coupled with its mechanical properties and affordability, makes it a popular choice for producing prototypes, functional parts, and custom-made components. As 3D printing continues to evolve and become more accessible, the demand for nylon filaments and powders for additive manufacturing is expected to grow, creating opportunities for material suppliers and technology providers alike.
Segment Overview:
The nylon market is segmented on the basis of type, end-use industry, and region. On the basis of type, the nylon market is categorized into nylon 6, nylon 6,6, nylon 6,10, nylon 4,6, and nylon 11 and 12. By end-use industry, the market is divided into automobile, electrical and electronics, aerospace, textile, packaging, and others. Region-wise, the market is studied across North America, Europe, Asia-Pacific, and LAMEA.

In 2023, the nylon 6 segment was the largest revenue generator, and is anticipated to grow at a CAGR of 4.8% during the forecast period. The demand for nylon 6 is on the rise due to its versatile applications across industries, cost-effectiveness, and excellent mechanical properties. With high tensile strength, toughness, and abrasion resistance, nylon 6 is ideal for textiles, automotive components, consumer goods, and industrial equipment. Its lightweight nature makes it appealing for weight-sensitive applications, while its chemical resistance ensures durability in various environments. Additionally, its recyclability aligns with sustainability efforts, appealing to environmentally-conscious consumers and industries. As emerging markets expand and industries seek reliable and cost-effective materials, the demand for nylon 6 continues to grow steadily.

By end-use industry, the automobile segment dominated the global market in 2023, and is anticipated to grow at a CAGR of 4.7% during forecast period. The demand for nylon in the automobile sector is experiencing growth due to its numerous advantageous properties and versatility. Nylon's exceptional strength-to-weight ratio makes it ideal for lightweighting initiatives, aiding in the reduction of vehicle weight and subsequently improving fuel efficiency. Additionally, its impact resistance, durability, and ability to withstand high temperatures make it suitable for various automotive components, including engine covers, intake manifolds, fuel tanks, and airbags. Moreover, nylon's chemical resistance and flexibility allow for innovative designs and the integration of advanced technologies, further driving its adoption in the automotive industry's pursuit of performance, efficiency, and safety.

The Asia-Pacific nylon market size is projected to grow at the highest CAGR of 4.9% during the forecast period and accounted for major share in 2023. The demand for nylon in the Asia-Pacific region is witnessing significant growth due to several key factors. First, the region's booming population and rising middle class have led to increased consumer spending on goods like apparel, home furnishings, and automotive products, all of which commonly incorporate nylon. Second, Asia-Pacific's robust industrial sector, particularly in countries like China, Japan, and South Korea, drives demand for nylon in various applications, including machinery parts, electrical components, and packaging materials. Additionally, ongoing infrastructure development projects in the region further contribute to the demand for nylon-based products such as pipes, cables, and construction materials. Moreover, the region's focus on sustainability and environmental regulations encourages the adoption of recyclable materials like nylon, fostering its growth across diverse industries in the Asia-Pacific.
Competitive Analysis:
The key players in the global nylon market report include DuPont, BASF SE, Lanxess AG, NYCOA, Ascend Performance Materials LLC, DOMO Chemicals, SINOPEC, Formosa Chemicals & Fibre Corp., INVISTA, and SRM Polymers.
Other players involved in manufacturing of nylon include Shenma Industrial Co., Ltd., Radici Partecipazioni SpA, Ashley Polymers Inc., Toray, Ube Industries Ltd., Perfect Polymers, Nahata Plastics, Goodway Industries, Metoree, Casilon Polymers Pvt. Ltd., and others. The global nylon market report provides in-depth competitive analysis as well as profiles of these major players
Key Benefits For Stakeholders
- This report provides a quantitative analysis of the market segments, current trends, estimations, and dynamics of the nylon market analysis from 2023 to 2033 to identify the prevailing nylon market opportunities.
- The market research is offered along with information related to key drivers, restraints, and opportunities.
- Porter's five forces analysis highlights the potency of buyers and suppliers to enable stakeholders make profit-oriented business decisions and strengthen their supplier-buyer network.
- In-depth analysis of the nylon market segmentation assists to determine the prevailing market opportunities.
- Major countries in each region are mapped according to their revenue contribution to the global market.
- Market player positioning facilitates benchmarking and provides a clear understanding of the present position of the market players.
- The report includes the analysis of the regional as well as global nylon market trends, key players, market segments, application areas, and market growth strategies.
Nylon Market Report Highlights
| Aspects | Details |
| Forecast period | 2023 - 2033 |
| Report Pages | 350 |
| By Type |
|
| By End-Use Industry |
|
| By Region |
|
| Key Market Players | Domo Chemicals Corporation, NYCOA, INVISTA, DUPONT, sinopec, Domo Chemicals, BASF SE, Ascend Performance Materials LLC, Formosa Chemicals & Fibre Corp., Lanxess AG |
Analyst Review
According to CXOs of leading companies, the drivers propelling the nylon market forward are multifaceted and dynamic, reflecting the material's versatility, durability, and applicability across diverse industries and regions. Technological advancements continue to push the boundaries of nylon's performance capabilities, with ongoing research and development efforts focusing on enhancing its properties and expanding its applications. Economic trends, particularly in emerging markets, drive demand for nylon-based products as industrialization, urbanization, and infrastructure development create opportunities for growth. Moreover, sustainability initiatives and regulatory frameworks incentivize the adoption of nylon as a recyclable and eco-friendly material, aligning with consumer preferences for sustainable products. Additionally, lightweighting initiatives in sectors such as automotive and aerospace fuel the demand for nylon, given its high strength-to-weight ratio and durability. Furthermore, globalization and trade dynamics facilitate the expansion of the nylon market by enabling the free flow of goods and technologies across borders, fostering collaboration and innovation within the industry. Geopolitical risks, raw material price volatility, and competition from alternative materials pose challenges to the nylon market's growth trajectory, necessitating strategic investments, innovation, and adaptation to evolving market dynamics. Despite these challenges, the outlook for the nylon market remains positive, driven by a combination of technological innovation, economic growth, sustainability imperatives, and changing consumer preferences, positioning nylon as a key player in the global materials landscape for years to come.
Versatility across industries, Lightweighting initiatives, Technological Advancements, and Economic Trends are the upcoming trends of Nylon Market in the world
Automobile is the leading application of Nylon Market.
Asia-Pacific is the largest regional market for Nylon.
The global nylon market was valued at $31.3 billion in 2023, and is estimated to reach $49.1 billion by 2033, growing at a CAGR of 4.6% from 2023 to 2033.
DuPont, BASF SE, Lanxess AG, NYCOA, Ascend Performance Materials LLC, DOMO Chemicals, SINOPEC, Formosa Chemicals & Fibre Corp., INVISTA, and SRM Polymers are the top companies to hold the market share in the Nylon market.
Loading Table Of Content...
Loading Research Methodology...

