
Office Furniture Market Research, 2033
Market Introduction and Definition
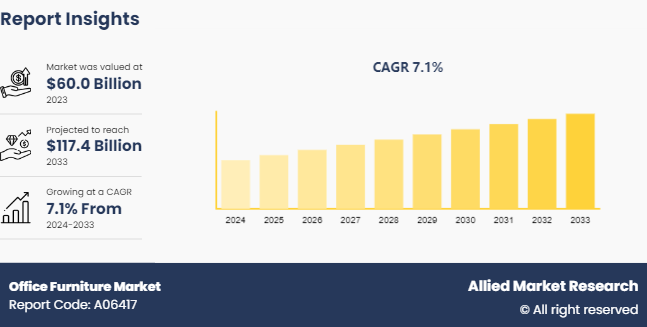
The global office furniture market was valued at $60.0 billion in 2023, and is projected to reach $117.4 billion by 2033, growing at a CAGR of 7.1% from 2024 to 2033. The office furniture market involves the design, production, and distribution of furniture items tailored for workspaces, such as desks, chairs, storage units, and accessories. This office furniture market serves a wide range of settings, including corporate offices, home offices, and public institutions. The primary goal of office furniture is to provide functional, comfortable, and aesthetically pleasing solutions that support productivity and well-being in the workplace. Key aspects of the market include ergonomic design, which focuses on reducing strain and enhancing comfort for users, and adaptability, which allows for flexible configurations to suit various work styles and environments. In addition, there is a growing importance on sustainability, with increasing use of eco-friendly materials and practices. The office furniture industry is continuously evolving to meet the changing demands of modern workspaces, influenced by trends such as remote work, technological integration, and a focus on health and wellness.
Key Takeaways
The office furniture market study covers 20 countries. The research includes a segment analysis of each country in terms of value for the projected period.
More than 1, 500 product literatures, industry releases, annual reports, and other such documents of major office furniture industry participants along with authentic industry journals, trade associations' releases, and government websites have been reviewed for generating high-value industry insights.
The study integrated high-quality data, professional opinions & analysis, and critical independent perspectives. The research approach is intended to provide a balanced view of global markets and to assist stakeholders in making educated decisions to achieve their most ambitious growth objectives.
Key Market Dynamics
The hybrid workplace model has led to an increase in demand for flexible and ergonomic office furniture market. According to a report from Steelcase indicated that 70% of leaders in the U.S. are considering a hybrid model. Globally, 72% of leaders plan to use a hybrid workplace model, allowing employees to spend some time in the office and some time at home in a week. This shift has driven the need for adaptable furniture solutions, such as height-adjustable desks and ergonomic chairs, which support both in-office and remote work environments. Collaborative design trends, promoting open and versatile office layouts, further increase demand as companies invest in spaces that encourage teamwork and innovation.
However, inflation has significantly impacted the office furniture market size, with prices for raw materials like steel, foam, and wood rising sharply. According to OFDC Commercial Interiors, year-over-year inflation rates throughout 2022 ranged from 7.1% to 9.1%. By comparison, policymakers generally believe 2% is an acceptable inflation rate. This increase in costs has led many businesses to delay or downsize their furniture purchases, affecting overall office furniture market growth. Companies are also seeking cost-saving alternatives, including refurbished or modular furniture, to mitigate the financial impact.
Moreover, the market for refurbished and rental office furniture is expanding as businesses prioritize sustainability and cost efficiency. A study by the Ellen MacArthur Foundation highlighted that the circular economy, including the refurbishment and reuse of products, can reduce greenhouse gas emissions and waste. In addition, the Environmental Protection Agency (EPA) has noted a growing trend in the reuse of office furniture, driven by both economic and environmental considerations. The rental market, particularly, is thriving among startups and small businesses looking for flexible and less capital-intensive solutions.
Top Office Furniture Importing and Exporting Countries in 2022
Top Exporters of Office Furniture (2022)
Country | Export in Billion |
China | 0.93 |
Canada | 0.49 |
Germany | 0.22 |
Italy | 0.21 |
UK | 0.16 |
In 2022, the top exporters of?Office furniture were?China? ($0.93 Billion) , ?Canada? ($0.49Billion) , ?Germany? ($0.22n Billion) , ?Italy? ($0.21 Billion) , and?UK ($0.16 Billion) .
Top Importers of Office Furniture (2022)
Country | Import in Billion |
U.S. | 0.98 |
Germany | 0.28 |
France | 0.23 |
Canada | 0.17 |
UK | 0.141 |
In 2022, the top importers of?Office furniture were?U.S.? ($0.98 Billion) , ?Germany? ($0.28 Billion) , ?France? ($0.23 Billion) , ?Canada? ($0.17 Billion) , and?UK? ($0.14 Billion.)
Market Segmentation
The office furniture market is segmented into material, type, distribution channel, industrial vertical, and region. On the basis of material, the market is divided into wood, plastic & fiber, glass, metal, and others. As per type, the market is categorized into tables, overhead bins, seating, storage units & file cabinets, systems and others. On the basis of distribution channel, the market is divided into direct sales, retailers, un-organized contractors, online, and others. As per industrial vertical, the market is classified into automotive, educational institution, offices, healthcare, and others. Region wise, the market is analyzed across North America, Europe, Asia-Pacific, and LAMEA.
Regional/Country Market Outlook
Asia-Pacific holds the major office furniture market share, driven primarily by the region's strong manufacturing base and growth in the commercial sector. China, a major player, accounts for approximately 52% of global furniture production, making it a key contributor to the market's dominance. For instance, the city of Foshan, responsible for 75% of China's furniture manufacturing. Foshan is renowned for its high-quality and modern designs, often influenced by global trends, making it a hub for innovation in industry. The city's reputation for craftsmanship and design attracts international attention and demand, enhancing the global appeal of furniture produced there. This strong manufacturing capability, coupled with increasing investments in office spaces across Asia-Pacific, propels the region's leadership in the office furniture market. The combination of skilled labor, advanced production techniques, and a growing emphasis on design ensures that Asia-Pacific remains dominant in this sector.
Industry Trends
Ergonomics and Health-Focused Designs: There is a growing importance on ergonomic furniture that promotes better posture and reduces the risk of workplace-related injuries. Products such as adjustable desks and ergonomic chairs are increasingly popular as companies prioritize employee health and well-being.
Sustainability: The demand for eco-friendly and sustainable furniture is rising. Manufacturers are focusing on using recycled materials, sustainable sourcing practices, and reducing the carbon footprint of their products. This trend aligns with broader environmental concerns and corporate responsibility initiatives.
Hybrid Work Solutions: With the rise of remote and hybrid work models, there is a significant demand for versatile and adaptable furniture that can be used both at home and in traditional office settings. This includes modular desks, portable furniture, and compact storage solutions.
Technological Integration: The integration of technology into office furniture is becoming more common, with features such as built-in power outlets, wireless charging, and smart desks that adjust to user preferences. This trend reflects the increasing digitalization of workspaces.
Design and Aesthetics: Modern office furniture design increasingly emphasizes aesthetics, blending functionality with contemporary styles. There is a notable office furniture market demand towards minimalistic, open-concept designs that promote a visually appealing and collaborative work environment.
Competitive Landscape
The major players operating in the office furniture market include Haworth Inc., Herman Miller Inc., Omega HNI Corp., Kimball International Inc., Inter IKEA Holding BV, KOKUYO Co. Ltd., OKAMURA Corp., Hooker Furniture, Knoll Inc., Steelcase Inc.
Recent Key Strategies and Developments
In September 2022, Steelcase Inc. announced the launch of its new ergonomic chair called Steelcase Karman, which is designed to respond to the body’s movement and provide comfort naturally and is manufactured with new proprietary mesh textile and ultra-light flexible frame.
In May 2022, Steelcase Inc. signed a definitive agreement to acquire Halcon. Halcon is a Minnesota-based designer and manufacturer of wood furniture for the workplace. The acquisition is to leverage the current Steelcase wood products portfolio.
In April 2024, Herman Miller and Studio 7.5 introduced Zeph Side Chair to enliven and add comfort to shared workspaces.
Key Benefits For Stakeholders
This report provides a quantitative analysis of the market segments, current trends, estimations, and dynamics of the office furniture market analysis from 2024 to 2033 to identify the prevailing office furniture market opportunities.
The market research is offered along with information related to key drivers, restraints, and opportunities.
Porter's five forces analysis highlights the potency of buyers and suppliers to enable stakeholders make profit-oriented business decisions and strengthen their supplier-buyer network.
In-depth analysis of the office furniture market segmentation assists to determine the prevailing market opportunities.
Major countries in each region are mapped according to their revenue contribution to the global market.
Market player positioning facilitates benchmarking and provides a clear understanding of the present position of the market players.
The report includes the analysis of the regional as well as global office furniture market trends, key players, market segments, application areas, and market growth strategies.
Office Furniture Market Report Highlights
| Aspects | Details |
| Market Size By 2033 | USD 117.4 Billion |
| Growth Rate | CAGR of 7.1% |
| Forecast period | 2024 - 2033 |
| Report Pages | 150 |
| By Material |
|
| By Type |
|
| By Distribution Channel |
|
| By Industrial Vertical |
|
| By Region |
|
| Key Market Players | Inter IKEA Holding BV, Hooker Furniture Corp., OKAMURA Corp., Omega HNI Corp., Herman Miller Inc., Haworth Inc., Steelcase Inc., Knoll Inc., Kimball International Inc., KOKUYO Co. Ltd. |
The global office furniture market is witnessing emerging trends that cater to the evolving workplace landscape. Key upcoming trends include the increased adoption of modular, flexible furniture designs that enable adaptable workspaces, as well as a growing emphasis on ergonomic solutions that prioritize employee comfort and productivity in the wake of the pandemic-driven shift towards hybrid and remote work models.
The leading application of the office furniture market is in corporate office settings. These furniture solutions are essential for equipping traditional office environments, providing employees with desks, chairs, storage units, and collaborative workspaces that enhance productivity, comfort, and functionality. Additionally, the market also caters to the furniture needs of other commercial spaces, such as educational institutions, healthcare facilities, and hospitality venues.
Asia-Pacific is the largest regional market for office furniture.
The global office furniture market was valued at $60.0 billion in 2023, and is projected to reach $117.4 billion by 2033, growing at a CAGR of 7.1% from 2024 to 2033.
Haworth Inc., Herman Miller Inc., Omega HNI Corp. the top companies to hold the market share in office furniture.
Loading Table Of Content...

