0
2022
Oil Country Tubular Goods Market

Oil Country Tubular Goods Market

by Manufacturing Process (Electric Resistance Welded and Seamless), Product (Well Casing, Production Tubing, Drill Pipe, and Others), Application (Onshore and Offshore), and Grade (API Grade and Premium Grade): Global Opportunity Analysis and Industry Forecast, 2021-2030

Report Code: A09028
Jan 2022 | Pages: 303
Tables: 161
Charts: 77
  • Formats*:

  • pdf

    Single User License, Five User
    License & Enterprise User License

  • xls

    Data Pack Excel License

  • ppt

    It comes with the additional cost
    of $2500.00 contact sales.


COVID-19

Pandemic disrupted the entire world and affected many industries.

Get detailed COVID-19 impact analysis on the Oil Country Tubular Goods Market

Request Now !

Oil Country Tubular Goods Market Outlook - 2021-2030

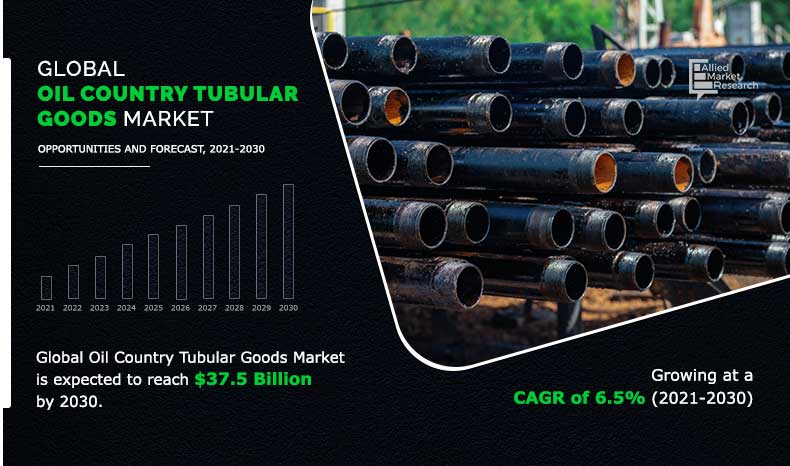
The global Oil Country Tubular Goods market size was valued at $20.9 billion in 2020, and projected to reach $37.5 billion by 2030, with a CAGR of 6.5% from 2021 to 2030. Oil Country Tubular Goods is consolidation of group of tubular products such as drill pipe, casing, line pipe, and tubing that are subjected to loading conditions according to their specific application. American Petroleum Institute grade is widely used all over the world due to its versatility and safety. The main function of API is to define and draft standards for the oil and petroleum industry to ensure the safety and reliability of the industrial equipment. Premium grade products are those which follow the specification of the International Organization for Standardization. Oil country tubular goods have applications in the onshore & offshore exploration and extraction facilities. Well casing is generally held in position with the help of cement or other materials between casings and wellbore. It also prevents unwanted fluids & gases from entering the well. 

The COVID-19 outbreak attributed to the significant disruptions in the raw material transportation, presence of low-labor, led to shutdown of many manufacturing industries led to decline of demand power. Hence, decrease in the demand for Oil Country Tubular Goods market during this period.

Oil and gas play a vital role in the development of an economy and development of a civilization. The increase in the rig count of oil & gas fields in the offshore areas and the recent development of application of shale gas in the U.S. have fueled the keen interest of government and private investment in the oil & gas sector. The surge in the offshore explorations in the North sea’s exploration activity has now moved in to deeper waters that require more sophisticated equipment, which have led to the growth of the oil country tubular goods market.

Global-Oil-Country-Tubular-Goods-Market

The government policies and restriction over the development of the oil country tubular goods by manufacturers from other countries in order to support the development of local manufacturers and increase the GDP of the country have hampered the development of the market. The uncertainties with regard to the international crude oil prices have certain impact on the development of the oil country tubular goods market.  

The Oil Country Tubular Goods market is segmented on the basis of manufacturing process, product, application, grade, and region. 

On the basis of manufacturing process, the global market is segmented into electric resistance welded and seamless. On the basis of product, the market is fragmented into well casing, product tubing, drill pipe, and others. On the basis of application, the global market is bifurcated into onshore and offshore. On the basis of grade, it is classified into API grade and Premium grade.

Region wise, the market is studied across North America, Europe, Asia-Pacific, and LAMEA. Presently, North America accounts for the largest share of the market, followed by Asia-Pacific and Europe. 

The major companies profiled in this report include ArcelorMittal SA, EVRAZ North America, ILJIN Steel Corporation, JFE Steel Corporation. National-Oilwell Varco Inc, Oil Country Tubular Limited, Sumitomo Corporation, Tenaris, TMK Ipsco Enterprises Inc., and U.S. Steel Corporation. Rapid industrialization, modernization has led to the increase in the demand for energy resources and chemical raw materials, which in-turn has fueled the demand for Oil Country Tubular Goods. Additional growth strategies such as expansion of production capacities, acquisition, partnership, and joint venture in the development of the high quality OCTG products from manufacturers have helped to attain key developments in the global Oil Country Tubular Goods market trends. 

In addition to the above mentioned companies, TPCO Inc., Vallourec SA, Continental Alloys, Anhui Tianda Oil Pipe Company, and others also compete for the share of the market through partnership, acquisition, and expansion of the production capabilities to meet the future demand for the Oil Country Tubular Goods during the forecast period.

Oil Country Tubular Goods Market, By Region

North America has the largest share of the Oil Country Tubular Goods market and consists of countries such as U.S., Canada, and Mexico. The U.S. was the largest crude oil producer in the world, as of 2019. During the past decade, the shale drilling regions of the U.S. have expanded the use of horizontal and directional drilling activities. Liberation of the oil & gas industry in Canada and Mexico led to increase in the foreign investment thereby helping the growth oil & gas industry. The rise in deep-water exploration in remote areas with harsh environments has resulted in an increase in the use of premium quality products, which drives the growth of the market. Mexico is one of the major offshore deep-water reserves, which is likely to witness an upsurge in the production during the forecast period.

Oil Country Tubular Goods Market
By Region

2030
North America 
Europe
Asia-Pacific
LAMEA

North America holds a dominant position in 2020 and would continue to maintain the lead over the forecast period.

Get more information on this report : Request Sample Pages

Oil Country Tubular Goods Market, By Manufacturing Process

The seamless segment dominates the global Oil Country Tubular Goods market. The surge in the usage of seamless tube in oil & natural gas industry is mostly as it is extruded and drawn from a billet. It also offers a higher range of safety measures compared to welded tube. A seamless tube is relatively short in length and generally does not show any sign of corrosion until and unless it is subjected to a highly corrosive environment. The increase in exploration activities in the off shore fields and redevelopment of many oil fields are expected to provide ample opportunities for the growth of the seamless process of Oil Country Tubular Goods market.

Oil Country Tubular Goods Market
By Manufacturing Process

Your browser does not support the canvas element.

Electric Resistance Welded segment is projected as the most lucrative segment.

Get more information on this report : Request Sample Pages

Oil Country Tubular Goods Market, By Product

The well casing segment dominates the global Oil Country Tubular Goods market. Well casing refers to large diameter pipe inserted into the drilled section of a borehole. This casing is generally held in the position with the help of cement or other materials between the casings and wellbore. It is considered as a significant part of the well completion activity. The increase in demand for the well casing in this market is mostly due to the reason that it provides aid in the drilling process in several ways and provides a strong foundation to allow use of high density drilling fluid to continue drilling deeper and provide a smooth internal bore for installing production equipment, which are expected to provide ample opportunities for the growth of the well casing product in Oil Country Tubular Goods market.

Oil Country Tubular Goods Market
By Product

Your browser does not support the canvas element.

Well Casing is projected as the most lucrative segment.

Get more information on this report : Request Sample Pages

Oil Country Tubular Goods Market, By Application

The onshore segment dominates the global Oil Country Tubular Goods market. Onshore refers to process that takes place on land that are associated with oil, gas or condensate production that has taken place offshore. Onshore oil terminal includes large crude oil tanks for the initial storage of oil prior to processing. Tanks provide a buffer volume where oil is delivered by tanker. The increase in the demand for oil & gas to develop wide variety of chemical products and fuel in the automotive sector have led to the exploration of the onshore oil fields that have driven the need for oil country tubular goods for the transportation of the crude oil, which is expected to provide ample opportunities for the growth of the onshore segment of Oil Country Tubular Goods market.

Oil Country Tubular Goods Market
By Application

Your browser does not support the canvas element.

Onshore is projected as the most lucrative segment.

Get more information on this report : Request Sample Pages

Oil Country Tubular Goods Market, By Grade

The premium grade segment dominates the global Oil Country Tubular Goods market. The development and exploration of oil & natural gas fields in offshore region and the need for high grade transportation tubes, which can resist corrosion, have guarantee leak proof performance and sealing integrity of the connections even when subjected to a combinations of loads, bending, and high internal pressure. The demand for premium tubing to transport oil and gas from onshore and offshore fields to the consumer’s site is expected to provide ample opportunities for the Oil Country Tubular Goods market growth.  

Oil Country Tubular Goods Market
By Grade

Your browser does not support the canvas element.

Premium Grade is projected as the most lucrative segment.

Get more information on this report : Request Sample Pages

COVID-19 analysis:

The COVID-19 pandemic has negatively impacted the global Oil Country Tubular Goods market drastically. The pandemic has affected various industries and has caused global economic slowdown. It has major impact on energy systems across the world due to lockdown and improper transportation among the countries. The outbreak of pandemic led to partial or complete shutdown of production facilities, which are not related to essential goods, owing to prolonged lockdown in major countries such as the U.S., China, Japan, India, and Germany. The oil & gas industry has been negatively affected by pandemic as most countries worldwide imposed lockdown restriction, which have impacted the import & export of goods and services, leading to a decline in the sales of oil & gas. The linear increase in the development of global production of oil and natural gas from 2017 to 2018 was considerably disrupted due to pandemic outbreak. 

Key benefits for stakeholders

  • This report provides a detailed quantitative analysis of the current market trends and estimations from 2020 to 2030, which assists to identify the prevailing opportunities. 
  • An in-depth Oil Country Tubular Goods market analysis across the globe is anticipated to provide a detailed understanding of the current trends to enable stakeholders formulate specific plans.
  • A comprehensive analysis of the factors that drive and restrain the growth of the global Oil Country Tubular Goods industry is provided.
  • Region-wise and country-wise market conditions are comprehensively analyzed in this report.
  • The projections in this report are made by analyzing the current trends and future market potential from 2020 to 2030 in terms of value.
  • An extensive analysis of various regions provides insights that are expected to allow companies to strategically plan their business moves.
  • Key market players within the market are profiled in this report and their strategies are analyzed thoroughly, which help to understand the competitive outlook of the global Oil Country Tubular Goods market.

Oil Country Tubular Goods Market Report Highlights

Aspects Details
By Manufacturing Process
  • Electric Resistance Welded (ERW)
  • Seamless
By Product
  • Well Casing
  • Product tubing
  • Drill Pipe
  • Others (Line Pipe)
By Application
  • Onshore
  • Offshore
By Grade
  • API Grade
  • Premium Grade
By Region
  • North America  (US, Canada, Mexico)
  • Europe  (Germany, France, Italy, Spain, UK, Rest of Europe)
  • Asia-Pacific  (China, Japan, India, South Korea, Australia, rest of Asia-Pacific)
  • LAMEA  (Brazil, Saudi Arabia, South Africa, Rest of LAMEA)
Key Market Players JFE STEEL CORPORATION, OIL COUNTRY TUBULAR LIMITED, TENARIS, NOV INC., U.S. STEEL CORPORATION, EVRAZ NORTH AMERICA PLC, ARCELORMITTAL SA, SUMITOMO CORPORATION, TMK INC., ILJIN STEEL CORPORATION
 

CHAPTER 1:INTRODUCTION

1.1.Report description
1.2.Key benefits for stakeholders
1.3.Key market segments
1.4.Research methodology

1.4.1.Secondary research
1.4.2.Primary research

1.5.Analyst tools and models

CHAPTER 2:EXECUTIVE SUMMARY

2.1.Key findings of the study
2.2.CXO perspective

CHAPTER 3:MARKET OVERVIEW

3.1.Market definition and scope
3.2.Key findings

3.2.1.Top investment pockets

3.3.Porter’s five forces analysis
3.4.Market dynamics

3.4.1.Drivers

3.4.1.1.Rise in drilling &production activities and the advent of technologically advanced pipes. 
3.4.1.2.The growing global offshore rig count and exploration of resources. 

3.4.2.Restraints

3.4.2.1.Uncertainties in the international crude oil prices
3.4.2.2.Increased import duty on oil country tubular goods

3.4.3.Opportunity

3.4.3.1.Extensive expansion of oil and gas resources. 

3.5.Value chain analysis
3.6.Impact of key regulations on the Global Oil Country Tubular Goods market
3.7.Impact of COVID-19 on the Global Oil Country Tubular Goods market

CHAPTER 4:OIL COUNTRY TUBULAR GOODS MARKET, BY MANUFACTURING PROCESS68

4.1.Overview

4.1.1.Market size and forecast

4.2.Electric resistance welded

4.2.2.Market size and forecast, by region
4.2.3.Comparative share analysis, by country

4.3.Seamless

4.3.1.Key market trends, growth factors, and opportunities
4.3.2.Market size and forecast, by region
4.3.3.Comparative share analysis, by country

CHAPTER 5:OIL COUNTRY TUBULAR GOODS MARKET, BY PRODUCT

5.1.Overview

5.1.1.Market size and forecast

5.2.Well casing

5.2.1.Key market trends, growth factors, and opportunities
5.2.2.Market size and forecast, by region
5.2.3.Comparative share analysis, by country

5.3.Production tubing

5.3.1.Key market trends, growth factors, and opportunities
5.3.2.Market size and forecast, by region
5.3.3.Comparative share analysis, by country

5.4.Drill Pipe

5.4.1.Key market trends, growth factors, and opportunities
5.4.2.Market size and forecast, by region
5.4.3.Comparative share analysis, by country

5.6.Others

5.6.1.Key market trends, growth factors, and opportunities
5.6.2.Market size and forecast, by region
5.6.3.Comparative share analysis, by country

CHAPTER 6:OIL COUNTRY TUBULAR GOODS MARKET, BY APPLICATION

6.1.Overview

6.1.1.Market size and forecast

6.2.Onshore

6.2.1.Key market trends, growth factors, and opportunities
6.2.2.Market size and forecast, by region
6.2.3.Comparative share analysis, by country

6.3.Offshore

6.3.1.Key market trends, growth factors, and opportunities
6.3.2.Market size and forecast, by region
6.3.3.Comparative share analysis, by country

CHAPTER 7:OIL COUNTRY TUBULAR GOODS MARKET, BY GRADE

7.1.Overview

7.1.1.Market size and forecast

7.2.API Grade

7.2.1.Key market trends, growth factors, and opportunities
7.2.2.Market size and forecast, by region
7.2.3.Comparative share analysis, by country

7.3.Premium Grade

7.3.1.Key market trends, growth factors, and opportunities
7.3.2.Market size and forecast, by region
7.3.3.Comparative share analysis, by country

CHAPTER 8:GLOBAL OIL COUNTRY TUBULAR GOODS MARKET, BY REGION

8.1.Overview

8.1.1.Market size and forecast, by region

8.2.North America

8.2.1.Key market trends, growth factors, and opportunities
8.2.2.Market size and forecast, by manufacturing process
8.2.3.Market size and forecast, by product
8.2.4.Market size and forecast, by application
8.2.5.Market size and forecast, by grade
8.2.6.Market analysis, by country

8.2.6.1.U.S. 

8.2.6.1.1.Market size and forecast, by manufacturing process
8.2.6.1.2.Market size and forecast, by product
8.2.6.1.3.Market size and forecast, by application
8.2.6.1.4.Market size and forecast, by grade

8.2.6.2.Canada

8.2.6.2.1.Market size and forecast, by manufacturing process
8.2.6.2.2.Market size and forecast, by product
8.2.6.2.3.Market size and forecast, by application
8.2.6.2.4.Market size and forecast, by grade

8.2.6.3.Mexico

8.2.6.3.1.Market size and forecast, by manufacturing process
8.2.6.3.2.Market size and forecast, by product
8.2.6.3.3.Market size and forecast, by application
8.2.6.3.4.Market size and forecast, by grade

8.3.Europe

8.3.1.Key market trends, growth factors, and opportunities
8.3.2.Market size and forecast, by manufacturing process
8.3.3.Market size and forecast, by product
8.3.4.Market size and forecast, by application
8.3.5.Market size and forecast, by grade
8.3.6.Market analysis, by country

8.3.6.1.Germany

8.3.6.1.1.Market size and forecast, by manufacturing process
8.3.6.1.2.Market size and forecast, by product
8.3.6.1.3.Market size and forecast, by application
8.3.6.1.4.Market size and forecast, by grade

8.3.6.2.France

8.3.6.2.1.Market size and forecast, by manufacturing process
8.3.6.2.2.Market size and forecast, by product
8.3.6.2.3.Market size and forecast, by application
8.3.6.2.4.Market size and forecast, by grade

8.3.6.3.Italy

8.3.6.3.1.Market size and forecast, by manufacturing process
8.3.6.3.2.Market size and forecast, by product
8.3.6.3.3.Market size and forecast, by application
8.3.6.3.4.Market size and forecast, by grade

8.3.6.4.Spain

8.3.6.4.1.Market size and forecast, by manufacturing process
8.3.6.4.2.Market size and forecast, by product
8.3.6.4.3.Market size and forecast, by application
8.3.6.4.4.Market size and forecast, by grade

8.3.6.5.UK

8.3.6.5.1.Market size and forecast, by manufacturing process
8.3.6.5.2.Market size and forecast, by product
8.3.6.5.3.Market size and forecast, by application
8.3.6.5.4.Market size and forecast, by grade

8.3.6.6.Rest of Europe

8.3.6.6.1.Market size and forecast, by manufacturing process
8.3.6.6.2.Market size and forecast, by product
8.3.6.6.3.Market size and forecast, by application
8.3.6.6.4.Market size and forecast, by grade

8.4.Asia-Pacific

8.4.1.Key market trends, growth factors, and opportunities
8.4.2.Market size and forecast, by manufacturing process
8.4.3.Market size and forecast, by product
8.4.4.Market size and forecast, by application
8.4.5.Market size and forecast, by grade
8.4.6.Market analysis, by country

8.4.6.1.China

8.4.6.1.1.Market size and forecast, by manufacturing process
8.4.6.1.2.Market size and forecast, by product
8.4.6.1.3.Market size and forecast, by application
8.4.6.1.4.Market size and forecast, by grade

8.4.6.2.Japan

8.4.6.2.1.Market size and forecast, by manufacturing process
8.4.6.2.2.Market size and forecast, by product
8.4.6.2.3.Market size and forecast, by application
8.4.6.2.4.Market size and forecast, by grade

8.4.6.3.India

8.4.6.3.1.Market size and forecast, by manufacturing process
8.4.6.3.2.Market size and forecast, by product
8.4.6.3.3.Market size and forecast, by application
8.4.6.3.4.Market size and forecast, by grade

8.4.6.4.South Korea

8.4.6.4.1.Market size and forecast, by manufacturing process
8.4.6.4.2.Market size and forecast, by product
8.4.6.4.3.Market size and forecast, by application
8.4.6.4.4.Market size and forecast, by grade

8.4.6.5.Australia

8.4.6.5.1.Market size and forecast, by manufacturing process
8.4.6.5.2.Market size and forecast, by product
8.4.6.5.3.Market size and forecast, by application
8.4.6.5.4.Market size and forecast, by grade

8.4.6.6.Rest of Asia-Pacific

8.4.6.6.1.Market size and forecast, by manufacturing process
8.4.6.6.2.Market size and forecast, by product
8.4.6.6.3.Market size and forecast, by application
8.4.6.6.4.Market size and forecast, by grade

8.5.LAMEA

8.5.1.Key market trends, growth factors, and opportunities
8.5.2.Market size and forecast, by manufacturing process
8.5.3.Market size and forecast, by product
8.5.4.Market size and forecast, by application
8.5.5.Market size and forecast, by grade
8.5.6.Market analysis, by country

8.5.6.1.Brazil

8.5.6.1.1.Market size and forecast, by manufacturing process
8.5.6.1.2.Market size and forecast, by product
8.5.6.1.3.Market size and forecast, by application
8.5.6.1.4.Market size and forecast, by grade

8.5.6.2.Saudi Arabia

8.5.6.2.1.Market size and forecast, by manufacturing process
8.5.6.2.2.Market size and forecast, by product
8.5.6.2.3.Market size and forecast, by application
8.5.6.2.4.Market size and forecast, by grade

8.5.6.3.South Africa

8.5.6.3.1.Market size and forecast, by manufacturing process
8.5.6.3.2.Market size and forecast, by product
8.5.6.3.3.Market size and forecast, by application
8.5.6.3.4.Market size and forecast, by grade

8.5.6.4.Rest of LAMEA

8.5.6.4.1.Market size and forecast, by manufacturing process
8.5.6.4.2.Market size and forecast, by product
8.5.6.4.3.Market size and forecast, by application
8.5.6.4.4.Market size and forecast, by grade

CHAPTER 9:COMPETITIVE LANDSCAPE

9.1.Introduction

9.1.1.Market player positioning, 2020

9.2.Top winning strategies

9.2.1.Top winning strategies, by year
9.2.2.Top winning strategies, by development
9.2.3.Top winning strategies, by company

9.3.Product mapping of top 10 player
9.4.Competitive dashboard
9.5.Competitive heatmap
9.6.Key developments

9.6.1.Business expansions
9.6.2.Other developments

CHAPTER 10:COMPANY PROFILES

10.1.ARCELORMITTAL SA

10.1.1.Company overview
10.1.2.Key executives
10.1.3.Company snapshot
10.1.4.Operating business segments
10.1.5.Product portfolio
10.1.6.R&D expenditure
10.1.7.Business performance
10.1.8.Key strategic moves and developments

10.2.EVRAZ NORTH AMERICA PLC

10.2.1.Company overview
10.2.2.Key executives
10.2.3.Company snapshot
10.2.4.Operating business segments
10.2.5.Product portfolio
10.2.6.Business performance

10.3.ILJIN STEEL CORPORATION

10.3.1.Company overview
10.3.2.Key executives
10.3.3.Company snapshot
10.3.4.Product portfolio

10.4.JFE STEEL CORPORATION

10.4.1.Company overview
10.4.2.Key executives
10.4.3.Company snapshot
10.4.4.Operating business segments
10.4.5.Product portfolio
10.4.6.Business performance
10.4.7.Key strategic moves and developments

10.5.NOV INC.

10.5.1.Company overview
10.5.2.Key executives
10.5.3.Company snapshot
10.5.4.Operating business segments
10.5.5.Product portfolio
10.5.6.Business performance

10.6.OIL COUNTRY TUBULAR LIMITED

10.6.1.Company overview
10.6.2.Key executives
10.6.3.Company snapshot
10.6.4.Operating business segments240
10.6.5.Product portfolio240
10.6.6.Business performance

10.7.SUMITOMO CORPORATION

10.7.1.Company overview
10.7.2.Key executives
10.7.3.Company snapshot
10.7.4.Operating business segments
10.7.5.Product portfolio
10.7.6.Business performance

10.8.TENARIS

10.8.1.Company overview
10.8.2.Key executives
10.8.3.Company snapshot
10.8.4.Operating business segments
10.8.5.Product portfolio
10.8.6.Business performance
10.8.7.Key strategic moves and developments

10.9.TMK INC.

10.9.1.Company overview
10.9.2.Key executives
10.9.3.Company snapshot
10.9.4.Operating business segments
10.9.5.Product portfolio
10.9.6.Business performance

10.10.U.S. STEEL CORPORATION

10.10.1.Company overview
10.10.2.Key executives
10.10.3.Company snapshot
10.10.4.Operating business segments
10.10.5.Product portfolio
10.10.6.Business performance
10.10.7.Key strategic moves and developments

LIST OF TABLES

TABLE 01.OIL COUNTRY TUBULAR GOODS MARKET, BY MANUFACTURING PROCESS, 2020–2030 ($MILLION) 
TABLE 02.OIL COUNTRY TUBULAR GOODS MARKET FOR ELECTRIC RESISTANCE WELDED, BY REGION, 
2020–2030 ($MILLION) 
TABLE 03.OIL COUNTRY TUBULAR GOODS MARKET FOR SEAMLESS, BY REGION, 2020–2030 ($MILLION) 
TABLE 04.OIL COUNTRY TUBULAR GOODS MARKET, BY PRODUCT, 2020–2030 ($MILLION) 
TABLE 05.OIL COUNTRY TUBULAR GOODS MARKET FOR WELL CASING, BY REGION, 2020–2030 ($MILLION) 
TABLE 06.OIL COUNTRY TUBULAR GOODS MARKET FOR PRODUCTION TUBING, BY REGION, 2020–2030 ($MILLION) 
TABLE 07.OIL COUNTRY TUBULAR GOODS MARKET FOR DRILL PIPE, BY REGION, 2020–2030 ($MILLION) 
TABLE 08.OIL COUNTRY TUBULAR GOODS MARKET FOR OTHERS, BY REGION, 2020–2030 ($MILLION) 
TABLE 09.OIL COUNTRY TUBULAR GOODS MARKET, BY APPLICATION, 2020–2030 ($MILLION) 
TABLE 10.OIL COUNTRY TUBULAR GOODS MARKET FOR ONSHORE, BY REGION, 2020–2030 ($MILLION) 
TABLE 11.OIL COUNTRY TUBULAR GOODS MARKET FOR OFFSHORE, BY REGION, 2020–2030 ($MILLION) 
TABLE 12.OIL COUNTRY TUBULAR GOODS MARKET, BY GRADE, 2020–2030 ($MILLION) 
TABLE 13.OIL COUNTRY TUBULAR GOODS MARKET FOR API GRADE, BY REGION, 2020–2030 ($MILLION) 
TABLE 14.OIL COUNTRY TUBULAR GOODS MARKET FOR PREMIUM GRADE, BY REGION, 2020–2030 ($MILLION) 
TABLE 15.OIL COUNTRY TUBULAR GOODS MARKET, BY REGION, 2020-2030 ($MILLION) 
TABLE 16.NORTH AMERICAOIL COUNTRY TUBULAR GOODS MARKET, BY MANUFACTURING PROCESS, 
2020-2030 ($MILLION) 
TABLE 17.NORTH AMERICAOIL COUNTRY TUBULAR GOODS MARKET, BY PRODUCT, 2020-2030 ($MILLION) 
TABLE 18.NORTH AMERICAOIL COUNTRY TUBULAR GOODS MARKET, BY APPLICATION, 2020-2030 ($MILLION) 
TABLE 19.NORTH AMERICAOIL COUNTRY TUBULAR GOODS MARKET, BY GRADE, 2020-2030 ($MILLION) 
TABLE 20.NORTH AMERICAOIL COUNTRY TUBULAR GOODS MARKET, BY COUNTRY, 2020-2030 ($MILLION) 
TABLE 21.U.S.OIL COUNTRY TUBULAR GOODS MARKET, BY MANUFACTURING PROCESS, 2020-2030 ($MILLION) 
TABLE 22.U.S.OIL COUNTRY TUBULAR GOODS MARKET, BY PRODUCT, 2020-2030 ($MILLION) 
TABLE 23.U.S.OIL COUNTRY TUBULAR GOODS MARKET, BY APPLICATION, 2020-2030 ($MILLION) 
TABLE 24.U.S.OIL COUNTRY TUBULAR GOODS MARKET, BY GRADE, 2020-2030 ($MILLION) 
TABLE 25.CANADA OIL COUNTRY TUBULAR GOODS MARKET, BY MANUFACTURING PROCESS, 2020-2030 ($MILLION) 
TABLE 26.CANADA OIL COUNTRY TUBULAR GOODS MARKET, BY PRODUCT, 2020-2030 ($MILLION) 
TABLE 27.CANADA OIL COUNTRY TUBULAR GOODS MARKET, BY APPLICATION, 2020-2030 ($MILLION)
TABLE 28.CANADA OIL COUNTRY TUBULAR GOODS MARKET, BY GRADE, 2020-2030 ($MILLION) 
TABLE 29.MEXICO OIL COUNTRY TUBULAR GOODS MARKET, BY MANUFACTURING PROCESS, 2020-2030 ($MILLION) 
TABLE 30.MEXICO OIL COUNTRY TUBULAR GOODS MARKET, BY PRODUCT, 2020-2030 ($MILLION) 
TABLE 31.MEXICO OIL COUNTRY TUBULAR GOODS MARKET, BY APPLICATION, 2020-2030 ($MILLION) 
TABLE 32.MEXICO OIL COUNTRY TUBULAR GOODS MARKET, BY GRADE, 2020-2030 ($MILLION) 
TABLE 33.EUROPE OIL COUNTRY TUBULAR GOODS MARKET, BY MANUFACTURING PROCESS, 2020-2030 ($MILLION) 
TABLE 34.EUROPE OIL COUNTRY TUBULAR GOODS MARKET, BY PRODUCT, 2020-2030 ($MILLION) 
TABLE 35.EUROPEOIL COUNTRY TUBULAR GOODS MARKET, BY APPLICATION, 2020-2030 ($MILLION) 
TABLE 36.EUROPEOIL COUNTRY TUBULAR GOODS MARKET, BY GRADE, 2020-2030 ($MILLION) 
TABLE 37.EUROPEOIL COUNTRY TUBULAR GOODS MARKET, BY COUNTRY, 2020-2030 ($MILLION) 
TABLE 38.GERMANY OIL COUNTRY TUBULAR GOODS MARKET, BY MANUFACTURING PROCESS, 2020-2030 ($MILLION) 
TABLE 39.GERMANY OIL COUNTRY TUBULAR GOODS MARKET, BY PRODUCT, 2020-2030 ($MILLION) 
TABLE 40.GERMANY OIL COUNTRY TUBULAR GOODS MARKET, BY APPLICATION, 2020-2030 ($MILLION) 
TABLE 41.GERMANY OIL COUNTRY TUBULAR GOODS MARKET, BY GRADE, 2020-2030 ($MILLION) 
TABLE 42.FRANCE OIL COUNTRY TUBULAR GOODS MARKET, BY MANUFACTURING PROCESS, 2020-2030 ($MILLION) 
TABLE 43.FRANCE OIL COUNTRY TUBULAR GOODS MARKET, BY PRODUCT, 2020-2030 ($MILLION) 
TABLE 44.FRANCE OIL COUNTRY TUBULAR GOODS MARKET, BY APPLICATION, 2020-2030 ($MILLION) 
TABLE 45.FRANCE OIL COUNTRY TUBULAR GOODS MARKET, BY GRADE, 2020-2030 ($MILLION) 
TABLE 46.ITALY OIL COUNTRY TUBULAR GOODS MARKET, BY MANUFACTURING PROCESS, 2020-2030 ($MILLION) 
TABLE 47.ITALY OIL COUNTRY TUBULAR GOODS MARKET, BY PRODUCT, 2020-2030 ($MILLION) 
TABLE 48.ITALY OIL COUNTRY TUBULAR GOODS MARKET, BY APPLICATION, 2020-2030 ($MILLION) 
TABLE 49.ITALY OIL COUNTRY TUBULAR GOODS MARKET, BY GRADE, 2020-2030 ($MILLION) 
TABLE 50.SPAIN OIL COUNTRY TUBULAR GOODS MARKET, BY MANUFACTURING PROCESS, 2020-2030 ($MILLION)
TABLE 51.SPAIN OIL COUNTRY TUBULAR GOODS MARKET, BY PRODUCT, 2020-2030 ($MILLION)
TABLE 52.SPAIN OIL COUNTRY TUBULAR GOODS MARKET, BY APPLICATION, 2020-2030 ($MILLION)
TABLE 53.SPAIN OIL COUNTRY TUBULAR GOODS MARKET, BY GRADE, 2020-2030 ($MILLION)
TABLE 54.UK OIL COUNTRY TUBULAR GOODS MARKET, BY MANUFACTURING PROCESS, 2020-2030 ($MILLION)
TABLE 55.UK OIL COUNTRY TUBULAR GOODS MARKET, BY PRODUCT, 2020-2030 ($MILLION)
TABLE 56.UK OIL COUNTRY TUBULAR GOODS MARKET, BY APPLICATION, 2020-2030 ($MILLION)
TABLE 57.UK OIL COUNTRY TUBULAR GOODS MARKET, BY GRADE, 2020-2030 ($MILLION)
TABLE 58.REST OF EUROPE OIL COUNTRY TUBULAR GOODS MARKET, BY MANUFACTURING PROCESS, 2020-2030 ($MILLION)
TABLE 59.REST OF EUROPE OIL COUNTRY TUBULAR GOODS MARKET, BY PRODUCT, 2020-2030 ($MILLION)
TABLE 60.REST OF EUROPE OIL COUNTRY TUBULAR GOODS MARKET, BY APPLICATION, 2020-2030 ($MILLION)
TABLE 61.REST OF EUROPE OIL COUNTRY TUBULAR GOODS MARKET, BY GRADE, 2020-2030 ($MILLION)
TABLE 62.ASIA-PACIFIC OIL COUNTRY TUBULAR GOODS MARKET, BY MANUFACTURING PROCESS, 2020-2030 ($MILLION)
TABLE 63.ASIA-PACIFIC OIL COUNTRY TUBULAR GOODS MARKET, BY PRODUCT, 2020-2030 ($MILLION)
TABLE 64.ASIA-PACIFIC OIL COUNTRY TUBULAR GOODS MARKET, BY APPLICATION, 2020-2030 ($MILLION)
TABLE 65.ASIA-PACIFIC OIL COUNTRY TUBULAR GOODS MARKET, BY GRADE, 2020-2030 ($MILLION)
TABLE 66.ASIA-PACFICOIL COUNTRY TUBULAR GOODS MARKET, BY COUNTRY, 2020-2030 ($MILLION)
TABLE 67.CHINAOIL COUNTRY TUBULAR GOODS MARKET, BY MANUFACTURING PROCESS, 2020-2030 ($MILLION)
TABLE 68.CHINAOIL COUNTRY TUBULAR GOODS MARKET, BY PRODUCT, 2020-2030 ($MILLION)
TABLE 69.CHINA OIL COUNTRY TUBULAR GOODS MARKET, BY APPLICATION, 2020-2030 ($MILLION)
TABLE 70.CHINAOIL COUNTRY TUBULAR GOODS MARKET, BY GRADE, 2020-2030 ($MILLION)
TABLE 71.JAPANOIL COUNTRY TUBULAR GOODS MARKET, BY MANUFACTURING PROCESS, 2020-2030 ($MILLION)
TABLE 72.JAPANOIL COUNTRY TUBULAR GOODS MARKET, BY PRODUCT, 2020-2030 ($MILLION)
TABLE 73.JAPAN OIL COUNTRY TUBULAR GOODS MARKET, BY APPLICATION, 2020-2030 ($MILLION)
TABLE 74.JAPANOIL COUNTRY TUBULAR GOODS MARKET, BY GRADE, 2020-2030 ($MILLION)
TABLE 75.INDIAOIL COUNTRY TUBULAR GOODS MARKET, BY MANUFACTURING PROCESS, 2020-2030 ($MILLION)
TABLE 76.INDIAOIL COUNTRY TUBULAR GOODS MARKET, BY PRODUCT, 2020-2030 ($MILLION)
TABLE 77.INDIA OIL COUNTRY TUBULAR GOODS MARKET, BY APPLICATION, 2020-2030 ($MILLION)
TABLE 78.INDIAOIL COUNTRY TUBULAR GOODS MARKET, BY GRADE, 2020-2030 ($MILLION)
TABLE 79.SOUTH KOREAOIL COUNTRY TUBULAR GOODS MARKET, BY MANUFACTURING PROCESS, 2020-2030 ($MILLION)
TABLE 80.SOUTH KOREAOIL COUNTRY TUBULAR GOODS MARKET, BY PRODUCT, 2020-2030 ($MILLION)
TABLE 81.SOUTH KOREA OIL COUNTRY TUBULAR GOODS MARKET, BY APPLICATION, 2020-2030 ($MILLION)
TABLE 82.SOUTH KOREAOIL COUNTRY TUBULAR GOODS MARKET, BY GRADE, 2020-2030 ($MILLION)
TABLE 83.AUSTRALIAOIL COUNTRY TUBULAR GOODS MARKET, BY MANUFACTURING PROCESS, 2020-2030 ($MILLION)
TABLE 84.AUSTRALIAOIL COUNTRY TUBULAR GOODS MARKET, BY PRODUCT, 2020-2030 ($MILLION)
TABLE 85.AUSTRALIA OIL COUNTRY TUBULAR GOODS MARKET, BY APPLICATION, 2020-2030 ($MILLION)
TABLE 86.AUSTRALIAOIL COUNTRY TUBULAR GOODS MARKET, BY GRADE, 2020-2030 ($MILLION)
TABLE 87.REST OF ASIA-PACIFICOIL COUNTRY TUBULAR GOODS MARKET, BY MANUFACTURING PROCESS,  2020-2030 ($MILLION)
TABLE 88.REST OF ASIA-PACIFICOIL COUNTRY TUBULAR GOODS MARKET, BY PRODUCT, 2020-2030 ($MILLION)
TABLE 89.REST OF ASIA-PACIFIC OIL COUNTRY TUBULAR GOODS MARKET, BY APPLICATION, 2020-2030 ($MILLION)
TABLE 90.REST OF ASIA-PACIFICOIL COUNTRY TUBULAR GOODS MARKET, BY GRADE, 2020-2030 ($MILLION)
TABLE 91.LAMEAOIL COUNTRY TUBULAR GOODS MARKET, BY MANUFACTURING PROCESS, 2020-2030 ($MILLION)
TABLE 92.LAMEAOIL COUNTRY TUBULAR GOODS MARKET, BY PRODUCT, 2020-2030 ($MILLION)
TABLE 93.LAMEAOIL COUNTRY TUBULAR GOODS MARKET, BY APPLICATION, 2020-2030 ($MILLION)
TABLE 94.LAMEAOIL COUNTRY TUBULAR GOODS MARKET, BY GRADE, 2020-2030 ($MILLION)
TABLE 95.LAMEAOIL COUNTRY TUBULAR GOODS MARKET, BY COUNTRY, 2020-2030 ($MILLION)
TABLE 96.BRAZILOIL COUNTRY TUBULAR GOODS MARKET, BY MANUFACTURING PROCESS, 2020-2030 ($MILLION)
TABLE 97.BRAZILOIL COUNTRY TUBULAR GOODS MARKET, BY PRODUCT, 2020-2030 ($MILLION)
TABLE 98.BRAZIL OIL COUNTRY TUBULAR GOODS MARKET, BY APPLICATION, 2020-2030 ($MILLION)
TABLE 99.BRAZILOIL COUNTRY TUBULAR GOODS MARKET, BY GRADE, 2020-2030 ($MILLION)
TABLE 100.SAUDI ARABIAOIL COUNTRY TUBULAR GOODS MARKET, BY MANUFACTURING PROCESS, 
2020-2030 ($MILLION)
TABLE 101.SAUDI ARABIAOIL COUNTRY TUBULAR GOODS MARKET, BY PRODUCT, 2020-2030 ($MILLION)
TABLE 102.SAUDI ARABIA OIL COUNTRY TUBULAR GOODS MARKET, BY APPLICATION, 2020-2030 ($MILLION)
TABLE 103.SAUDI ARABIAOIL COUNTRY TUBULAR GOODS MARKET, BY GRADE, 2020-2030 ($MILLION)
TABLE 104.SOUTH AFRICAOIL COUNTRY TUBULAR GOODS MARKET, BY MANUFACTURING PROCESS, 
2020-2030 ($MILLION)
TABLE 105.SOUTH AFRICAOIL COUNTRY TUBULAR GOODS MARKET, BY PRODUCT, 2020-2030 ($MILLION)
TABLE 106.SOUTH AFRICA OIL COUNTRY TUBULAR GOODS MARKET, BY APPLICATION, 2020-2030 ($MILLION)
TABLE 107.SOUTH AFRICAOIL COUNTRY TUBULAR GOODS MARKET, BY GRADE, 2020-2030 ($MILLION)
TABLE 108.REST OF LAMEAOIL COUNTRY TUBULAR GOODS MARKET, BY MANUFACTURING PROCESS, 
2020-2030 ($MILLION)
TABLE 109.REST OF LAMEAOIL COUNTRY TUBULAR GOODS MARKET, BY PRODUCT, 2020-2030 ($MILLION)
TABLE 110.REST OF LAMEA OIL COUNTRY TUBULAR GOODS MARKET, BY APPLICATION, 2020-2030 ($MILLION)202
TABLE 111.REST OF LAMEAOIL COUNTRY TUBULAR GOODS MARKET, BY GRADE, 2020-2030 ($MILLION) 
TABLE 112.OTHER KEY DEVELOPMENTS (2018-2021) 
TABLE 113.ARCELORMITTAL SA: KEY EXECUTIVES
TABLE 114.ARCELORMITTAL SA: COMPANY SNAPSHOT
TABLE 115.ARCELORMITTAL SA: OPERATING SEGMENTS
TABLE 116.ARCELORMITTAL SA: PRODUCT PORTFOLIO
TABLE 117.ARCELORMITTAL SA: R&D EXPENDITURE, 2018–2020 ($MILLION)
TABLE 118.ARCELORMITTAL SA: NET SALES, 2018–2020 ($MILLION)
TABLE 119.EVRAZ NORTH AMERICA PLC: KEY EXECUTIVES
TABLE 120.EVRAZ NORTH AMERICA PLC: COMPANY SNAPSHOT
TABLE 121.EVRAZ NORTH AMERICA PLC: OPERATING SEGMENTS
TABLE 122.EVRAZ NORTH AMERICA PLC: PRODUCT PORTFOLIO
TABLE 123.EVRAZ NORTH AMERICA PLC: NET SALES, 2018–2020 ($MILLION)
TABLE 124.ILJIN STEEL CORPORATION: KEY EXECUTIVES
TABLE 125.ILJIN STEEL CORPORATION: COMPANY SNAPSHOT
TABLE 126.ILJIN STEEL CORPORATION: PRODUCT PORTFOLIO
TABLE 127.JFE STEEL CORPORATION: KEY EXECUTIVES
TABLE 128.JFE STEEL CORPORATION: COMPANY SNAPSHOT
TABLE 129.JFE STEEL CORPORATION: OPERATING SEGMENTS
TABLE 130.JFE STEEL CORPORATION: PRODUCT PORTFOLIO
TABLE 131.JFE STEEL CORPORATION: NET SALES, 2018–2020 ($MILLION)
TABLE 132.NOV INC.: KEY EXECUTIVES
TABLE 133.NOV INC.: COMPANY SNAPSHOT
TABLE 134.NOV INC.: OPERATING SEGMENTS
TABLE 135.NOV INC.: PRODUCT PORTFOLIO
TABLE 136.NOV INC.: NET SALES, 2018–2020 ($MILLION)
TABLE 137.OIL COUNTRY TUBULAR LIMITED: KEY EXECUTIVES
TABLE 138.OIL COUNTRY TUBULAR LIMITED: COMPANY SNAPSHOT
TABLE 139.OIL COUNTRY TUBULAR LIMITED: OPERATING SEGMENTS
TABLE 140.OIL COUNTRY TUBULAR LIMITED: PRODUCT PORTFOLIO
TABLE 141.OIL COUNTRY TUBULAR LIMITED: NET SALES, 2018–2020 ($MILLION)
TABLE 142.SUMITOMO CORPORATION: KEY EXECUTIVES
TABLE 143.SUMITOMO CORPORATION: COMPANY SNAPSHOT
TABLE 144.SUMITOMO CORPORATION: OPERATING SEGMENTS
TABLE 145.SUMITOMO CORPORATION: PRODUCT PORTFOLIO
TABLE 146.SUMITOMO CORPORATION: NET SALES, 2018–2020 ($MILLION)
TABLE 147.TENARIS: KEY EXECUTIVES
TABLE 148.TENARIS: COMPANY SNAPSHOT
TABLE 149.TENARIS: OPERATING SEGMENTS
TABLE 150.TENARIS: PRODUCT PORTFOLIO
TABLE 151.TENARIS: NET SALES, 2018–2020 ($MILLION)
TABLE 152.TMK INC.: KEY EXECUTIVES
TABLE 153.TMK INC.: COMPANY SNAPSHOT
TABLE 154.TMK INC.: OPERATING SEGMENTS
TABLE 155.TMK INC.: PRODUCT PORTFOLIO
TABLE 156.TMK INC.: NET SALES, 2018–2020 ($MILLION)
TABLE 157.U.S. STEEL CORPORATION: KEY EXECUTIVES
TABLE 158.U.S. STEEL CORPORATION: COMPANY SNAPSHOT
TABLE 159.U.S. STEEL CORPORATION: OPERATING SEGMENTS
TABLE 160.U.S. STEEL CORPORATION: PRODUCT PORTFOLIO
TABLE 161.U.S. STEEL CORPORATION: NET SALES, 2018–2020 ($MILLION)

LIST OF FIGURES

FIGURE 01.GLOBAL OIL COUNTRY TUBULAR GOODS MARKET SNAPSHOT
FIGURE 02.GLOBAL OIL COUNTRY TUBULAR GOODS MARKET SNAPSHOT
FIGURE 03.GLOBAL OIL COUNTRY TUBULAR GOODS MARKET SEGMENTATION
FIGURE 04.TOP INVESTMENT POCKETS
FIGURE 05.MODERATE BARGAINING POWER OF SUPPLIERS
FIGURE 06.HIGH BARGAINING POWER OF BUYERS
FIGURE 07.MODERATE THREAT OF NEW ENTRANTS
FIGURE 08.HIGH THREAT OF SUBSTITUTES
FIGURE 09.COMPETITIVE RIVALRY
FIGURE 10.GLOBAL OIL COUNTRY TUBULAR GOODS MARKET DYNAMICS
FIGURE 11.VALUE CHAIN ANALYSIS
FIGURE 12.GLOBAL OIL COUNTRY TUBULAR GOODS MARKET, BY MANUFACTURING PROCESS, 2021–2030 ($MILLION) 
FIGURE 13.COMPARATIVE ANALYSIS OFOIL COUNTRY TUBULAR GOODS MARKET FOR ELECTRIC RESISTANCE WELDED, BY COUNTRY, 2021 & 2030 ($MILLION) 
FIGURE 14.COMPARATIVE ANALYSIS OFOIL COUNTRY TUBULAR GOODS MARKET FOR SEAMLESS, 
BY COUNTRY, 2021 & 2030 ($MILLION) 
FIGURE 15.OIL COUNTRY TUBULAR GOODS MARKET, BY PRODUCT, 2021–2030 ($MILLION) 
FIGURE 16.COMPARATIVE ANALYSIS OFOIL COUNTRY TUBULAR GOODS MARKET FOR WELL CASING, 
BY COUNTRY, 2021 & 2030 ($MILLION) 
FIGURE 17.COMPARATIVE ANALYSIS OFOIL COUNTRY TUBULAR GOODS MARKET FOR PRODUCTION TUBING, BY COUNTRY, 2021 & 2030 ($MILLION) 
FIGURE 18.COMPARATIVE ANALYSIS OFOIL COUNTRY TUBULAR GOODS MARKET FOR DRILL PIPE, 
BY COUNTRY, 2021 & 2030 ($MILLION) 
FIGURE 19.COMPARATIVE ANALYSIS OFOIL COUNTRY TUBULAR GOODS MARKET FOR OTHERS, BY COUNTRY, 2021 & 2030 ($MILLION) 
FIGURE 20.GLOBAL OIL COUNTRY TUBULAR GOODS MARKET, BY APPLICATION, 2021–2030 ($MILLION) 
FIGURE 21.COMPARATIVE ANALYSIS OFOIL COUNTRY TUBULAR GOODS MARKET FOR ONSHORE, BY COUNTRY, 2021 & 2030 ($MILLION) 
FIGURE 22.COMPARATIVE ANALYSIS OFOIL COUNTRY TUBULAR GOODS MARKET FOR OFFSHORE, 
BY COUNTRY, 2021 & 2030 ($MILLION) 
FIGURE 23.GLOBAL OIL COUNTRY TUBULAR GOODS MARKET, BY GRADE, 2021–2030 ($MILLION) 
FIGURE 24.COMPARATIVE ANALYSIS OFOIL COUNTRY TUBULAR GOODS MARKET FOR API GRADE, 
BY COUNTRY, 2021 & 2030 ($MILLION) 
FIGURE 25.COMPARATIVE ANALYSIS OFOIL COUNTRY TUBULAR GOODS MARKET FOR PREMIUM GRADE, 
BY COUNTRY, 2021 & 2030 ($MILLION) 
FIGURE 26.U.S.OIL COUNTRY TUBULAR GOODS MARKET REVENUE, 2020–2030 ($MILLION) 
FIGURE 27.CANADAOIL COUNTRY TUBULAR GOODS MARKET REVENUE, 2020–2030 ($MILLION) 
FIGURE 28.MEXICOOIL COUNTRY TUBULAR GOODS MARKET REVENUE, 2020–2030 ($MILLION) 
FIGURE 29.GERMANYOIL COUNTRY TUBULAR GOODS MARKET REVENUE, 2020–2030 ($MILLION) 
FIGURE 30.FRANCEOIL COUNTRY TUBULAR GOODS MARKET REVENUE, 2020–2030 ($MILLION) 
FIGURE 31.ITALYOIL COUNTRY TUBULAR GOODS MARKET REVENUE, 2020–2030 ($MILLION) 
FIGURE 32.SPAINOIL COUNTRY TUBULAR GOODS MARKET REVENUE, 2020–2030 ($MILLION) 
FIGURE 33.UKOIL COUNTRY TUBULAR GOODS MARKET REVENUE, 2020–2030 ($MILLION)
FIGURE 34.REST OF EUROPEOIL COUNTRY TUBULAR GOODS MARKET REVENUE, 2020–2030 ($MILLION)
FIGURE 35.CHINAOIL COUNTRY TUBULAR GOODS MARKET REVENUE, 2020–2030 ($MILLION)
FIGURE 36.JAPANOIL COUNTRY TUBULAR GOODS MARKET REVENUE, 2020–2030 ($MILLION)
FIGURE 37.INDIAOIL COUNTRY TUBULAR GOODS MARKET REVENUE, 2020–2030 ($MILLION)
FIGURE 38.SOUTH KOREAOIL COUNTRY TUBULAR GOODS MARKET REVENUE, 2020–2030 ($MILLION)
FIGURE 39.AUSTRALIA OIL COUNTRY TUBULAR GOODS MARKET REVENUE, 2020–2030 ($MILLION)
FIGURE 40.REST OF ASIA-PACIFICOIL COUNTRY TUBULAR GOODS MARKET REVENUE, 2020–2030 ($MILLION)
FIGURE 41.BRAZILOIL COUNTRY TUBULAR GOODS MARKET REVENUE, 2020–2030 ($MILLION)
FIGURE 42.SAUDI ARABIAOIL COUNTRY TUBULAR GOODS MARKET REVENUE, 2020–2030 ($MILLION)
FIGURE 43.SOUTH AFRICAOIL COUNTRY TUBULAR GOODS MARKET REVENUE, 2020–2030 ($MILLION)
FIGURE 44.REST OF LAMEAOIL COUNTRY TUBULAR GOODS MARKET REVENUE, 2020–2030 ($MILLION)
FIGURE 45.MARKET PLAYER POSITIONING, 2020
FIGURE 46.TOP WINNING STRATEGIES, BY YEAR, 2019–2021
FIGURE 47.TOP WINNING STRATEGIES, BY DEVELOPMENT, 2019–2021 (%)
FIGURE 48.TOP WINNING STRATEGIES, BY COMPANY, 2019–2021
FIGURE 49.PRODUCT MAPPING OF TOP 10 PLAYERS
FIGURE 50.COMPETITIVE DASHBOARD
FIGURE 51.COMPETITIVE HEATMAP OF KEY PLAYERS
FIGURE 52.ARCELORMITTAL SA: R&D EXPENDITURE, 2018–2020 ($MILLION)
FIGURE 53.ARCELORMITTAL SA: NET SALES, 2018–2020 ($MILLION)
FIGURE 54.ARCELORMITTAL SA: REVENUE SHARE BY SEGMENT, 2020 (%)
FIGURE 55.ARCELORMITTAL SA: REVENUE SHARE BY REGION, 2020 (%)
FIGURE 56.EVRAZ NORTH AMERICA PLC: NET SALES, 2018–2020 ($MILLION)
FIGURE 57.EVRAZ NORTH AMERICA PLC: REVENUE SHARE BY SEGMENT, 2020 (%)
FIGURE 58.EVRAZ NORTH AMERICA PLC: REVENUE SHARE BY REGION, 2020 (%)
FIGURE 59.JFE STEEL CORPORATION: NET SALES, 2018–2020 ($MILLION)
FIGURE 60.JFE STEEL CORPORATION: REVENUE SHARE BY SEGMENT, 2020 (%)
FIGURE 61.NOV INC.: NET SALES, 2018–2020 ($MILLION)
FIGURE 62.NOV INC.: REVENUE SHARE BY SEGMENT, 2020 (%)
FIGURE 63.NOV INC.: REVENUE SHARE BY REGION, 2020 (%)
FIGURE 64.OIL COUNTRY TUBULAR LIMITED: NET SALES, 2018–2020 ($MILLION)
FIGURE 65.OIL COUNTRY TUBULAR LIMITED: REVENUE SHARE BY SEGMENT, 2020 (%)
FIGURE 66.SUMITOMO CORPORATION: NET SALES, 2018–2020 ($MILLION)
FIGURE 67.SUMITOMO CORPORATION: REVENUE SHARE BY SEGMENT, 2020 (%)
FIGURE 68.SUMITOMO CORPORATION: REVENUE SHARE BY REGION, 2020 (%)
FIGURE 69.TENARIS: NET SALES, 2018–2020 ($MILLION)
FIGURE 70.TENARIS: REVENUE SHARE BY SEGMENT, 2020 (%)
FIGURE 71.TENARIS: REVENUE SHARE BY REGION, 2020 (%)
FIGURE 72.TMK INC.: NET SALES, 2018–2020 ($MILLION)
FIGURE 73.TMK INC.: REVENUE SHARE BY SEGMENT, 2020 (%)
FIGURE 74.TMK INC.: REVENUE SHARE BY REGION, 2020 (%)
FIGURE 75.U.S. STEEL CORPORATION: NET SALES, 2018–2020 ($MILLION)
FIGURE 76.U.S. STEEL CORPORATION: REVENUE SHARE BY SEGMENT, 2020 (%)
FIGURE 77.U.S. STEEL CORPORATION: REVENUE SHARE BY REGION, 2020 (%)


The global Oil Country Tubular Goods market is expected to witness increased demand during the forecast period due to rapidly growing offshore rig counts and the government initiatives to reduce the import of hydrocarbons while investing in the development of conventional and unconventional resources in the territory.

Oil and gas are important part of the economic growth of any nation and the world. The derivatives of the crude oil are immensely used in varied industries such as transportation, power generation, production of chemicals, and other processes. The increase in the consumption of oil and gas has resulted in increased exploration and production activities. The major firms and governments across the globe are consistently investing in the extraction of oil and gas. Drilling and transportation of the extracted oil and gas have led to the innovation and development of the oil country tubular goods manufacturers, which is a consolidation of different steel tubular products such as well casing, production tubing, drill pipe of various sizes and grades.

Appropriate oil country tubular goods selection during drilling activities save cost and reduces the risk of generating various accidents. The increase in innovation in regards with the efficiency and developments in well-drilling technology to improve the recoverability of the oil and gas resources is another factor boosting the market growth. The increase in the rig count in recent years have created significant trend for the growth of the oil country tubular goods market.

The increase in environmental awareness among the people regarding the effect of oil and gas has led to decline in the application of fossil fuels in automotive industry. The international political and economic stability with technology sanctions from the developed countries to the developing countries have limited the market expansion.

PURCHASE OPTIONS

Call or Email us

U.S.-Canada Toll-free: +1-800-792-5285
Int'l : +1-503-894-6022
Europe : +44-845-528-1300
Email : help@alliedmarketresearch.com
 
FREQUENTLY ASKED QUESTIONS?

A. Onshore and Offshore oil and natural gas industries are the potential customers of Oil Country Tubular Goods industry.

A. Acquisition and Joint Venture are the key growth strategy for Oil Country Tubular Goods market players in order to attract the end users.

A. To get latest version of Oil Country Tubular Goods market report can be obtained on demand from the website.

A. Increase in the drilling & exploration activities, innovation of new technologically advanced pipes and growing global offshore rig count with the depletion of onshore resources is a major driving factor and opportunity for the growth of Oil Country Tubular Goods market.

A. North America will provide more business opportunities for Oil Country Tubular Goods in future.

A. The top ten market players are selected based on two key attributes - competitive strength and market positioning

A. ArcelorMittal SA, EVRAZ North America, ILJIN Steel Corporation, JFE Steel Corporation. National-Oilwell Varco Inc, Oil Country Tubular Limited, Sumitomo Corporation, Tenaris, TMK Ipsco Enterprises Inc., and U.S. Steel Corporation.

A. Electric Resistance Welded segment holds the maximum share of the Oil Country Tubular Goods market.

A. Onshore and Offshore exploration and extraction facilities are key applications expected to drive the adoption of Oil Country Tubular Goods.

A. The report includes the detailed study of the market with respective to the growth prospects and restrains based on the regional analysis. In addition to this, the market report is analysed and estimated in accordance with the impacts of the driving factors, restraints and opportunities.

Looking for Customization?

 Customization Request

Have a Question?

 Speak with Analyst

Any Confusion?

 Inquire Before Buying

Have a glance of the Report

  Request Sample
RELATED TAGS

Purchase Full Report of
Oil Country Tubular Goods Market

Start reading instantly.
This Report and over 67,132+ more Reports, Available with Avenue Library. T&C*.

  • Online Only
  • $3,712
  • Online cloud access only
  • Restricted print, copy, paste & download
  • Read only
  • Free industry update
    (Within 180 days)
  • Free report update in next update cycle
    (Jan 2023 - Jan 2024)
  • Data Pack
  • $4,125
  • Restricted to one authorized user
  • One print only
  • Available in
    Excel
  • Free industry update
    (Within 180 days)
  •   Free report update in next update cycle
    (Jan 2023 - Jan 2024)
  • Single User
  • $5,769
  • Restricted to one authorized user
  • One print only
  • Available in
    PDF
  • Free industry update
    (Within 180 days)
  •   Free report update in next update cycle
    (Jan 2023 - Jan 2024)
  • Five Users
  • $6,929
  • Limited to five authorized users
  • Print upto five copies
  • Available in
    PDF
  • Free industry update
    (Within 180 days)
  •   Free report update in next update cycle
    (Jan 2023 - Jan 2024)
  • Enterprise
    License/PDF

  • $10,663
  • Unlimited
    within
    company/enterprise
  • Available in Excel & PDF
  • Free industry update
    (Within 180 days)
  •   Free report update in next update cycle
    (Jan 2023 - Jan 2024)
  • Library
    Membership

  • $999 $ 1,175
    Per User/ Per month/ Billed annually
  • Published Content
    E-access
  • Company Profiles
    E-access
  • Newly Added Content Access
  • 10 PDF
    Downloads
  • 5 Excel Data
    Pack Downloads
  • 250 Company Profiles PDF Downloads
  • Buy Now

*Taxes/Fees, if applicable will be added during checkout. All prices in USD

RELATED REPORTS
 

Why Allied Market Research?


Infallible Methodology

To ensure high-level data integrity, accurate analysis, and impeccable forecasts

Analyst Support

For complete satisfaction

Customization

On-demand customization of scope of the report to exactly meet your needs

TARGETED MARKET VIEW

Targeted market view to provide pertinent information and save time of readers

Get fresh content delivered

Get insights on topics that are crucial for your business. Stay abreast of your interest areas.

Get Industry Data Alerts

Why Allied Market Research?

Infallible Methodology

To ensure high-level data integrity, accurate analysis, and impeccable forecasts

Analyst Support

For complete satisfaction

Customization

On-demand customization of scope of the report to exactly meet your needs

TARGETED MARKET VIEW

Targeted market view to provide pertinent information and save time of readers