
Ophthalmology Devices Market Overview
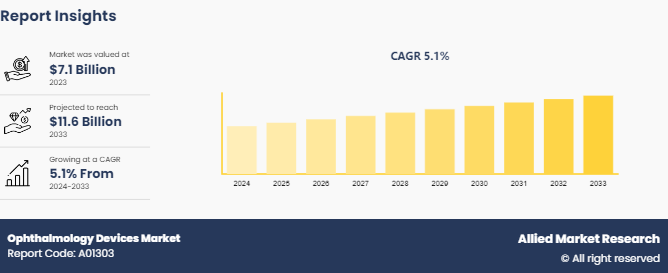
The global ophthalmology devices market was valued at $7.1 billion in 2023, and is projected to reach $11.6 billion by 2033, growing at a CAGR of 5.1% from 2024 to 2033. The growth of the ophthalmology devices market is driven by the rising prevalence of eye disorders such as cataracts, glaucoma, and age-related macular degeneration, especially among the aging population. Increasing demand for minimally invasive surgeries, advancements in diagnostic and surgical technologies, and greater awareness of early detection and treatment are also fueling market expansion.
Market Size & Future Outlook
- 2023 Market Size: $7.1 Billion
- 2033 Projected Market Size: $11.63 Billion
- CAGR (2024-2033): 5.06%
- North America: Largest market in 2023
- Asia Pacific: Fastest growing market
The major factors driving the growth of the ophthalmology devices market are increase in prevalence of eye diseases such as cataracts and age-related macular degeneration, and technological advancements, including innovations in laser surgery and imaging systems. In addition, the rise in geriatric population, surge in awareness of eye health, and development of healthcare infrastructure drive the growth of the market.
What is Meant by Ophthalmology Devices
Ophthalmology devices play a crucial role in both surgical procedures and diagnostic practices, addressing a range of eye conditions and diseases. Ophthalmic devices are specialized medical instruments used for diagnosing, treating, and managing various eye conditions and diseases. These devices range from diagnostic tools like ophthalmoscopes and slit lamps, which allow ophthalmologists to examine the internal structures of the eye, to therapeutic instruments such as lasers and surgical equipment used in procedures for correcting vision or treating conditions like glaucoma, cataracts, and retinal disorders. In addition, ophthalmic devices include optical coherence tomography (OCT) systems, which provide detailed imaging of the retina, and automated visual field analyzers that assess a patient's peripheral vision.
Key Takeaways
- The Ophthalmology Devices market share study covers 20 countries. The research includes a segment analysis of each country in terms of value for the projected period.
- More than 1, 500 product literatures, industry releases, annual reports, and other such documents of major Ophthalmology Devices industry participants along with authentic industry journals, trade associations' releases, and government websites have been reviewed for generating high-value industry insights.
- The study integrated high-quality data, professional opinions and analysis, and critical independent perspectives. The research approach is intended to provide a balanced view of global markets and assist stakeholders in making educated decisions to achieve their most ambitious growth objectives.
Key Market Dynamics
According to ophthalmology devices market forecast analysis the key factors driving the growth of the market are rise in geriatric population, rise in prevalence of eye diseases, technological advancements, and growing awareness about ophthalmic disorders and access to eye care. According to 2024 article by World Health Organization the global geriatric population is expected to increase by 110% from 2019 to 2050. As people age, they become more susceptible to various ophthalmic disorders such as cataracts, macular degeneration, glaucoma, and diabetic retinopathy. These conditions often necessitate advanced diagnostic and therapeutic devices to manage and treat them effectively. With the global population of individuals aged 65 and older expanding rapidly, there is a rising demand for ophthalmology devices that can address these age-related visual impairments. This demographic shift is driving innovation and growth in the market, as healthcare providers and medical device manufacturers focus on developing and delivering technologies tailored to the needs of older patients. Thus, the rise in geriatric population is expected to drive the ophthalmology devices market growth.
According to ophthalmology devices, market analysis technological advancement is expected to contribute to market growth. In April 2023, Johnson & Johnson Vision, a global leader in eye health and part of Johnson & Johnson MedTech, announced that its new ELITA femtosecond laser has received FDA 510 (k) clearance for the creation of LASIK flaps. The ELITA laser's ability to deliver highly accurate and consistent results enhances patient outcomes and broadens the scope of LASIK's applicability. By improving the safety and effectiveness of eye surgeries, this innovation not only boosts patient confidence but also expands the market for ophthalmology devices. Thus, technological advancement is expected to drive the growth of ophthalmology devices market size.
Growing Prevalence of Ophthalmic Disorders
The rise in the prevalence of glaucoma and age-related macular degeneration (AMD) is a significant driver for the ophthalmology devices market. Both conditions are becoming increasingly common due to the global aging population. Glaucoma, a group of eye conditions that damage the optic nerve and can lead to vision loss, is particularly prevalent among older adults. Similarly, age-related macular degeneration, a leading cause of vision loss in people over 50, affects the central part of the retina, causing severe impairment in vision. As these conditions become more widespread, there is a growing demand for advanced diagnostic and therapeutic devices. This trend is driving innovation and investment in ophthalmology technologies, including imaging systems, laser devices, and surgical instruments. The increased incidence of these conditions creates a substantial market opportunity for companies specializing in ophthalmic devices, as healthcare providers seek to enhance early detection, improve treatment outcomes, and manage the growing patient population.

Ophthalmology Devices Market Segmentation Overview
The ophthalmology devices market is segmented on the basis of device, application and end user, and region. By device, the market is classified into surgical devices and diagnostic and monitoring devices. By application, the market is divided into glaucoma, vitreoretinal disorders, cataract, and refractor disorders. By end user, it is segregated into hospitals and eye clinics, academic and research laboratories, and others. Region wise, the market is analyzed across North America, Europe, Asia-Pacific, and LAMEA.
Regional/Country Market Outlook
North America dominated the ophthalmology devices market share in 2023. This is attributed to advanced healthcare facilities with state-of-the-art technology, high prevalence of eye diseases such as age-related macular degeneration (AMD) , diabetic retinopathy, and glaucoma, and strong presence of major key players. However, according to ophthalmology devices market opportunity analysis, the Asia-Pacific region is expected to register significant growth in the forecast period owing to growing geriatric population, developing healthcare infrastructure, and growing medical device industry in the region.
- According to 2023 article by United Nations Sexual and Reproductive Health Agency, the elderly population of India is 153 million (aged 60 and above) as of 2023 and is expected to reach a staggering 347 million by 2050.
- According to a 2022 article by the American Academy of Ophthalmology, cataracts affect more than 20.5 million Americans aged 40 and older, and 6.1 million Americans have had cataract surgery.
- According to a 2023 article by the National Library of Medicine, approximately one-third of the adult UK population have dry eye disease (DED) .
Industry Trends
- According to 2024 article by World Health Organization the global geriatric population is expected to increase by 40% from 2019 to 2030.
- According to the World Health Organization, March 2022, update, trachoma is a public health problem in 44 countries and is responsible for the blindness or visual impairment of about 1.9 million people globally.
- According to a 2021 article by the World Health Organization (WHO) , at least 2.2 billion individuals worldwide have near or farsighted vision impairment.
- According to 2024 article by Center of Disease Control and Prevention, about 3 million Americans have glaucoma, and glaucoma is the second leading cause of blindness worldwide.
Competitive Landscape
The major players operating in the ophthalmology devices market include Johnson & Johnson, Alcon Vision LLC, Carl Zeiss Meditec AG, Bausch & Lomb Incorporated, Essilor International S.A, Ziemer Ophthalmic Systems Ltd, Nidek Co. Ltd, Topcon Corporation, Haag-Streit Group and Canon Medical Systems.
What are the Recent Key Strategies and Developments
- In August 2023, Johnson & Johnson announced the launch of Elita laser correction device. This platform offers a revolutionary way to correct short-sightedness through a minimally invasive laser-assisted lens removal procedure.
- In July 2023, Alkem Laboratories announced its entry into the Ophthalmology field with the launch of a massive portfolio of quality and affordable eye care products. This launch of Alkem’s ophthalmic product confirms that patients in India have access to quality eye care formulations at an affordable price
- In June 2023, Bausch + Lomb Corporation launched INFUSE Multifocal silicone hydrogel (SiHy) daily disposable contact lenses across the U.S. These new daily disposable lenses keep patient’s eyes comfortable and dry-free.
- In April 2023, Bausch + Lomb launched the TotalVisc viscoelastic system and StableVisc cohesive ophthalmic viscosurgical device. These products offer eye surgeons with novel options for dual-action protection during cataract surgery. This strategy helped in expanding its product portfolio.
- In August 2022, Glaukos Corporation received 510 (k) clearance from the United States Food and Drug Administration (FDA) for the iStent infinite. It is a trabecular micro-bypass system indicated for use in a standalone procedure to reduce elevated intraocular pressure (IOP) in patients with primary open-angle glaucoma uncontrolled by prior medical and surgical therapy.
- In July 2022, AbbVie and iSTAR Medical SA entered a strategic partnership to further develop and commercialize iSTAR Medical's MINIject device. It is a minimally invasive glaucoma surgical (MIGS) device for patients with glaucoma.
What are the Key Benefits for Stakeholders
- This report provides a quantitative analysis of the market segments, current trends, estimations, and dynamics of the ophthalmology devices market analysis from 2024 to 2033 to identify the prevailing ophthalmology devices market opportunities.
- The market research is offered along with information related to key drivers, restraints, and opportunities.
- Porter's five forces analysis highlights the potency of buyers and suppliers to enable stakeholders make profit-oriented business decisions and strengthen their supplier-buyer network.
- In-depth analysis of the ophthalmology devices market segmentation assists to determine the prevailing market opportunities.
- Major countries in each region are mapped according to their revenue contribution to the global market.
- Market player positioning facilitates benchmarking and provides a clear understanding of the present position of the market players.
- The report includes the analysis of the regional as well as global ophthalmology devices market trends, key players, market segments, application areas, and market growth strategies.
Ophthalmology Devices Market Report Highlights
| Aspects | Details |
| Market Size By 2033 | USD 11.6 Billion |
| Growth Rate | CAGR of 5.1% |
| Forecast period | 2024 - 2033 |
| Report Pages | 280 |
| By Devices |
|
| By Application |
|
| By End User |
|
| By Region |
|
| Key Market Players | Ziemer Ophthalmic Systems Ltd, Essilor International S.A, HAAG-STREIT GROUP AG, TOPCON CORPORATION, Alcon Vision LLC, Johnson & Johnson, Carl Zeiss Meditec AG, Canon Medical Systems Corporation, Bausch & Lomb Incorporated, Nidek Co. Ltd |
The forecast period for Ophthalmology Devices Market is 2024-2033.
The global ophthalmology devices market was valued at $7.1 billion in 2023
The base year is 2023 in Ophthalmology Devices Market
The market value of Ophthalmology Devices Market is projected to reach $11.6 billion by 2033.
Major key players that operate in the Ophthalmology Devices Market are Johnson & Johnson, Alcon Vision LLC, Carl Zeiss Meditec AG, and Bausch & Lomb Incorporated.
Loading Table Of Content...

