0
2018
Optical Coating Equipment Market

Optical Coating Equipment Market

by Material (Reflective Coatings, Antireflective Coatings, Filter Coatings, Transparent Conductive Coatings, and Others), by Technology (Evaporation Deposition, Ion Beam Sputtering, and Advanced Plasma Reactive Sputtering), and by End-user Industry (Medical, Solar, Electronics, Telecommunications, Automotive, and Others) - Global Opportunity Analysis and Industry Forecast, 2017-2023

Report Code: A02793
Jan 2018 | Pages: 232
Tables: 108
Charts: 53
  • Formats*:

  • pdf

    Single User License, Five User
    License & Enterprise User License

  • xls

    Data Pack Excel License

  • ppt

    It comes with the additional cost
    of $2500.00 contact sales.


COVID-19

Pandemic disrupted the entire world and affected many industries.

Get detailed COVID-19 impact analysis on the Optical Coating Equipment Market

Request Now !

Optical Coating Equipment Market Overview:

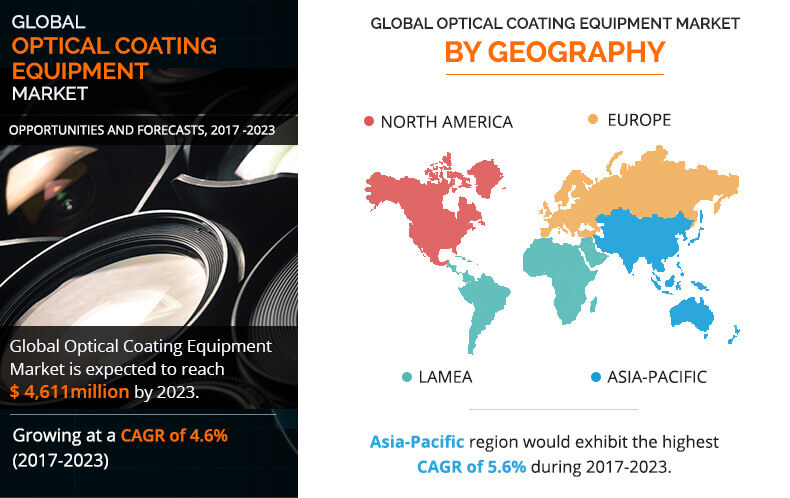
Global Optical Coating Equipment Market is expected to reach $3,402 million in 2023, from $4,611 million in 2016, growing at a CAGR of 4.6% from 2017 to 2023. The optical coating equipment provide assistance in application of optical coatings over the target materials. The optical coatings owing to their ability to reflect, filter or absorb light waves from varying frequencies and wavelength has numerous applications across different industry verticals.

The optical coating equipment utilizes the application of state-of-the art technology for applying thin-films of optical coatings on various devices, components, and target materials. Further, the advancement of fabrication technology has enhanced the optical coating capabilities to deliver sophisticated, high quality, and multilayer coatings. Based on the type of materials used for optical coatings it can enhance the reflective, antireflective, filter, and dichroic capabilities of the materials. Subsequently, it can be used for improving the visual appeal of the buildings, protect the infrastructure from harmful radiations, medical imaging, and reduce the optical glare for lenses.

Technological advancement in fabrication techniques has profound influence over the market growth of optical coating equipment and continues to be one of the major driving factor for the optical coating equipment market. Moreover, the rise in adoption of optically coated materials across different industry verticals is also expected to fuel the demand for the optical coating equipment in the forecast period. As the equipment utilize the application of sophisticated technology such as such as advanced sputtering, magnetron sputtering and ion led deposition to name a few results in high cost of installation as well maintenance of the equipment. Consequently, the high cost of installation for the equipment is expected to hinder the market growth in the coming years. However, development of equipment with lower operations costs and large production of optical coatings is expected to provide profitable opportunities to the manufacturers during the forecast period.        

The key players operating in the global market are Alluxa Inc., Bühler Holding AG, Coburn Technologies Inc., DuPont, Mastang Vacuum Systems LLC, Optimax Systems Inc., Optorun Co. Ltd., Optotech GmbH, Satisloh AG, and Ultra Optics.

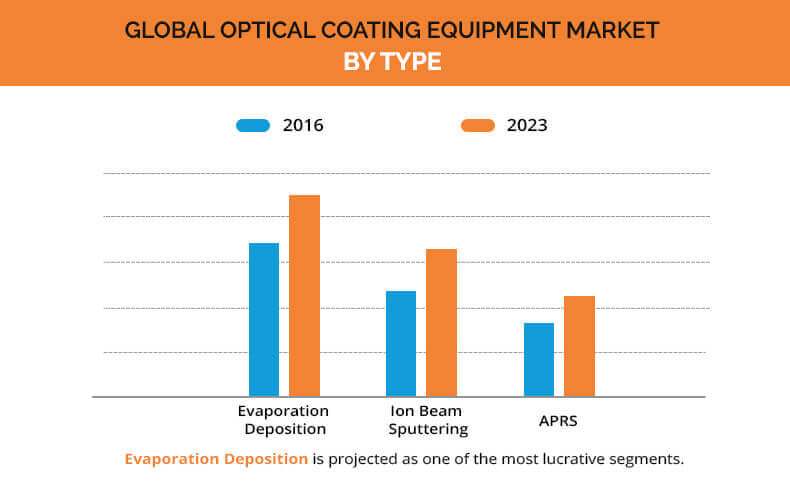
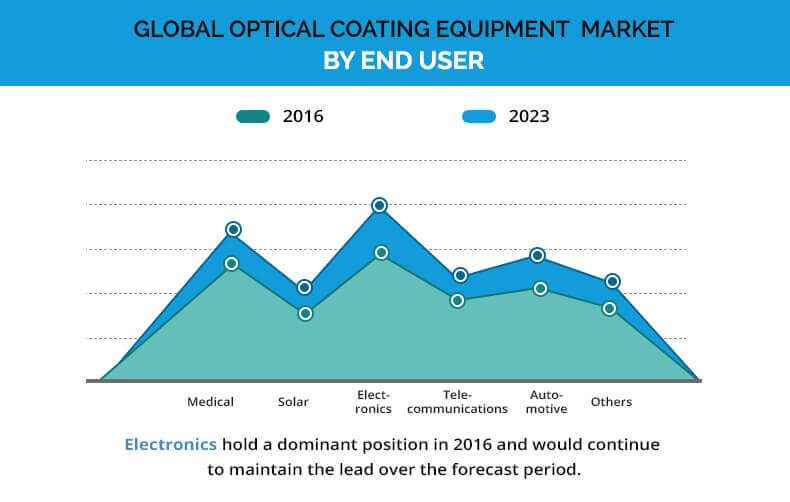
The optical coating equipment market is segmented based on materials, technology, end-user industry, and region. By materials, the global optical coating equipment market is classified into reflective coatings, antireflective coatings, filter coatings, transparent conductive coatings, and others. Furthermore, based on technology the market is divided into evaporation deposition, ion beam sputtering, and advanced plasma reactive sputtering (APRS). Based on the end-user industry, the market is divided into medical, solar, electronics, telecommunications, automotive, and others. Based on region, the optical coating equipment market is analyzed across four regions including North America, Asia-Pacific, Europe, and LAMEA.      

The increase in scope of application for optical coatings in aerospace, consumer electronics, semiconductors, and fiber optics boost the demand for equipment in the recent years. Based on region, Asia-Pacific is expected to witness surge in demand for optical coating equipment owing to the rise in electronics and automotive industry. Moreover, the emerging economies in Africa along with Asia is expected provide attractive business opportunities for the market players in medical, telecommunications, and electronics industries.

Key Benefits for Stakeholders

  • The study provides an in-depth analysis of the global optical coating equipment market and current & future trends to elucidate the imminent investment pockets.
  • Information about key drivers, restrains, and opportunities and their impact analysis on the market is provided.
  • Porter’s Five Forces analysis illustrates the potency of buyers & suppliers operating in the industry.
  • The quantitative analysis of the market from 2017 to 2023 is provided to determine the market potential.

Optical Coating Equipment Market Key Segments:

By Material

  • Reflective Coatings
  • Antireflective Coatings
  • Filter Coatings
  • Transparent Conductive Coatings
  • Others

By Technology

  • Evaporation Deposition
  • Ion Beam Sputtering
  • Advanced Plasma Reactive Sputtering

By End-User Industry

  • Medical
  • Solar
  • Electronics
  • Telecommunications
  • Automotive
  • Others

By Region

  • North America
    • U.S.
    • Canada
    • Mexico
  • Europe
    • Germany
    • France
    • UK
    • Russia
    • Rest of Europe
  • Asia-Pacific
    • China
    • India
    • Japan
    • Rest of Asia-Pacific
  • LAMEA
    • Latin America
    • Middle East
    • Africa

Key Market Players

  • Alluxa Inc.
  • Bühler Holding AG
  • Coburn Technologies Inc.
  • DuPont
  • Mastang Vacuum Systems LLC
  • Optimax Systems Inc.
  • Optorun Co. Ltd.
  • Optotech GmbH
  • Satisloh AG
  • Ultra Optics

Optical Coating Equipment Market Report Highlights

Aspects Details
By PRODUCT
  • REFLECTIVE COATINGS
  • ANTIREFLECTIVE COATINGS
  • FILTER COATINGS
  • TRANSPARENT CONDUCTIVE COATINGS
  • OTHERS
By TECHNOLOGY
  • EVAPORATION DEPOSITION
  • ION BEAM SPUTTERING (IBS)
  • ADVANCED PLASMA REACTIVE SPUTTERING (APRS)
By END-USER INDUSTRY
  • MEDICAL
  • SOLAR
  • ELECTRONICS
  • TELECOMMUNICATIONS
  • AUTOMOTIVE
  • OTHERS
By Region
  • North America  (U.S., Canada, Mexico)
  • Europe  (France, Germany, Italy, Spain, UK, Russia, Rest of Europe)
  • Asia-Pacific  (China, Japan, India, South Korea, Australia, Thailand, Malaysia, Indonesia, Rest of Asia-Pacific)
  • LAMEA  (Brazil, South Africa, Saudi Arabia, UAE, Argentina, Rest of LAMEA)
Key Market Players ULTRA OPTICS COMPANY, E I DUPONT DE NEMOURS AND COMPANY, MUSTANG VACUUM SYSTEMS, LLC, OPTOTECH OPTIKMASCHINEN GMBH, COBURN TECHNOLOGIES, INC., BUHLER HOLDING AG, ALLUXA, INC., OPTIMAX SYSTEMS, INC., ESSILOR INTERNATIONAL SA (SATISLOH AG), OPTORUN CO., LTD.
 

CHAPTER 1 INTRODUCTION

1.1. REPORT DESCRIPTION
1.2. KEY BENEFITS
1.3. KEY MARKET SEGMENTS
1.4. RESEARCH METHODOLOGY

1.4.1. Secondary research
1.4.2. Primary research
1.4.3. Analyst tools and models

CHAPTER 2 EXECUTIVE SUMMARY

2.1. CXO PERSPECTIVE

CHAPTER 3 MARKET OVERVIEW

3.1. MARKET DEFINITION AND SCOPE
3.2. KEY FINDINGS

3.2.1. Top winning strategies
3.2.2. Top investment pockets

3.3. PORTER’S FIVE FORCES ANALYSIS

3.3.1. Moderate bargaining power of suppliers
3.3.2. Moderate bargaining power of buyers
3.3.3. Low threat of substitution
3.3.4. Moderate threat of new entrants
3.3.5. Moderate competitive rivalry

3.4. MARKET PLAYER POSITIONING, 2016
3.5. MARKET DYNAMICS

3.5.1. Drivers

3.5.1.1. Advancement in fabrication technologies
3.5.1.2. Widening applicability of optical coating in material science & engineering
3.5.1.3. Increasing adoption of efficient optical coatings across industries

3.5.2. Restraints

3.5.2.1. High cost of installation for optical coating equipment
3.5.2.2. High complexity associated with coating different curvatures

3.5.3. Opportunity

3.5.3.1. Advanced R&D in sputtering technology

CHAPTER 4 OPTICAL COATING EQUIPMENT MARKET, BY PRODUCT

4.1. OVERVIEW

4.1.1. Market size and forecast

4.2. REFLECTIVE COATINGS

4.2.1. Key market trends
4.2.2. Key growth factors and opportunities
4.2.3. Market size and forecast, by region
4.2.4. Market analysis by country

4.3. ANTIREFLECTIVE COATINGS

4.3.1. Key market trends
4.3.2. Key growth factors and opportunities
4.3.3. Market size and forecast, by region
4.3.4. Market analysis by country

4.4. FILTER COATINGS

4.4.1. Key market trends
4.4.2. Key growth factors and opportunities
4.4.3. Market size and forecast, by region
4.4.4. Market analysis by country

4.5. TRANSPARENT CONDUCTIVE COATINGS

4.5.1. Key market trends
4.5.2. Key growth factors and opportunities
4.5.3. Market size and forecast, by region
4.5.4. Market analysis by country

4.6. OTHERS

4.6.1. Key market trends
4.6.2. Key growth factors and opportunities
4.6.3. Market size and forecast, by region
4.6.4. Market analysis by country

CHAPTER 5 OPTICAL COATING EQUIPMENT MARKET, BY TECHNOLOGY

5.1. OVERVIEW

5.1.1. Market size and forecast

5.2. EVAPORATION DEPOSITION

5.2.1. Key market trends
5.2.2. Key growth factors and opportunities
5.2.3. Market size and forecast, by region
5.2.4. Market analysis by country

5.3. ION BEAM SPUTTERING (IBS)

5.3.1. Key market trends
5.3.2. Key growth factors and opportunities
5.3.3. Market size and forecast, by region
5.3.4. Market analysis by country

5.4. ADVANCED PLASMA REACTIVE SPUTTERING (APRS)

5.4.1. Key market trends
5.4.2. Key growth factors and opportunities
5.4.3. Market size and forecast, by region
5.4.4. Market analysis by country

CHAPTER 6 OPTICAL COATING EQUIPMENT MARKET, BY END-USER INDUSTRY

6.1. OVERVIEW

6.1.1. Market size and forecast

6.2. MEDICAL

6.2.1. Key market trends
6.2.2. Key growth factors and opportunities
6.2.3. Market size and forecast, by region
6.2.4. Market analysis by country

6.3. SOLAR

6.3.1. Key market trends
6.3.2. Key growth factors and opportunities
6.3.3. Market size and forecast, by region
6.3.4. Market analysis by country

6.4. ELECTRONICS

6.4.1. Key market trends
6.4.2. Key growth factors and opportunities
6.4.3. Market size and forecast, by region
6.4.4. Market analysis by country

6.5. TELECOMMUNICATIONS

6.5.1. Key market trends
6.5.2. Key growth factors and opportunities
6.5.3. Market size and forecast, by region
6.5.4. Market analysis by country

6.6. AUTOMOTIVE

6.6.1. Key market trends
6.6.2. Key growth factors and opportunities
6.6.3. Market size and forecast, by region
6.6.4. Market analysis by country

6.7. OTHERS

6.7.1. Key market trends
6.7.2. Key growth factors and opportunities
6.7.3. Market size and forecast, by region
6.7.4. Market analysis by country

CHAPTER 7 OPTICAL COATING EQUIPMENT MARKET, BY REGION

7.1. OVERVIEW

7.1.1. Market size and forecast

7.2. NORTH AMERICA

7.2.1. Key market trends
7.2.2. Key growth factors and opportunities
7.2.3. Market size and forecast, by country
7.2.4. Market size and forecast by product
7.2.5. Market size and forecast, by technology
7.2.6. Market size and forecast, by end-user industry
7.2.7. Market size and forecast, by country

7.2.7.1. U.S.

7.2.7.1.1. U.S. market size and forecast, by product
7.2.7.1.2. U.S. market size and forecast, by technology
7.2.7.1.3. U.S. market size and forecast, by end-user industry

7.2.7.2. Canada

7.2.7.2.1. Canada market size and forecast, by product
7.2.7.2.2. Canada market size and forecast, by technology
7.2.7.2.3. Canada market size and forecast, by end-user industry

7.2.7.3. Mexico

7.2.7.3.1. Mexico market size and forecast, by product
7.2.7.3.2. Mexico market size and forecast, by technology
7.2.7.3.3. Mexico market size and forecast, by end-user industry

7.3. EUROPE

7.3.1. Key market trends
7.3.2. Key growth factors and opportunities
7.3.3. Market size and forecast, by country
7.3.4. Market size and forecast, by product
7.3.5. Market size and forecast, by technology
7.3.6. Market size and forecast, by end-user industry
7.3.7. Market size and forecast, by country

7.3.7.1. Germany

7.3.7.1.1. Germany market size and forecast, by product
7.3.7.1.2. Germany market size and forecast, by technology
7.3.7.1.3. Germany market size and forecast, by end-user industry

7.3.7.2. France

7.3.7.2.1. France market size and forecast, by product
7.3.7.2.2. France market size and forecast, by technology
7.3.7.2.3. France market size and forecast, by end-user industry

7.3.7.3. UK

7.3.7.3.1. UK market size and forecast, by product
7.3.7.3.2. UK market size and forecast, by technology
7.3.7.3.3. UK market size and forecast, by end-user industry

7.3.7.4. Russia

7.3.7.4.1. Russia market size and forecast, by product
7.3.7.4.2. Russia market size and forecast, by technology
7.3.7.4.3. Russia market size and forecast, by end-user industry

7.3.7.5. Rest of Europe

7.3.7.5.1. Rest of Europe market size and forecast, by product
7.3.7.5.2. Rest of Europe market size and forecast, by technology
7.3.7.5.3. Rest of Europe market size and forecast, by end-user industry

7.4. ASIA-PACIFIC

7.4.1. Key market trends
7.4.2. Key growth factors and opportunities
7.4.3. Market size and forecast, by country
7.4.4. Market size and forecast, by product
7.4.5. Market size and forecast, by technology
7.4.6. Market size and forecast, by end-user industry
7.4.7. Market size and forecast, by country

7.4.7.1. China

7.4.7.1.1. China market size and forecast, by product
7.4.7.1.2. China market size and forecast, by technology
7.4.7.1.3. China market size and forecast, by end-user industry

7.4.7.2. India

7.4.7.2.1. India market size and forecast, by product
7.4.7.2.2. India market size and forecast, by technology
7.4.7.2.3. India market size and forecast, by end-user industry

7.4.7.3. Japan

7.4.7.3.1. Japan market size and forecast, by product
7.4.7.3.2. Japan market size and forecast, by technology
7.4.7.3.3. Japan market size and forecast, by end-user industry

7.4.7.4. Rest of Asia-Pacific

7.4.7.4.1. Rest of Asia-Pacific market size and forecast, by product
7.4.7.4.2. Rest of Asia-Pacific market size and forecast, by technology
7.4.7.4.3. Rest of Asia-Pacific market size and forecast, by end-user industry

7.5. LAMEA

7.5.1. Key market trends
7.5.2. Key growth factors and opportunities
7.5.3. Market size and forecast, by country
7.5.4. Market size and forecast, by product
7.5.5. Market size and forecast, by technology
7.5.6. Market size and forecast, by end-user industry
7.5.7. Market size and forecast, by country

7.5.7.1. Latin America

7.5.7.1.1. Latin America market size and forecast, by product
7.5.7.1.2. Latin America market size and forecast, by technology
7.5.7.1.3. Latin America market size and forecast, by end-user industry

7.5.7.2. Middle East

7.5.7.2.1. Middle East market size and forecast, by product
7.5.7.2.2. Middle East market size and forecast, by technology
7.5.7.2.3. Middle East market size and forecast, by end-user industry

7.5.7.3. Africa

7.5.7.3.1. Africa market size and forecast, by product
7.5.7.3.2. Africa market size and forecast, by technology
7.5.7.3.3. Africa market size and forecast, by end-user industry

CHAPTER 8 COMPANY PROFILES

8.1. ALLUXA, INC.

8.1.1. Company overview
8.1.2. Company snapshot
8.1.3. Operating business segments
8.1.4. Product portfolio
8.1.5. Key strategic moves and developments

8.2. BUHLER HOLDING AG

8.2.1. Company overview
8.2.2. Company snapshot
8.2.3. Operating business segments
8.2.4. Product portfolio
8.2.5. Business performance
8.2.6. Key strategic moves and developments

8.3. COBURN TECHNOLOGIES, INC.

8.3.1. Company overview
8.3.2. Company snapshot
8.3.3. Operating business segments
8.3.4. Product portfolio

8.4. E I DUPONT DE NEMOURS AND COMPANY

8.4.1. Company overview
8.4.2. Company snapshot
8.4.3. Operating business segments
8.4.4. Product portfolio
8.4.5. Business performance

8.5. ESSILOR INTERNATIONAL SA (SATISLOH AG)

8.5.1. Company overview
8.5.2. Company snapshot
8.5.3. Operating business segments
8.5.4. Product portfolio
8.5.5. Business performance

8.6. MUSTANG VACUUM SYSTEMS, LLC

8.6.1. Company overview
8.6.2. Company snapshot
8.6.3. Operating business segments
8.6.4. Product portfolio

8.7. OPTIMAX SYSTEMS, INC.

8.7.1. Company overview
8.7.2. Company snapshot
8.7.3. Product portfolio

8.8. OPTORUN CO., LTD.

8.8.1. Company overview
8.8.2. Company snapshot
8.8.3. Operating business segments
8.8.4. Product portfolio
8.8.5. Business performance

8.9. OPTOTECH OPTIKMASCHINEN GMBH

8.9.1. Company overview
8.9.2. Company snapshot
8.9.3. Operating business segments
8.9.4. Product portfolio
8.9.5. Key strategic moves and developments

8.10. ULTRA OPTICS COMPANY

8.10.1. Company overview
8.10.2. Company snapshot
8.10.3. Operating business segments
8.10.4. Product portfolio

LIST OF TABLES

TABLE 1. OPTICAL COATING EQUIPMENT MARKET, BY PRODUCT, 2016-2023 ($MILLION)
TABLE 2. OPTICAL COATING EQUIPMENT MARKET FOR REFLECTIVE COATINGS, BY REGION, 2016-2023 ($MILLION)
TABLE 3. OPTICAL COATING EQUIPMENT MARKET FOR ANTIREFLECTIVE COATINGS, BY REGION, 2016-2023 ($MILLION)
TABLE 4. OPTICAL COATING EQUIPMENT MARKET FOR FILTER COATINGS, BY REGION, 2016-2023 ($MILLION)
TABLE 5. OPTICAL COATING EQUIPMENT MARKET FOR TRANSPARENT CONDUCTIVE COATINGS, BY REGION, 2016-2023 ($MILLION)
TABLE 6. OPTICAL COATING EQUIPMENT MARKET FOR OTHERS, BY REGION, 2016-2023 ($MILLION)
TABLE 7. OPTICAL COATING EQUIPMENT MARKET, BY TECHNOLOGY, 2016-2023 ($MILLION)
TABLE 8. OPTICAL COATING EQUIPMENT MARKET FOR EVAPORATION DEPOSITION, BY REGION, 2016-2023 ($MILLION)
TABLE 9. OPTICAL COATING EQUIPMENT MARKET FOR ION BEAM SPUTTERING, BY REGION, 2016-2023 ($MILLION)
TABLE 10. OPTICAL COATING EQUIPMENT MARKET FOR ADVANCED PLASMA REACTIVE SPUTTERING, BY REGION, 2016-2023 ($MILLION)
TABLE 11. OPTICAL COATING EQUIPMENT MARKET, BY END-USER INDUSTRY, 2016-2023 ($MILLION)
TABLE 12. OPTICAL COATING EQUIPMENT MARKET FOR MEDICAL, BY REGION, 2016-2023 ($MILLION)
TABLE 13. OPTICAL COATING EQUIPMENT MARKET FOR SOLAR, BY REGION, 2016-2023 ($MILLION)
TABLE 14. OPTICAL COATING EQUIPMENT MARKET FOR ELECTRONICS, BY REGION, 2016-2023 ($MILLION)
TABLE 15. OPTICAL COATING EQUIPMENT MARKET FOR TELECOMMUNICATIONS, BY REGION, 2016-2023 ($MILLION)
TABLE 16. OPTICAL COATING EQUIPMENT MARKET FOR AUTOMOTIVE, BY REGION, 2016-2023 ($MILLION)
TABLE 17. OPTICAL COATING EQUIPMENT MARKET FOR OTHERS, BY REGION, 2016-2023 ($MILLION)
TABLE 18. OPTICAL COATING EQUIPMENT MARKET, BY REGION, 2016-2023 ($MILLION)
TABLE 19. NORTH AMERICA OPTICAL COATING EQUIPMENT MARKET, BY COUNTRY, 2016-2023 ($MILLION)
TABLE 20. NORTH AMERICA OPTICAL COATING EQUIPMENT MARKET, BY PRODUCT, 2016-2023 ($MILLION)
TABLE 21. NORTH AMERICA OPTICAL COATING EQUIPMENT MARKET, BY TECHNOLOGY, 2016-2023 ($MILLION)
TABLE 22. NORTH AMERICA OPTICAL COATING EQUIPMENT MARKET, BY END-USER INDUSTRY, 2016-2023 ($MILLION)
TABLE 23. U.S. OPTICAL COATING EQUIPMENT MARKET, BY PRODUCT, 2016-2023 ($MILLION)
TABLE 24. U.S. OPTICAL COATING EQUIPMENT MARKET, BY TECHNOLOGY, 2016-2023 ($MILLION)
TABLE 25. U.S. OPTICAL COATING EQUIPMENT MARKET, BY END-USER INDUSTRY, 2016-2023 ($MILLION)
TABLE 26. CANADA OPTICAL COATING EQUIPMENT MARKET, BY PRODUCT, 2016-2023 ($MILLION)
TABLE 27. CANADA OPTICAL COATING EQUIPMENT MARKET, BY TECHNOLOGY, 2016-2023 ($MILLION)
TABLE 28. CANADA OPTICAL COATING EQUIPMENT MARKET, BY END-USER INDUSTRY, 2016-2023 ($MILLION)
TABLE 29. MEXICO OPTICAL COATING EQUIPMENT MARKET, BY PRODUCT, 2016-2023 ($MILLION)
TABLE 30. MEXICO OPTICAL COATING EQUIPMENT MARKET, BY TECHNOLOGY, 2016-2023 ($MILLION)
TABLE 31. MEXICO OPTICAL COATING EQUIPMENT MARKET, BY END-USER INDUSTRY, 2016-2023 ($MILLION)
TABLE 32. EUROPE OPTICAL COATING EQUIPMENT MARKET, BY COUNTRY, 2016-2023 ($MILLION)
TABLE 33. EUROPE OPTICAL COATING EQUIPMENT MARKET, BY PRODUCT, 2016-2023 ($MILLION)
TABLE 34. EUROPE OPTICAL COATING EQUIPMENT MARKET, BY TECHNOLOGY, 2016-2023 ($MILLION)
TABLE 35. EUROPE OPTICAL COATING EQUIPMENT MARKET, BY END-USER INDUSTRY, 2016-2023 ($MILLION)
TABLE 36. GERMANY OPTICAL COATING EQUIPMENT MARKET, BY PRODUCT, 2016-2023 ($MILLION)
TABLE 37. GERMANY OPTICAL COATING EQUIPMENT MARKET, BY TECHNOLOGY, 2016-2023 ($MILLION)
TABLE 38. GERMANY OPTICAL COATING EQUIPMENT MARKET, BY END-USER INDUSTRY, 2016-2023 ($MILLION)
TABLE 39. FRANCE OPTICAL COATING EQUIPMENT MARKET, BY PRODUCT, 2016-2023 ($MILLION)
TABLE 40. FRANCE OPTICAL COATING EQUIPMENT MARKET, BY TECHNOLOGY, 2016-2023 ($MILLION)
TABLE 41. FRANCE OPTICAL COATING EQUIPMENT MARKET, BY END-USER INDUSTRY, 2016-2023 ($MILLION)
TABLE 42. UK OPTICAL COATING EQUIPMENT MARKET, BY PRODUCT, 2016-2023 ($MILLION)
TABLE 43. UK OPTICAL COATING EQUIPMENT MARKET, BY TECHNOLOGY, 2016-2023 ($MILLION)
TABLE 44. UK OPTICAL COATING EQUIPMENT MARKET, BY END-USER INDUSTRY, 2016-2023 ($MILLION)
TABLE 45. RUSSIA OPTICAL COATING EQUIPMENT MARKET, BY PRODUCT, 2016-2023 ($MILLION)
TABLE 46. RUSSIA OPTICAL COATING EQUIPMENT MARKET, BY TECHNOLOGY, 2016-2023 ($MILLION)
TABLE 47. RUSSIA OPTICAL COATING EQUIPMENT MARKET, BY END-USER INDUSTRY, 2016-2023 ($MILLION)
TABLE 48. REST OF EUROPE OPTICAL COATING EQUIPMENT MARKET, BY PRODUCT, 2016-2023 ($MILLION)
TABLE 49. REST OF EUROPE OPTICAL COATING EQUIPMENT MARKET, BY TECHNOLOGY, 2016-2023 ($MILLION)
TABLE 50. REST OF EUROPE OPTICAL COATING EQUIPMENT MARKET, BY END-USER INDUSTRY, 2016-2023 ($MILLION)
TABLE 51. ASIA-PACIFIC OPTICAL COATING EQUIPMENT MARKET, BY COUNTRY, 2016-2023 ($MILLION)
TABLE 52. ASIA-PACIFIC OPTICAL COATING EQUIPMENT MARKET, BY PRODUCT, 2016-2023 ($MILLION)
TABLE 53. ASIA-PACIFIC OPTICAL COATING EQUIPMENT MARKET, BY TECHNOLOGY, 2016-2023 ($MILLION)
TABLE 54. ASIA-PACIFIC OPTICAL COATING EQUIPMENT MARKET, BY END-USER INDUSTRY, 2016-2023 ($MILLION)
TABLE 55. CHINA OPTICAL COATING EQUIPMENT MARKET, BY PRODUCT, 2016-2023 ($MILLION)
TABLE 56. CHINA OPTICAL COATING EQUIPMENT MARKET, BY TECHNOLOGY, 2016-2023 ($MILLION)
TABLE 57. CHINA OPTICAL COATING EQUIPMENT MARKET, BY END-USER INDUSTRY, 2016-2023 ($MILLION)
TABLE 58. INDIA OPTICAL COATING EQUIPMENT MARKET, BY PRODUCT, 2016-2023 ($MILLION)
TABLE 59. INDIA OPTICAL COATING EQUIPMENT MARKET, BY TECHNOLOGY, 2016-2023 ($MILLION)
TABLE 60. INDIA OPTICAL COATING EQUIPMENT MARKET, BY END-USER INDUSTRY, 2016-2023 ($MILLION)
TABLE 61. JAPAN OPTICAL COATING EQUIPMENT MARKET, BY PRODUCT, 2016-2023 ($MILLION)
TABLE 62. JAPAN OPTICAL COATING EQUIPMENT MARKET, BY TECHNOLOGY, 2016-2023 ($MILLION)
TABLE 63. JAPAN OPTICAL COATING EQUIPMENT MARKET, BY END-USER INDUSTRY, 2016-2023 ($MILLION)
TABLE 64. REST OF ASIA-PACIFIC OPTICAL COATING EQUIPMENT MARKET, BY PRODUCT, 2016-2023 ($MILLION)
TABLE 65. REST OF ASIA-PACIFIC OPTICAL COATING EQUIPMENT MARKET, BY TECHNOLOGY, 2016-2023 ($MILLION)
TABLE 66. REST OF ASIA-PACIFIC OPTICAL COATING EQUIPMENT MARKET, BY END-USER INDUSTRY, 2016-2023 ($MILLION)
TABLE 67. LAMEA OPTICAL COATING EQUIPMENT MARKET, BY COUNTRY, 2016-2023 ($MILLION)
TABLE 68. LAMEA OPTICAL COATING EQUIPMENT MARKET, BY PRODUCT, 2016-2023 ($MILLION)
TABLE 69. LAMEA OPTICAL COATING EQUIPMENT MARKET, BY TECHNOLOGY, 2016-2023 ($MILLION)
TABLE 70. LAMEA OPTICAL COATING EQUIPMENT MARKET, BY END-USER INDUSTRY, 2016-2023 ($MILLION)
TABLE 71. LATIN AMERICA OPTICAL COATING EQUIPMENT MARKET, BY PRODUCT, 2016-2023 ($MILLION)
TABLE 72. LATIN AMERICA OPTICAL COATING EQUIPMENT MARKET, BY TECHNOLOGY, 2016-2023 ($MILLION)
TABLE 73. LATIN AMERICA OPTICAL COATING EQUIPMENT MARKET, BY END-USER INDUSTRY, 2016-2023 ($MILLION)
TABLE 74. MIDDLE EAST OPTICAL COATING EQUIPMENT MARKET, BY PRODUCT, 2016-2023 ($MILLION)
TABLE 75. MIDDLE EAST OPTICAL COATING EQUIPMENT MARKET, BY TECHNOLOGY, 2016-2023 ($MILLION)
TABLE 76. MIDDLE EAST OPTICAL COATING EQUIPMENT MARKET, BY END-USER INDUSTRY, 2016-2023 ($MILLION)
TABLE 77. AFRICA OPTICAL COATING EQUIPMENT MARKET, BY PRODUCT, 2016-2023 ($MILLION)
TABLE 78. AFRICA OPTICAL COATING EQUIPMENT MARKET, BY TECHNOLOGY, 2016-2023 ($MILLION)
TABLE 79. AFRICA OPTICAL COATING EQUIPMENT MARKET, BY END-USER INDUSTRY, 2016-2023 ($MILLION)
TABLE 80. ALLUXA: COMPANY SNAPSHOT
TABLE 81. ALLUXA: OPERATING SEGMENTS
TABLE 82. ALLUXA: PRODUCT PORTFOLIO
TABLE 83. BUHLER: COMPANY SNAPSHOT
TABLE 84. BUHLER: OPERATING SEGMENTS
TABLE 85. BUHLER: PRODUCT PORTFOLIO
TABLE 86. COBURN TECHNOLOGIES: COMPANY SNAPSHOT
TABLE 87. COBURN TECHNOLOGIES: OPERATING SEGMENTS
TABLE 88. COBURN TECHNOLOGIES: PRODUCT PORTFOLIO
TABLE 89. DUPONT: COMPANY SNAPSHOT
TABLE 90. DUPONT: OPERATING SEGMENTS
TABLE 91. DUPONT: PRODUCT PORTFOLIO
TABLE 92. ESSILOR: COMPANY SNAPSHOT
TABLE 93. ESSILOR: OPERATING SEGMENTS
TABLE 94. ESSILOR: PRODUCT PORTFOLIO
TABLE 95. MUSTANG VACUUM: COMPANY SNAPSHOT
TABLE 96. MUSTANG VACUUM: OPERATING SEGMENTS
TABLE 97. MUSTANG VACUUM: PRODUCT PORTFOLIO
TABLE 98. OPTIMAX: COMPANY SNAPSHOT
TABLE 99. OPTIMAX: PRODUCT PORTFOLIO
TABLE 100. OPTORUN: COMPANY SNAPSHOT
TABLE 101. OPTORUN: OPERATING SEGMENTS
TABLE 102. OPTORUN: PRODUCT PORTFOLIO
TABLE 103. OPTOTECH: COMPANY SNAPSHOT
TABLE 104. OPTOTECH: OPERATING SEGMENTS
TABLE 105. OPTOTECH: PRODUCT PORTFOLIO
TABLE 106. ULTRA OPTICS: COMPANY SNAPSHOT
TABLE 107. ULTRA OPTICS: OPERATING SEGMENTS
TABLE 108. ULTRA OPTICS: PRODUCT PORTFOLIO

LIST OF FIGURES

FIGURE 1. OPTICAL COATING EQUIPMENT MARKET SEGMENTATION
FIGURE 2. EXECUTIVE SUMMARY OF THE OPTICAL COATING EQUIPMENT MARKET
FIGURE 3. TOP WINNING STRATEGIES, BY YEAR, 2014-2017
FIGURE 4. TOP WINNING STRATEGIES, BY DEVELOPMENT, 2014-2017 (%)
FIGURE 5. TOP WINNING STRATEGIES, BY COMPANY, 2014-2017
FIGURE 6. TOP INVESTMENT POCKETS
FIGURE 7. PORTER’S FIVE FORCES
FIGURE 8. MARKET PLAYER POSITIONING, 2016
FIGURE 9. OPTICAL COATING EQUIPMENT MARKET, BY PRODUCT, 2016 & 2023 (%)
FIGURE 10. COMPARATIVE SHARE ANALYSIS OF REFLECTIVE COATINGS MARKET, BY COUNTRY, 2016 & 2023 (%)
FIGURE 11. COMPARATIVE SHARE ANALYSIS OF ANTIREFLECTIVE COATINGS MARKET, BY COUNTRY, 2016 & 2023 (%)
FIGURE 12. COMPARATIVE SHARE ANALYSIS OF FILTER COATINGS MARKET, BY COUNTRY, 2016 & 2023 (%)
FIGURE 13. COMPARATIVE SHARE ANALYSIS OF TRANSPARENT CONDUCTIVE COATINGS MARKET, BY COUNTRY, 2016 & 2023 (%)
FIGURE 14. COMPARATIVE SHARE ANALYSIS OF OTHERS MARKET, BY COUNTRY, 2016 & 2023 (%)
FIGURE 15. OPTICAL COATING EQUIPMENT MARKET, BY TECHNOLOGY, 2016 & 2023 (%)
FIGURE 16. COMPARATIVE SHARE ANALYSIS OF EVAPORATION DEPOSITION MARKET, BY COUNTRY, 2016 & 2023 (%)
FIGURE 17. COMPARATIVE SHARE ANALYSIS OF ION BEAM SPUTTERING MARKET, BY COUNTRY, 2016 & 2023 (%)
FIGURE 18. COMPARATIVE SHARE ANALYSIS OF ADVANCED PLASMA REACTIVE SPUTTERING MARKET, BY COUNTRY, 2016 & 2023 (%)
FIGURE 19. OPTICAL COATING EQUIPMENT MARKET, BY END-USER INDUSTRY, 2016 & 2023 (%)
FIGURE 20. COMPARATIVE SHARE ANALYSIS OF MEDICAL MARKET, BY COUNTRY, 2016 & 2023 (%)
FIGURE 21. COMPARATIVE SHARE ANALYSIS OF SOLAR MARKET, BY COUNTRY, 2016 & 2023 (%)
FIGURE 22. COMPARATIVE SHARE ANALYSIS OF ELECTRONICS MARKET, BY COUNTRY, 2016 & 2023 (%)
FIGURE 23. COMPARATIVE SHARE ANALYSIS OF TELECOMMUNICATIONS MARKET, BY COUNTRY, 2016 & 2023 (%)
FIGURE 24. COMPARATIVE SHARE ANALYSIS OF AUTOMOTIVE MARKET, BY COUNTRY, 2016 & 2023 (%)
FIGURE 25. COMPARATIVE SHARE ANALYSIS OF OTHERS MARKET, BY COUNTRY, 2016 & 2023 (%)
FIGURE 26. OPTICAL COATING EQUIPMENT MARKET, BY REGION, 2016 (%)
FIGURE 27. NORTH AMERICA OPTICAL COATING EQUIPMENT MARKET, 2016-2023 ($MILLION)
FIGURE 28. U.S. OPTICAL COATING EQUIPMENT MARKET, 2016-2023 ($MILLION)
FIGURE 29. CANADA OPTICAL COATING EQUIPMENT MARKET, 2016-2023 ($MILLION)
FIGURE 30. MEXICO OPTICAL COATING EQUIPMENT MARKET, 2016-2023 ($MILLION)
FIGURE 31. EUROPE OPTICAL COATING EQUIPMENT MARKET, 2016-2023 ($MILLION)
FIGURE 32. GERMANY OPTICAL COATING EQUIPMENT MARKET, 2016-2023 ($MILLION)
FIGURE 33. FRANCE OPTICAL COATING EQUIPMENT MARKET, 2016-2023 ($MILLION)
FIGURE 34. UK OPTICAL COATING EQUIPMENT MARKET, 2016-2023 ($MILLION)
FIGURE 35. RUSSIA OPTICAL COATING EQUIPMENT MARKET, 2016-2023 ($MILLION)
FIGURE 36. REST OF EUROPE OPTICAL COATING EQUIPMENT MARKET, 2016-2023 ($MILLION)
FIGURE 37. ASIA-PACIFIC OPTICAL COATING EQUIPMENT MARKET, 2016-2023 ($MILLION)
FIGURE 38. CHINA OPTICAL COATING EQUIPMENT MARKET, 2016-2023 ($MILLION)
FIGURE 39. INDIA OPTICAL COATING EQUIPMENT MARKET, 2016-2023 ($MILLION)
FIGURE 40. JAPAN OPTICAL COATING EQUIPMENT MARKET, 2016-2023 ($MILLION)
FIGURE 41. REST OF ASIA-PACIFIC OPTICAL COATING EQUIPMENT MARKET, 2016-2023 ($MILLION)
FIGURE 42. LAMEA OPTICAL COATING EQUIPMENT MARKET, 2016-2023 ($MILLION)
FIGURE 43. LATIN AMERICA OPTICAL COATING EQUIPMENT MARKET, 2016-2023 ($MILLION)
FIGURE 44. MIDDLE EAST OPTICAL COATING EQUIPMENT MARKET, 2016-2023 ($MILLION)
FIGURE 45. AFRICA OPTICAL COATING EQUIPMENT MARKET, 2016-2023 ($MILLION)
FIGURE 46. BUHLER: NET SALES, 2014-2016 ($MILLION)
FIGURE 47. BUHLER: REVENUE SHARE BY SEGMENT, 2016 (%)
FIGURE 48. BUHLER: REVENUE SHARE BY GEOGRAPHY, 2016 (%)
FIGURE 49. DUPONT: NET SALES, 2014-2016 ($MILLION)
FIGURE 50. DUPONT: REVENUE SHARE BY SEGMENT, 2016 (%)
FIGURE 51. DUPONT: REVENUE SHARE BY GEOGRAPHY, 2016 (%)
FIGURE 52. ESSILOR: NET SALES, 2014-2016 ($MILLION)
FIGURE 53. MSCC: NET SALES, 2015-2016 ($MILLION)


The optical coating equipment provide assistance in the application of thin-film optical coatings over the target materials. The optical coatings enhance the reflective, antireflective, dichroic, and optical glare capabilities of the target materials on which the coating is applied. Currently, out of the available coating equipment type by technology the evaporation deposition holds the largest share of the global market. However, the ion beam sputtering is expected to provide profitable lucrative CAGR growth during the forecast period owing to their lower coat of operations and ability to furnish sophisticated optical coating across different curvatures. In addition, the increase in scope of application for optical coatings across various end users is also anticipated to drive the growth of this market during the forecast period.

Based on region, the North America accounts for a major market share in the global optical coating equipment market in 2016, owing to high demand from aerospace, military, medical, and other end users. However, Asia-Pacific is expected to exhibit the highest growth rate of 5.65% during the forecast period owing to rise in demand form consumer electronics and automotive industries.

The advancement in fabrication technology drives the demand for optical coating equipment across different end-user industries. As a result, the solar, aerospace, consumer electronics and military industries are expected to provide profitable business opportunities for equipment manufacturers.

PURCHASE OPTIONS

Call or Email us

U.S.-Canada Toll-free: +1-800-792-5285
Int'l : +1-503-894-6022
Europe : +44-845-528-1300
Email : help@alliedmarketresearch.com

Looking for Customization?

 Customization Request

Have a Question?

 Speak with Analyst

Any Confusion?

 Inquire Before Buying

Have a glance of the Report

  Request Sample

Purchase Full Report of
Optical Coating Equipment Market

Start reading instantly.
This Report and over 68,418+ more Reports, Available with Avenue Library. T&C*.

  • Online Only
  • $3,565
  • Online cloud access only
  • Restricted print, copy, paste & download
  • Read only
  • Free industry update
    (Within 180 days)
  • Free report update in next update cycle
    (Jan 2019 - Jan 2020)
  • Data Pack
  • $3,961
  • Restricted to one authorized user
  • One print only
  • Available in
    Excel
  • Free industry update
    (Within 180 days)
  •   Free report update in next update cycle
    (Jan 2019 - Jan 2020)
  • Single User
  • $5,540
  • Restricted to one authorized user
  • One print only
  • Available in
    PDF
  • Free industry update
    (Within 180 days)
  •   Free report update in next update cycle
    (Jan 2019 - Jan 2020)
  • Five Users
  • $6,654
  • Limited to five authorized users
  • Print upto five copies
  • Available in
    PDF
  • Free industry update
    (Within 180 days)
  •   Free report update in next update cycle
    (Jan 2019 - Jan 2020)
  • Enterprise
    License/PDF

  • $10,280
  • Unlimited
    within
    company/enterprise
  • Available in Excel & PDF
  • Free industry update
    (Within 180 days)
  •   Free report update in next update cycle
    (Jan 2019 - Jan 2020)
  • Library
    Membership

  • $999 $ 1,175
    Per User/ Per month/ Billed annually
  • Published Content
    E-access
  • Company Profiles
    E-access
  • Newly Added Content Access
  • 10 PDF
    Downloads
  • 5 Excel Data
    Pack Downloads
  • 250 Company Profiles PDF Downloads
  • Buy Now

*Taxes/Fees, if applicable will be added during checkout. All prices in USD

RELATED REPORTS
 

Why Allied Market Research?


Infallible Methodology

To ensure high-level data integrity, accurate analysis, and impeccable forecasts

Analyst Support

For complete satisfaction

Customization

On-demand customization of scope of the report to exactly meet your needs

TARGETED MARKET VIEW

Targeted market view to provide pertinent information and save time of readers

Get fresh content delivered

Get insights on topics that are crucial for your business. Stay abreast of your interest areas.

Get Industry Data Alerts

Why Allied Market Research?

Infallible Methodology

To ensure high-level data integrity, accurate analysis, and impeccable forecasts

Analyst Support

For complete satisfaction

Customization

On-demand customization of scope of the report to exactly meet your needs

TARGETED MARKET VIEW

Targeted market view to provide pertinent information and save time of readers