
Optical Position Sensor Market Overview:
The global Optical Position Sensor Market is anticipated to reach $2,589 million by 2022, up from $1,376 million in 2015, at a CAGR of 9.3% from 2016 to 2022.
An optical position sensor detects the position of the targeted object. These sensors are widely used in semiconductor modules and chips, such as automobiles, consumer electronics, medical devices, and aircraft.
The increase in demand for automobile safety, the rise in several consumer electronics, and the cost-efficiency of sensors drive the growth of the OPTICAL POSITION SENSORS market. Growth in the adoption of wearable medical devices and the need for high-performance sensors are further projected to fuel the market growth. However, low accuracy and less sensor customization hamper the market's growth. Irrespective of these challenges, the rise in demand and production of consumer electronic devices, such as cellular phones, provides lucrative opportunities to boost market growth.
Increase in demand for automobile safety
Optical position sensors detect changes in vehicle positions and provide parking assistance. In addition, these sensors ensure driver safety, thus releasing airbags depending on the position of the driver. Thus, the rise in the use of vehicles is projected to fuel the growth of the OPTICAL POSITION SENSORS market.
Rise in the need for optical position sensors among different application areas
The demand for optical position sensors has increased due to their applications in automobiles, consumer electronics, medical devices, and aircraft. Owing to their compact size, reliability, and low power consumption, these sensors are widely adopted in consumer electronic applications. These factors are expected to drive the growth of the market in the forecast period.
Optical Position Sensor Market Segment Overview
The optical position sensor is segmented based on type, application, and geography.
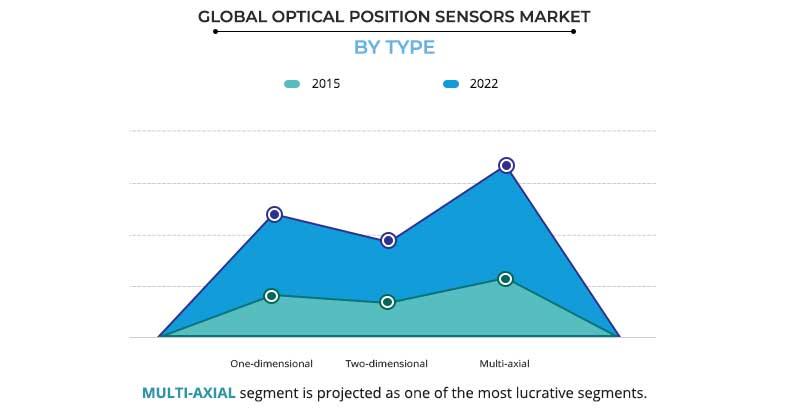
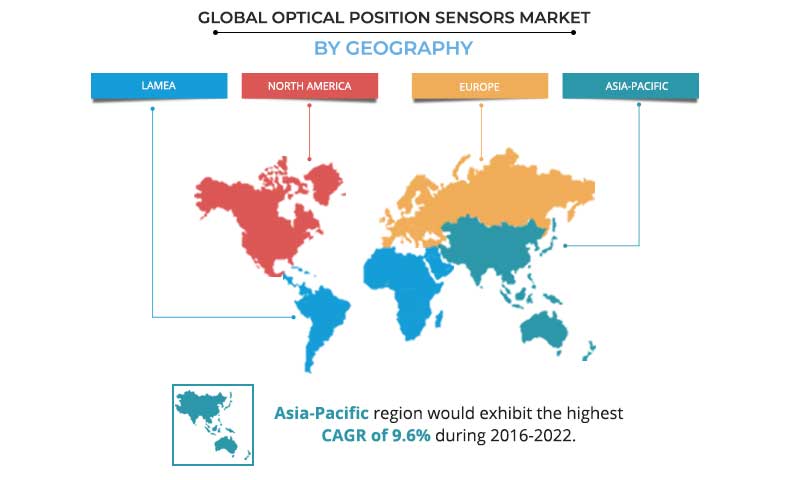
By type, the market is divided into one-dimensional optical position sensors, two-dimensional optical position sensors, and multiaxial optical position sensors. Based on application, it is categorized into aerospace & defense, automotive, consumer electronics, healthcare, and others. Geographically, it is analyzed across North America, Europe, Asia-Pacific, and LAMEA. Asia-Pacific accounted for the largest revenue share, owing to the increase in demand for semiconductors and portable devices.
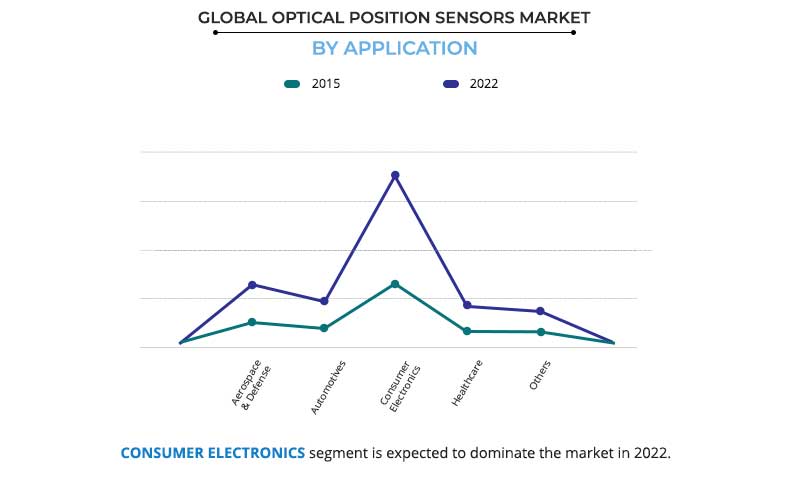
The Consumer Electronics sector dominates the optical position sensor market constituting around 50% of the market revenue in 2015. The application of these sensors in consumer electronics would continue to be a key revenue generator throughout the analysis period. Aerospace & Defense is the second largest revenue-generating sector, followed by the automotive sector.
Competition analysis
Comprehensive competitive analyses and profiles of major market players, including First Sensors AG, Siemens AG, Panasonic Corporation, Opto Diode Corporation, Sharp Corporation, Micro-Epsilon, Balluff GmbH, Sensata Technologies, Hamamastu Photonics K.K., and Melexis N.V. are provided in the report. These players have adopted partnerships and acquisitions to expand their customer base and increase their shares.
Key benefits
The study provides an in-depth analysis of the global optical position sensor market to elucidate the prominent investment pockets.
Current trends and future estimations from 2016 to 2022 are outlined to determine the overall market potential and single out profitable trends to gain a stronger foothold.
It presents information about key drivers, restraints, and opportunities along with their impact analyses.
Value chain analysis enables to understand the roles of intermediaries in the production processes.
Optical Position Sensor Market Report Highlights
| Aspects | Details |
| By Type |
|
| By Application |
|
| By Geography |
|
| Key Market Players | Opto Diode Corporation., Sensata Technologies, Siemens AG, Micro-Epsilon., Balluff GmbH., Panasonic Corporation., Hamamastu Photonics K.K., Melexis N.V., First Sensors AG, Sharp Corporation |
Analyst Review
The global optical position sensor market is expected to witness significant growth in the near future, owing to rise in sales of consumer electronics and automobiles. Optical position sensors are designed to detect the position of the desired object without physical contact using light. The reflection of the light measures the distance of the target object. These sensors are primarily incorporated in smart applications, such as televisions, smartphones, medical devices, wearable devices, and others. However, other industries such as healthcare, aerospace & defense, and automotive have adopted sensors owing to their efficiency, reliability, and increase in awareness about their benefits.
Optical position sensors possess multiple advantages such as lightweight nature, simple structuring, cost-saving, and design freedom that drive the market growth. However, low accuracy in extreme conditions and light dispersion hamper the market growth. Nevertheless, adoption of optical position sensor in semiconductor devices for automation and increase in demand for electronic gadgets provide various growth opportunities to market players. Prominent players have developed low-cost, compact, affordable, and energy-efficient sensors to increase the efficiency of the applications. Asia-Pacific is the major revenue contributor to the global market, followed by North America.
Loading Table Of Content...

