0
2021
Optical Preclinical Imaging Market

Optical Preclinical Imaging Market

by Modality (Bioluminescence & Fluorescence Imaging Systems, Standalone Fluorescence Imaging Systems, and Optical + X-ray & Optical + CT) and End User (Pharma & Biotech Companies, Academic & Government Research Institutes, and Contract Research Organizations): Global Opportunity Analysis and Industry Forecast, 2021-2030

Report Code: A10346
Nov 2021 | Pages: 185
Tables: 89
Charts: 25
  • Formats*:

  • pdf

    Single User License, Five User
    License & Enterprise User License

  • xls

    Data Pack Excel License

  • ppt

    It comes with the additional cost
    of $2500.00 contact sales.


COVID-19

Pandemic disrupted the entire world and affected many industries.

Get detailed COVID-19 impact analysis on the Optical Preclinical Imaging Market

Request Now !

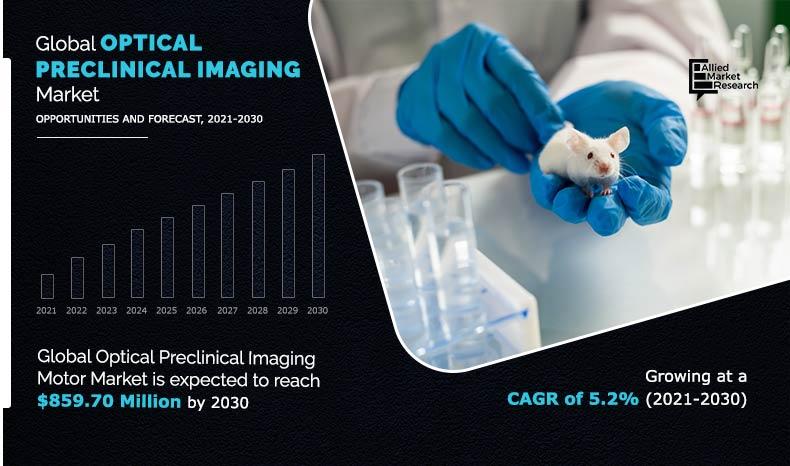
The global optical preclinical imaging market was valued at $516.10 million in 2020, and is projected to reach $859.70 million by 2030, registering a CAGR of 5.2% from 2021 to 2030. The visualization of living animals for research purposes, such as drug discovery and development, is known as optical preclinical imaging. Imaging modalities have frequently been used by researchers to monitor changes in animals in response to physiological or environmental changes, whether at the organ, tissue, cell, or molecular level. Over time, noninvasive and in vivo imaging approaches have become more useful for investigating animal models.

Preclinical optical imaging is becoming an increasingly popular feature in preclinical drug discovery and development. This modality offers a virtual window within the animal and allows for real-time tracking of biological activities at the molecular level. This technique is simple to use, has no radiation, has a high throughput, is moderately priced, and has excellent sensitivity. It can monitor disease progression and evaluate effects of drug candidates with extremely high sensitivity.

Optical-Preclinical-Imaging-Market-2021-2030

Preclinical imaging is critical for phenotyping, drug development, and identifying disease etiology. The primary goal is to increase the likelihood of clinical success while reducing the time and cost of medication research and development. Noninvasive in vivo imaging tools have advanced the use of animal models in preclinical drug discovery and development to a new level, enabling quick and efficient drug efficacy screening. Prior to the start of clinical trials, in vitro and in vivo testing are undertaken during the preclinical stage of drug discovery and development research to ensure that the drug candidate is safe to test in humans. Preclinical research use animal models to assist in the investigation of human diseases and the development of innovative therapies. The biological relevance of an animal model is critical for predicting therapeutic outcomes. The use of small animal models in basic and preclinical sciences is an important component of these type of research and development initiatives, acting as a bridge between molecular discoveries and clinical implementation.

Increase in use of optical preclinical imaging is mostly due to technological advancements in molecular imaging. Nuclear medicine and molecular imaging have made significant progress and continue to evolve, improving their impact on diagnosis and treatment. Rise in prevalence of chronic diseases, considerable increase in the ageing population, and more restricted global resources are among the major reasons driving the evolution of the nuclear medicine and molecular imaging business. 

In addition, advanced imaging and hybrid modalities, such as computed tomography (CT), magnetic resonance imaging (MRI), positron emission tomography (PET)/CT, and single-photon emission computed tomography (SPECT)/CT are witnessing significant adoption. Moreover, molecular imaging has made personalized treatments possible according to the respective needs. Furthermore, there has been a considerable rise in demand for noninvasive small animal imaging techniques.

Rise in overall population has led to rise in chronic diseases as well as emergence of new diseases. In addition, this has led to the research and development of new drug molecules. Preclinical research through clinical trials are conducted on animals to study the safety and efficacy of these new drug candidates before testing them on humans. Moreover, increase in funding for preclinical research by both private and public organizations boosts the market growth. However, high cost of optical preclinical imaging acts as a key deterrent factor of the global market. Moreover, optical preclinical imaging devices require regular maintenance, which incur additional cost, thus hampering the global market growth.

In addition, the COVID-19 pandemic led to huge number of clinics and hospitals across the globe being restructured to increase the hospital capacity for patients diagnosed with COVID-19. Non-essential procedures took a potential backlog due to rapidly rising COVID-19 cases. Conversely, various preclinical research studies and activities, including clinical trials for the efficacy and safety, for the treatment of COVID-19 by various researchers, companies and government boosted the growth of the optical preclinical imaging market.

Furthermore, untapped, emerging markets are expected to offer potential growth opportunities, due to improved healthcare infrastructure, increase in unmet healthcare needs, and rise in research & development activities. In addition, availability of various facilities providing such minimally invasive procedures is an emerging opportunity for key players to invest in the optical preclinical imaging market.

Optical Preclinical Imaging Market Segmentation

The global optical preclinical imaging market is segmented into modality, reagent, end user, and region. On the basis of modality, the market is divided into bioluminescence & fluorescence imaging systems, standalone fluorescence imaging systems, and optical + x-ray & optical + CT.

By end user, it is classified into pharma and biotech companies, academic & government research institutes, and contract research organizations. 

Region wise, the market is analyzed across North America (the U.S., Canada, and Mexico), Europe (Germany, France, the UK, Italy, Spain, and rest of Europe), Asia-Pacific (Japan, China, India, Australia, South Korea, and rest of Asia-Pacific), and LAMEA (Latin America and Middle East & Africa).

Optical Preclinical Imaging Market
By Modality

Your browser does not support the canvas element.

Bioluminescence & Fluorescence Imaging Systems holds a dominant position in 2020 and would continue to maintain the lead over the forecast period.

Get more information on this report : Request Sample Pages

Segment review

Depending on the modality, the bioluminescence & fluorescence imaging systems segment dominated the market in 2020, and is expected to continue this trend during the forecast period, due to their technologically advanced integration and commercialization of imaging systems.

By end user, the contract research organizations exhibited the highest growth in 2020, and is expected to continue this trend during the forecast period.

Optical Preclinical Imaging Market
By End User

Your browser does not support the canvas element.

Contract Research Organizations segment is projected as one of the most lucrative segment.

Get more information on this report : Request Sample Pages

North America accounted for a majority of the global optical preclinical imaging market share in 2020, and is anticipated to remain dominant during the forecast period. This is attributed to rise in drug discovery, presence of key players, and increase in healthcare expenditure in the region. However, Asia-Pacific is anticipated to witness notable growth, owing to increase in research & developmental activities, surge in facilities offering optical preclinical imaging services, and increased investments in the healthcare sector.

The key players operating in the global optical preclinical imaging market are Berthold Technologies GmbH & Co.KG, Endress+Hauser (Analytik Jena US LLC), Fujifilm Corporation (Fujifilm VisualSonics Inc.), LI-COR Biosciences, Inc., Miltenyi Biotec B.V. & CO. KG, PerkinElmer, Inc., Rigaku Corporation (MILabs B.V.), TriFoil Imaging, Vieworks Co., Ltd., and Vilber Smart Imaging Ltd.

Optical Preclinical Imaging Market
By Region

2030
North America 
Europe
Asia-Pacific
LAMEA

Asia-Pacific is expected to experience growth at the highest rate, registering a CAGR of 8.4% during the forecast period.

Get more information on this report : Request Sample Pages

Key Benefits For Stakeholders

  • The study provides an in-depth analysis of the optical preclinical imaging market, and the current trends and future estimations to elucidate the imminent investment pockets.
  • It presents a quantitative analysis of the market from 2021 to 2030 to enable stakeholders to capitalize on the prevailing market opportunities.
  • Extensive analysis of the market based on procedures and services assists to understand the trends in the industry.
  • Key players and their strategies are thoroughly analyzed to understand the competitive outlook of the market.

Optical Preclinical Imaging Market Report Highlights

Aspects Details
By Modality
  • Bioluminescence & Fluorescence Imaging Systems
  • Standalone Fluorescence Imaging Systems
  • Optical + X-ray & Optical + CT
By End User
  • Pharma & Biotech Companies
  • Academic & Government Research Institutes
  • Contract Research Organizations
By Region
  • North America  (U.S., Canada, Mexico)
  • Europe  (Germany, France, UK, Italy, Spain, Rest of Europe)
  • Asia-Pacific  (Japan, China, India, Australia, South Korea, Rest of Asia-Pacific)
  • LAMEA  (Latin America, Middle East & Africa)
By Key Market Players
  • Berthold Technologies GmbH & Co.KG
  • Endress+Hauser (Analytik Jena US LLC)
  • Fujifilm Corporation (Fujifilm VisualSonics Inc.)
  • LI-COR Biosciences, Inc.
  • Miltenyi Biotec
  • PerkinElmer, Inc.
  • Rigaku Corporation (MILabs B.V.)
  • TriFoil Imaging
  • Vieworks Co., Ltd.
  • Vilber Smart Imaging Ltd.
 

CHAPTER 1:INTRODUCTION

1.1.Report description
1.2.Key benefits for stakeholders
1.3.Key market segments

1.3.1.List of key players profile in the report

1.4.Research methodology

1.4.1.Secondary research
1.4.2.Primary research
1.4.3.Analyst tools and models

CHAPTER 2:EXECUTIVE SUMMARY

2.1.Key findings of the study
2.2.CXO perspective

CHAPTER 3:MARKET LANDSCAPE

3.1.Market definition and scope
3.2.Key findings

3.2.1.Top investment pockets
3.2.2.Top winning strategies

3.3.Porter’s five forces analysis
3.4.Top player positioning, 2020
3.5.Market dynamics

3.5.1.Drivers

3.5.1.1.Technological advancements in molecular imaging
3.5.1.2.Increase in demand for noninvasive small animal imaging techniques
3.5.1.3.Increase in funding for preclinical research by both private and public organizations

3.5.2.Restraints

3.5.2.1.High cost for installation and stringent regulations for preclinical research

3.5.3.Opportunity

3.5.3.1.Lucrative opportunities in emerging markets

3.6.Impact analysis
3.7.Impact analysis of COVID-19 on the optical preclinical imaging marke

CHAPTER 4:OPTICAL PRECLINICAL IMAGING MARKET, BY MODALITY

4.1.Overview

4.1.1.Market size and forecast

4.2.Bioluminescence & fluorescence imaging systems

4.2.1.Key market trends, growth factors, and opportunities
4.2.2.Market size and forecast, by region
4.2.3.Market analysis, by country

4.3.Standalone fluorescence imaging systems

4.3.1.Key market trends, growth factors, and opportunities
4.3.2.Market size and forecast, by region
4.3.3.Market analysis, by country

4.4.Optical + X-ray & optical + CT

4.4.1.Key market trends, growth factors, and opportunities
4.4.2.Market size and forecast, by region
4.4.3.Market analysis, by country

CHAPTER 5:OPTICAL PRECLINICAL IMAGING MARKET, BY END USER

5.1.Overview

5.1.1.Market size and forecast

5.2.Pharma & biotech companies

5.2.1.Market size and forecast, by region
5.2.2.Market analysis, by country

5.3.Academic & government research institutes

5.3.1.Market size and forecast, by region
5.3.2.Market analysis, by country

5.4.Contract research organizations

5.4.1.Market size and forecast, by region
5.4.2.Market analysis, by country

CHAPTER 6:OPTICAL PRECLINICAL IMAGING MARKET, BY REGION

6.1.Overview

6.1.1.Market size and forecast

6.2.North America

6.2.1.Key market trends, growth factors, and opportunities
6.2.2.North America optical preclinical imaging market, by modality
6.2.3.North America optical preclinical imaging market, by end user
6.2.4.Market size and forecast, by country

6.2.4.1.U.S.

6.2.4.1.1.U.S. optical preclinical imaging market, by modality
6.2.4.1.2.U.S. optical preclinical imaging market, by end user

6.2.4.2.Canada

6.2.4.2.1.Canada optical preclinical imaging market, by modality
6.2.4.2.2.Canada optical preclinical imaging market, by end user

6.2.4.3.Mexico

6.2.4.3.1.Mexico optical preclinical imaging market, by modality
6.2.4.3.2.Mexico optical preclinical imaging market, by end user

6.3.Europe

6.3.1.Key market trends, growth factors, and opportunities
6.3.2.Europe optical preclinical imaging market, by modality
6.3.3.Europe optical preclinical imaging market, by end user
6.3.4.Market size and forecast, by country

6.3.4.1.Germany

6.3.4.1.1.Germany optical preclinical imaging market, by modality
6.3.4.1.2.Germany optical preclinical imaging market, by end user

6.3.4.2.France

6.3.4.2.1.France optical preclinical imaging market, by modality
6.3.4.2.2.France optical preclinical imaging market, by end user

6.3.4.3.UK

6.3.4.3.1.UK optical preclinical imaging market, by modality
6.3.4.3.2.UK optical preclinical imaging market, by end user

6.3.4.4.Italy

6.3.4.4.1.Italy optical preclinical imaging market, by modality
6.3.4.4.2.Italy optical preclinical imaging market, by end user

6.3.4.5.Spain

6.3.4.5.1.Spain optical preclinical imaging market, by modality
6.3.4.5.2.Spain optical preclinical imaging market, by end user

6.3.4.6.Rest of Europe

6.3.4.6.1.Rest of Europe optical preclinical imaging market, by modality
6.3.4.6.2.Rest of Europe optical preclinical imaging market, by end user

6.4.Asia-Pacific

6.4.1.Key market trends, growth factors, and opportunities
6.4.2.Asia-Pacific optical preclinical imaging market, by modality
6.4.3.Asia-Pacific optical preclinical imaging market, by end user
6.4.4.Market size and forecast, by country

6.4.4.1.Japan

6.4.4.1.1.Japan optical preclinical imaging market, by modality
6.4.4.1.2.Japan optical preclinical imaging market, by end user

6.4.4.2.China

6.4.4.2.1.China optical preclinical imaging market, by modality
6.4.4.2.2.China optical preclinical imaging market, by end user

6.4.4.3.Australia

6.4.4.3.1.Australia optical preclinical imaging market, by modality
6.4.4.3.2.Australia optical preclinical imaging market, by end user

6.4.4.4.India

6.4.4.4.1.India optical preclinical imaging market, by modality
6.4.4.4.2.India optical preclinical imaging market, by end user

6.4.4.5.South Korea

6.4.4.5.1.South Korea optical preclinical imaging market, by modality
6.4.4.5.2.South Korea optical preclinical imaging market, by end user

6.4.4.6.Rest of Asia-Pacific

6.4.4.6.1.Rest of Asia-Pacific optical preclinical imaging market, by modality
6.4.4.6.2.Rest of Asia-Pacific optical preclinical imaging market, by end user

6.5.LAMEA

6.5.1.Key market trends, growth factors, and opportunities
6.5.2.LAMEA optical preclinical imaging market, by modality
6.5.3.LAMEA optical preclinical imaging market, by end user
6.5.4.LAMEA optical preclinical imaging market, by country

6.5.4.1.Latin America

6.5.4.1.1.Latin America optical preclinical imaging market, by modality
6.5.4.1.2.Latin America optical preclinical imaging market, by end user

6.5.4.2.Middle East & Africa

6.5.4.2.1.Middle East & Africa optical preclinical imaging market, by modality
6.5.4.2.2.Middle East & Africa optical preclinical imaging market, by end user

CHAPTER 7:COMPANY PROFILES

7.1.BERTHOLD TECHNOLOGIES GMBH & CO.KG

7.1.1.Company overview
7.1.2.Company snapshot
7.1.3.Operating business segments
7.1.4.Product portfolio

7.2.ENDRESS+HAUSER AG (ANALYTIK JENA GMBH)

7.2.1.Company overview
7.2.2.Company snapshot
7.2.3.Operating business segments
7.2.4.Product portfolio

7.3.FUJIFILM HOLDINGS CORPORATION (FUJIFILM VISUALSONICS INC.)

7.3.1.Company overview
7.3.2.Company snapshot
7.3.3.Operating business segments
7.3.4.Product portfolio
7.3.5.Business performance

7.4.LI-COR BIOSCIENCES, INC.

7.4.1.Company overview
7.4.2.Company snapshot
7.4.3.Operating business segments
7.4.4.Product portfolio

7.5.MILTENYI BIOTEC B.V. & CO. KG

7.5.1.Company overview
7.5.2.Company snapshot
7.5.3.Operating business segments
7.5.4.Product portfolio
7.5.5.Key strategic moves and developments

7.6.PERKINELMER INC.

7.6.1.Company overview
7.6.2.Company snapshot
7.6.3.Operating business segments
7.6.4.Product portfolio
7.6.5.Business performance

7.7.RIGAKU CORPORATION (MILABS B.V.)

7.7.1.Company overview
7.7.2.Company snapshot
7.7.3.Operating business segments
7.7.4.Product portfolio
7.7.5.Key strategic moves and developments

7.8.TRIFOIL IMAGING, INC.

7.8.1.Company overview
7.8.2.Company snapshot
7.8.3.Operating business segment
7.8.4.Product portfolio
7.8.5.Key strategic moves and developments

7.9.VIEWORKS CO., LTD.

7.9.1.Company overview
7.9.2.Company snapshot
7.9.3.Operating business segments
7.9.4.Product portfolio
7.9.5.Business performance
7.9.6.Key strategic moves and developments

7.10.VILBER SMART IMAGING LTD.

7.10.1.Company overview
7.10.2.Company snapshot
7.10.3.Operating business segments
7.10.4.Product portfolio

 LIST OF TABLES

TABLE 01.GLOBAL OPTICAL PRECLINICAL IMAGING MARKET, BY MODALITY, 2020–2030 ($MILLION)
TABLE 02.OPTICAL BIOLUMINESCENCE & FLUORESCENCE IMAGING MARKET, BY REGION, 2020-2030 ($MILLION)
TABLE 03.OPTICAL STANDALONE FLUORESCENCE IMAGING MARKET, BY REGION, 2020-2030 ($MILLION)
TABLE 04.OPTICAL + X-RAY & OPTICAL + CT IMAGING MARKET, BY REGION, 2020-2030 ($MILLION)
TABLE 05.OPTICAL PRECLINICAL IMAGING MARKET, BY END USER, 2020–2030 ($MILLION)
TABLE 06.OPTICAL PRECLINICAL IMAGING MARKET FOR PHARMA & BIOTECH COMPANIES, BY REGION, 2020–2030 ($MILLION)
TABLE 07.OPTICAL PRECLINICAL IMAGING MARKET FOR RESEARCH INSTITUTES, BY REGION, 2020–2030($MILLION)
TABLE 08.OPTICAL PRECLINICAL IMAGING MARKET FOR CONTRACT RESEARCH ORGANIZATIONS, BY REGION, 2020–2030($MILLION)
TABLE 09.OPTICAL PRECLINICAL IMAGING MARKET, BY REGION, 2020-2030 ($MILLION)
TABLE 10.NORTH AMERICA OPTICAL PRECLINICAL IMAGING MARKET, BY MODALITY, 2020-2030 ($MILLION)
TABLE 11.NORTH AMERICA OPTICAL PRECLINICAL IMAGING MARKET, BY END USER, 2020-2030 ($MILLION)
TABLE 12.NORTH AMERICA OPTICAL PRECLINICAL IMAGING MARKET, BY COUNTRY, 2020-2030 ($MILLION)
TABLE 13.U.S. OPTICAL PRECLINICAL IMAGING MARKET, BY MODALITY, 2020-2030 ($MILLION)
TABLE 14.U.S. OPTICAL PRECLINICAL IMAGING MARKET, BY END USER, 2020-2030 ($MILLION)
TABLE 15.CANADA OPTICAL PRECLINICAL IMAGING MARKET, BY MODALITY, 2020-2030 ($MILLION)
TABLE 16.CANADA OPTICAL PRECLINICAL IMAGING MARKET, BY END USER, 2020-2030 ($MILLION)
TABLE 17.MEXICO OPTICAL PRECLINICAL IMAGING MARKET, BY MODALITY, 2020-2030 ($MILLION)
TABLE 18.MEXICO OPTICAL PRECLINICAL IMAGING MARKET, BY END USER, 2020-2030 ($MILLION)
TABLE 19.EUROPE OPTICAL PRECLINICAL IMAGING MARKET, BY MODALITY, 2020-2030 ($MILLION)
TABLE 20.EUROPE OPTICAL PRECLINICAL IMAGING MARKET, BY END USER, 2020-2030 ($MILLION)
TABLE 21.EUROPE OPTICAL PRECLINICAL IMAGING MARKET, BY COUNTRY, 2020-2030 ($MILLION)
TABLE 22.GERMANY OPTICAL PRECLINICAL IMAGING MARKET, BY MODALITY, 2020-2030 ($MILLION)
TABLE 23.GERMANY OPTICAL PRECLINICAL IMAGING MARKET, BY END USER, 2020-2030 ($MILLION)
TABLE 24.FRANCE OPTICAL PRECLINICAL IMAGING MARKET, BY MODALITY, 2020-2030 ($MILLION)
TABLE 25.FRANCE OPTICAL PRECLINICAL IMAGING MARKET, BY END USER, 2020-2030 ($MILLION)
TABLE 26.UK OPTICAL PRECLINICAL IMAGING MARKET, BY MODALITY, 2020-2030 ($MILLION)
TABLE 27.UK OPTICAL PRECLINICAL IMAGING MARKET, BY END USER, 2020-2030 ($MILLION)
TABLE 28.ITALY OPTICAL PRECLINICAL IMAGING MARKET, BY MODALITY, 2020-2030 ($MILLION)
TABLE 29.ITALY OPTICAL PRECLINICAL IMAGING MARKET, BY END USER, 2020-2030 ($MILLION)
TABLE 30.SPAIN OPTICAL PRECLINICAL IMAGING MARKET, BY MODALITY, 2020-2030 ($MILLION)
TABLE 31.SPAIN OPTICAL PRECLINICAL IMAGING MARKET, BY END USER, 2020-2030 ($MILLION)
TABLE 32.REST OF EUROPE OPTICAL PRECLINICAL IMAGING MARKET, BY MODALITY, 2020-2030 ($MILLION)
TABLE 33.REST OF EUROPE OPTICAL PRECLINICAL IMAGING MARKET, BY END USER, 2020-2030 ($MILLION)
TABLE 34.ASIA-PACIFIC OPTICAL PRECLINICAL IMAGING MARKET, BY MODALITY, 2020-2030 ($MILLION)
TABLE 35.ASIA-PACIFIC OPTICAL PRECLINICAL IMAGING MARKET, BY END USER, 2020-2030 ($MILLION)
TABLE 36.ASIA-PACIFIC OPTICAL PRECLINICAL IMAGING MARKET, BY COUNTRY, 2020-2030 ($MILLION)
TABLE 37.JAPAN OPTICAL PRECLINICAL IMAGING MARKET, BY MODALITY, 2020-2030 ($MILLION)
TABLE 38.JAPAN OPTICAL PRECLINICAL IMAGING MARKET, BY END USER, 2020-2030 ($MILLION)
TABLE 39.CHINA OPTICAL PRECLINICAL IMAGING MARKET, BY MODALITY, 2020-2030 ($MILLION)
TABLE 40.CHINA OPTICAL PRECLINICAL IMAGING MARKET, BY END USER, 2020-2030 ($MILLION)
TABLE 41.AUSTRALIA OPTICAL PRECLINICAL IMAGING MARKET, BY MODALITY, 2020-2030 ($MILLION)
TABLE 42.AUSTRALIA OPTICAL PRECLINICAL IMAGING MARKET, BY END USER, 2020-2030 ($MILLION)
TABLE 43.INDIA OPTICAL PRECLINICAL IMAGING MARKET, BY MODALITY, 2020-2030 ($MILLION)
TABLE 44.INDIA OPTICAL PRECLINICAL IMAGING MARKET, BY END USER, 2020-2030 ($MILLION)
TABLE 45.SOUTH KOREA OPTICAL PRECLINICAL IMAGING MARKET, BY MODALITY, 2020-2030 ($MILLION)
TABLE 46.SOUTH KOREA OPTICAL PRECLINICAL IMAGING MARKET, BY END USER, 2020-2030 ($MILLION)
TABLE 47.REST OF ASIA-PACIFIC OPTICAL PRECLINICAL IMAGING MARKET, BY MODALITY, 2020-2030 ($MILLION)
TABLE 48.REST OF ASIA-PACIFIC OPTICAL PRECLINICAL IMAGING MARKET, BY END USER, 2020-2030 ($MILLION)
TABLE 49.LAMEA OPTICAL PRECLINICAL IMAGING MARKET, BY MODALITY, 2020-2030 ($MILLION)
TABLE 50.LAMEA OPTICAL PRECLINICAL IMAGING MARKET, BY END USER, 2020-2030 ($MILLION)
TABLE 51.LAMEA OPTICAL PRECLINICAL IMAGING MARKET, BY COUNTRY, 2020-2030 ($MILLION)
TABLE 52.LATIN AMERICA OPTICAL PRECLINICAL IMAGING MARKET, BY MODALITY, 2020-2030 ($MILLION)
TABLE 53.LATIN AMERICA OPTICAL PRECLINICAL IMAGING MARKET, BY END USER, 2020-2030 ($MILLION)
TABLE 54.MIDDLE EAST & AFRICA OPTICAL PRECLINICAL IMAGING MARKET, BY MODALITY, 2020-2030 ($MILLION)
TABLE 55.MIDDLE EAST & AFRICA OPTICAL PRECLINICAL IMAGING MARKET, BY END USER, 2020-2030 ($MILLION)
TABLE 56.BERTHOLD: COMPANY SNAPSHOT
TABLE 57.BERTHOLD: OPERATING SEGMENTS
TABLE 58.BERTHOLD HEALTHCARE: PRODUCT PORTFOLIO
TABLE 59.ENDRESS: COMPANY SNAPSHOT
TABLE 60.ENDRESS: OPERATING SEGMENTS
TABLE 61.ENDRESS: PRODUCT PORTFOLIO
TABLE 62.FUJIFILM: COMPANY SNAPSHOT
TABLE 63.FUJIFILM: OPERATING BUSINESS SEGMENTS
TABLE 64.FUJIFILM: PRODUCT PORTFOLIO
TABLE 65.LI-COR: SNAPSHOT
TABLE 66.LI-COR: OPERATING SEGMENTS
TABLE 67.LI-COR: PRODUCT PORTFOLIO
TABLE 68.MILTENYI: COMPANY SNAPSHOT
TABLE 69.MILTENYI: OPERATING SEGMENTS
TABLE 70.MILTENYI: PRODUCT PORTFOLIO
TABLE 71.MILTENYI: KEY DEVELOPMENTS
TABLE 72.PERKINELMER: COMPANY SNAPSHOT
TABLE 73.PERKINELMER: OPERATING SEGMENTS
TABLE 74.PERKIN ELMER: PRODUCT PORTFOLIO
TABLE 75.RIGAKU: COMPANY SNAPSHOT
TABLE 76.RIGAKU: OPERATING SEGMENTS
TABLE 77.RIGAKU: PRODUCT PORTFOLIO
TABLE 78.RIGAKU: KEY DEVELOPMENTS
TABLE 79.TRIFOIL: COMPANY SNAPSHOT
TABLE 80.TRIFOIL: OPERATING SEGMENTS
TABLE 81.TRIFOIL: PRODUCT PORTFOLIO
TABLE 82.TRIFOIL: KEY DEVELOPMENTS
TABLE 83.VIEWORKS: COMPANY SNAPSHOT
TABLE 84.VIEWORKS: OPERATING SEGMENTS
TABLE 85.VIEWORKS: PRODUCT PORTFOLIO
TABLE 86.VIEWORKS: KEY DEVELOPMENTS
TABLE 87.VILBER: COMPANY SNAPSHOT
TABLE 88.VILBER: OPERATING SEGMENTS
TABLE 89.VILBER: PRODUCT PORTFOLIO

 LIST OF FIGURES

FIGURE 01.GLOBAL OPTICAL PRECLINICAL IMAGING MARKET SEGMENTATION
FIGURE 02.TOP INVESTMENT POCKETS
FIGURE 03.TOP WINNING STRATEGIES, BY YEAR, 2019–2021
FIGURE 04.TOP WINNING STRATEGIES, BY DEVELOPMENT, 2019–2021
FIGURE 05.TOP WINNING STRATEGIES, BY COMPANY, 2019–2021
FIGURE 06.MODERATE BARGAINING POWER OF SUPPLIERS
FIGURE 07.MODERATE BARGAINING POWER OF BUYERS
FIGURE 08.MODERATE THREAT OF SUBSTITUTES
FIGURE 09.HIGH THREAT OF NEW ENTRANTS
FIGURE 10.HIGH INTENSITY OF RIVALRY
FIGURE 11.TOP PLAYER POSITIONING, 2020
FIGURE 12.IMPACT ANALYSIS
FIGURE 13.COMPARATIVE ANALYSIS OF OPTICAL BIOLUMINESCENCE & FLUORESCENCE IMAGING SYSTEMS MARKET,  BY COUNTRY, 2020-2030 (%)
FIGURE 14.COMPARATIVE ANALYSIS OF OPTICAL STANDALONE FLUORESCENCE IMAGING MARKET, BY COUNTRY,  2020-2030 (%)
FIGURE 15.COMPARATIVE ANALYSIS OF OPTICAL + X-RAY & OPTICAL + CT IMAGING MARKET, BY COUNTRY, 2020-2030 (%)
FIGURE 16.COMPARATIVE ANALYSIS OF OPTICAL PRECLINICAL IMAGING MARKET FOR PHARMA & BIOTECH COMPANIES, BY COUNTRY, 2020-2030 (%)
FIGURE 17.COMPARATIVE ANALYSIS OF OPTICAL PRECLINICAL IMAGING MARKET FOR ACADEMIC & GOVERNMENT RESEARCH INSTITUTES, BY COUNTRY, 2020-2030 (%)
FIGURE 18.COMPARATIVE ANALYSIS OF OPTICAL PRECLINICAL IMAGING MARKET FOR CONTRACT RESEARCH ORGANIZATIONS, BY COUNTRY, 2020-2030 (%)
FIGURE 19.FUJIFILM: NET SALES, 2019–2021 ($MILLION)
FIGURE 20.FUJIFILM: REVENUE SHARE BY SEGMENT, 2021 (%)
FIGURE 21.FUJIFILM: REVENUE SHARE BY REGION, 2021(%)
FIGURE 22.PERKIN ELMER: NET SALES, 2018–2020 ($MILLION)
FIGURE 23.PERKIN ELMER: REVENUE SHARE, BY SEGMENT, 2020 (%)
FIGURE 24.PERKIN ELMER: REVENUE SHARE, BY REGION, 2020 (%)
FIGURE 25.VIEWORKS: NET SALES, 2018–2020 ($MILLION)


This section provides the opinions of the top level CXOs in the global optical preclinical imaging market. According to the insights of CXOs, increase in use of biomedical research to prevent and treat diseases that cause illness and death in people and in animals as well as rise in use of minimally invasive advanced imaging technologies are expected to significantly boost the growth of the optical preclinical imaging market.

The CXOs further added that rise in drug discovery & development, introduction of novel drugs for the treatment of emerging new diseases, personalization of treatments notably contributes toward the market growth. Furthermore, the use of preclinical in vivo imaging facilitates translational medicine by de-risking drug candidates, significantly shortening time to clinic and lowering costs while maximizing biological understanding.

Moreover, careful quantitative modelling and de-risking of each new molecular entity (NME) during development streamline pipeline management and make it easier to decide whether to terminate or accelerate studies. Part of this modelling helps to guarantee that sensible choices in animal models, sensors, and imaging modalities are adopted as early as feasible in the preclinical phases, decreasing time and expense in each phase of development.

The market gains interest of healthcare companies, owing to surge in R&D and increase in focus in adoption of optical preclinical imaging in research centers.

North America is expected to witness highest growth, in terms of revenue, owing to firmly established distribution channel, robust R&D infrastructure for life science researches, rapid adoption of novel molecular imaging technologies, presence of key players, and advancements in healthcare investments. Asia-Pacific was the second largest contributor to the market in 2020, and is expected to register the fastest CAGR during the forecast period, due to the continuous government support for pharmaceutical and biotechnology R&D, increase in public–private investments, and rise in number of translational research activities in the healthcare sector.

PURCHASE OPTIONS

Call or Email us

U.S.-Canada Toll-free: +1-800-792-5285
Int'l : +1-503-894-6022
Europe : +44-845-528-1300
Email : help@alliedmarketresearch.com
 
FREQUENTLY ASKED QUESTIONS?

A. The total market value of optical preclinical imaging market is $516.10 million in 2020.

A. The forecast period for optical preclinical imaging market is 2021 to 2030

A. The market value of optical preclinical imaging market in 2021 is $544.10 million.

A. The base year is 2020 in optical preclinical imaging market

A. Top companies such as Berthold Technologies GmbH & Co.KG, Bruker Corporation, Endress+Hauser (Analytik Jena US LLC), Mediso Ltd., Miltenyi Biotec, MR Solutions, PerkinElmer, Inc., Rigaku Corporation (MILabs B.V.), TriFoil Imaging and Vieworks Co., Ltd held a high market position in 2020.

A. Bioluminescence & fluorescence imaging systems segment dominated the global market in 2020, and expected to continue this trend throughout the forecast period due to the technological advancements and integration of systems and thus is expected to drive the segment

A. Increase in demand for non-invasive small animal imaging techniques, advanced infrastructure for research & development and investments in healthcare is anticipated to drive the market in the forecast period.

A. North America is projected to account for a major share of the global optical preclinical imaging market during the forecast period. U.S. dominated the North America rise in investments for drug discovery in the R & D sector due to presence of key players across the country.

Looking for Customization?

 Customization Request

Have a Question?

 Speak with Analyst

Any Confusion?

 Inquire Before Buying

Have a glance of the Report

  Request Sample
RELATED TAGS

Purchase Full Report of
Optical Preclinical Imaging Market

Start reading instantly.
This Report and over 66,965+ more Reports, Available with Avenue Library. T&C*.

  • Online Only
  • $3,712
  • Online cloud access only
  • Restricted print, copy, paste & download
  • Read only
  • Free industry update
    (Within 180 days)
  • Free report update in next update cycle
    (Nov 2022 - Nov 2023)
  • Data Pack
  • $4,125
  • Restricted to one authorized user
  • One print only
  • Available in
    Excel
  • Free industry update
    (Within 180 days)
  •   Free report update in next update cycle
    (Nov 2022 - Nov 2023)
  • Single User
  • $5,769
  • Restricted to one authorized user
  • One print only
  • Available in
    PDF
  • Free industry update
    (Within 180 days)
  •   Free report update in next update cycle
    (Nov 2022 - Nov 2023)
  • Five Users
  • $6,929
  • Limited to five authorized users
  • Print upto five copies
  • Available in
    PDF
  • Free industry update
    (Within 180 days)
  •   Free report update in next update cycle
    (Nov 2022 - Nov 2023)
  • Enterprise
    License/PDF

  • $10,663
  • Unlimited
    within
    company/enterprise
  • Available in Excel & PDF
  • Free industry update
    (Within 180 days)
  •   Free report update in next update cycle
    (Nov 2022 - Nov 2023)
  • Library
    Membership

  • $999 $ 1,175
    Per User/ Per month/ Billed annually
  • Published Content
    E-access
  • Company Profiles
    E-access
  • Newly Added Content Access
  • 10 PDF
    Downloads
  • 5 Excel Data
    Pack Downloads
  • 250 Company Profiles PDF Downloads
  • Buy Now

*Taxes/Fees, if applicable will be added during checkout. All prices in USD

RELATED REPORTS
 

Why Allied Market Research?


Infallible Methodology

To ensure high-level data integrity, accurate analysis, and impeccable forecasts

Analyst Support

For complete satisfaction

Customization

On-demand customization of scope of the report to exactly meet your needs

TARGETED MARKET VIEW

Targeted market view to provide pertinent information and save time of readers

Get fresh content delivered

Get insights on topics that are crucial for your business. Stay abreast of your interest areas.

Get Industry Data Alerts

Why Allied Market Research?

Infallible Methodology

To ensure high-level data integrity, accurate analysis, and impeccable forecasts

Analyst Support

For complete satisfaction

Customization

On-demand customization of scope of the report to exactly meet your needs

TARGETED MARKET VIEW

Targeted market view to provide pertinent information and save time of readers