0
New
New
2023
Organic Pesticides Market

Organic Pesticides Market

by Product Type (Biomedical, Microbial, Botanical, Mineral), by Type (Insecticide, Fungicide, Herbicide, Others), by Form (Liquid, Powder), by Application (Gardening, Fruits and Vegetables, Cereals and Pulses, Nursery, Others): Global Opportunity Analysis and Industry Forecast, 2023-2032

Report Code: A02778
Jun 2023 | Pages: 408
Tables: 272
Charts: 68
  • Formats*:

  • pdf

    Single User License, Five User
    License & Enterprise User License

  • xls

    Data Pack Excel License

  • ppt

    It comes with the additional cost
    of $2500.00 contact sales.


Organic Pesticides Market Research, 2032

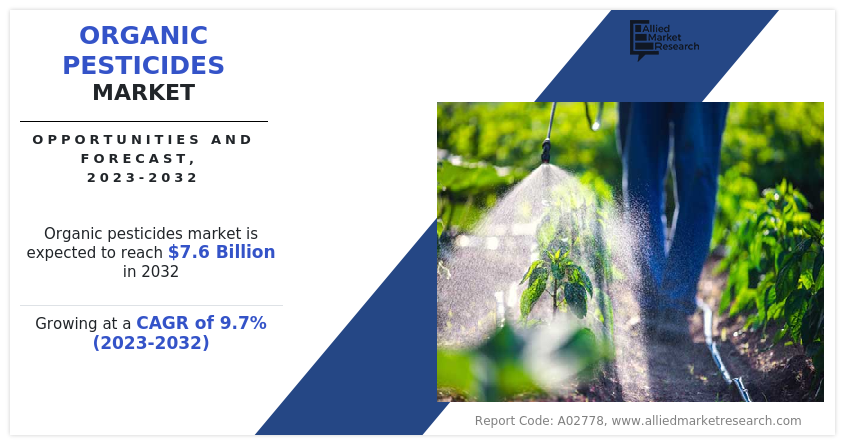
The global organic pesticides market was valued at $3.0 billion in 2022, and is projected to reach $7.6 billion by 2032, growing at a CAGR of 9.7% from 2023 to 2032.

Governments and regulatory agencies in many countries are promoting sustainable agriculture and organic farming practices. They are implementing stricter regulations on the use of synthetic chemical pesticides and providing incentives and support for organic farming. This regulatory support has contributed to the increased demand for organic pesticides as farmers seek alternatives to conventional pesticides.

Report Key Highlighters

  • The report provides competitive dynamics by evaluating business segments, product portfolios, target market revenue, geographical presence and key strategic developments by prominent manufacturers.
  • The organic pesticides market is fragmented in nature among prominent companies such as Andermatt Group AG, Bayer AG, Certis USA LLC, Dow Inc., Mark Agri Genetics Pvt. Ltd., Parry America, Inc., Redox Industries Limited., and Sikkoindia..
  • The study contains qualitative information such as the market dynamics (drivers, restraints, challenges, and opportunities), key regulation analysis, pricing analysis, and Porter’s Five Force Analysis across North America, Europe, Asia-Pacific, LAMEA regions.
  • Latest trends in global organic pesticides market such as undergoing R&D activities, regulatory guidelines, and government initiatives are analyzed across 16 countries in 4 different regions.
  • More than 3,800 organic pesticides-related product literatures, industry releases, annual reports, and other such documents of key industry participants along with authentic industry journals and government websites have been reviewed for generating high-value industry insights for global organic pesticides market.
Organic Pesticides Market

Organic pesticides, also known as biopesticides or natural pesticides, are substances derived from natural sources that are used to control pests and diseases in agriculture and gardening. Unlike synthetic chemical pesticides, organic pesticides are derived from plants, animals, minerals, or microorganisms and are considered to be more environment friendly and less harmful to humans and other non-target organisms. There are several types of organic pesticides that are used for pest management practices such as botanical pesticides, microbial pesticides, mineral-based pesticides, and others.

One of the primary drivers of the organic pesticides market is the changing consumer preferences towards organic products. Consumers are becoming more conscious about their health and the environment, leading to an increased demand for organic food and other organic products. Organic pesticides are seen as a safer alternative to synthetic pesticides, as they are derived from natural sources and are less likely to leave harmful residues on crops. The growing consumer demand for organic products has prompted farmers to adopt organic farming practices, including the use of organic pesticides, to meet the market demand.

Moreover, growing environmental concerns regarding the negative impacts of synthetic pesticides on ecosystems and biodiversity have fueled the demand for organic pesticides. Synthetic pesticides have been found to contaminate soil, water bodies, and air, leading to adverse effects on non-target organisms, such as pollinators and beneficial insects. Organic pesticides, on the other hand, are less persistent in the environment and have minimal impacts on non-target species. The increasing awareness about the importance of biodiversity conservation and sustainable agricultural practices has motivated farmers to shift towards organic pesticides to minimize their ecological footprint.

However, one of the primary restraints of the organic pesticides market is the perceived limitations in efficacy and availability compared to synthetic pesticides. Organic pesticides have a slower mode of action and may not provide the same level of control over pests and diseases as their synthetic counterparts. This can pose challenges for farmers, especially in regions with high pest pressure or for crops that are highly susceptible to certain pests. Additionally, the availability of organic pesticides may be limited compared to synthetic pesticides, which are often more widely produced and readily accessible in the market.

On the contrary, governments worldwide are increasingly supporting organic agriculture through various initiatives, policies, and financial incentives. These measures create opportunities for the organic pesticides market. Governments may provide financial support, tax incentives, or subsidies to farmers transitioning to organic farming practices, including the use of organic pesticides. Furthermore, regulations and certification programs that promote organic farming can provide a favorable environment for the growth of the organic pesticides market. Government support can help overcome some of the financial barriers associated with organic farming and make organic pesticides more accessible to farmers.

The organic pesticides market is segmented on the basis of product type, type, form, application, and region. On the basis of product type, the market is categorized into biochemical, microbial, botanical, and mineral. By type, the market is segregated into insecticide, fungicide, herbicide, and others. By form, the market is segregated into liquid or spray and powder or granules. By application, it is divided into gardening, fruits & vegetables, cereals & pulses, nursery, and others. Region-wise, the market is studied across North America, Europe, Asia-Pacific, and LAMEA.
Organic Pesticides Market

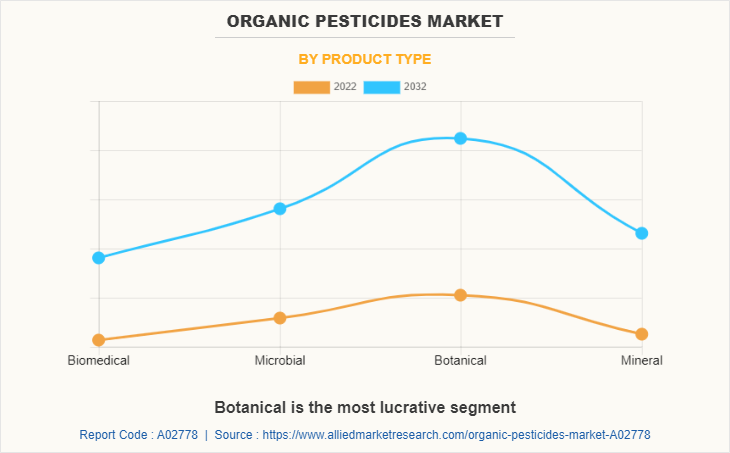
In 2022, the botanical segment was the largest revenue generator, and is anticipated to grow at a CAGR of 9.9% during the forecast period. There is a growing consumer preference for organic food and agricultural products due to concerns about synthetic pesticide residues and environmental sustainability. Botanical organic pesticides are an important type of pesticide for farmers practicing organic agriculture, as they align with organic certification standards and are considered compatible with organic farming practices. This may act as one of the key drivers responsible for the growth of the organic pesticides market for botanical types. Furthermore, consumers are becoming more conscious of the impact of their purchasing choices on the environment and their health. The demand for pesticide-free or low-residue food products is increasing, driving the adoption of botanical organic pesticides as a safer and more sustainable pest control option.
Organic Pesticides Market

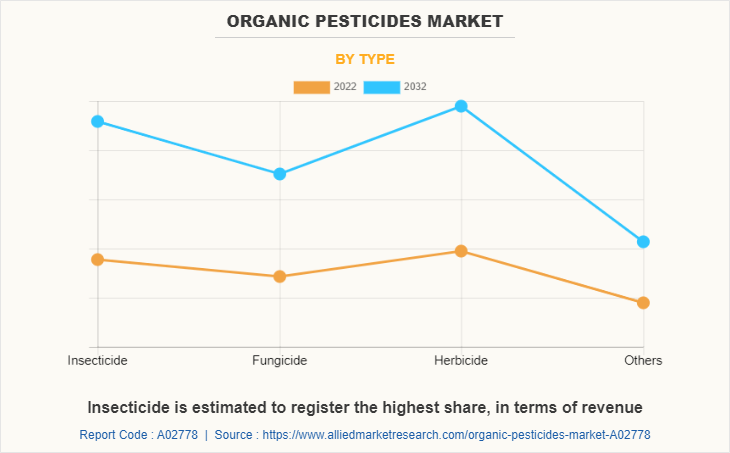
In 2022, the herbicide segment was the largest revenue generator, and is anticipated to grow at a CAGR of 9.7% during the forecast period. Prolonged and extensive use of synthetic chemical herbicides has led to the development of herbicide-resistant weed populations. Organic herbicides with different modes of action offer alternative control options for weeds that have developed resistance to conventional herbicides. Their use supports resistance management strategies and helps maintain effective weed control in agricultural systems. Additionally, the adoption of organic herbicides helps ensure effective weed management while meeting the growing demand for environmentally friendly and healthier food options. These factors may drive the demand for organic herbicides in the organic pesticides market.
Organic Pesticides Market

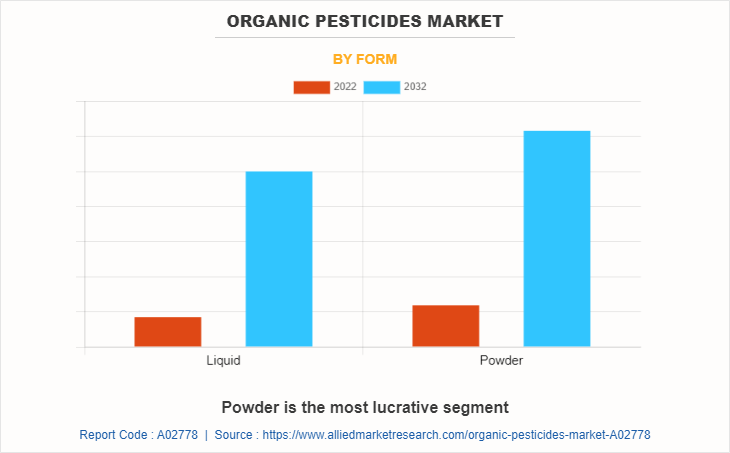
In 2022, the powder segment was the largest revenue generator, and is anticipated to grow at a CAGR of 9.9% during the forecast period. Powder or granule form of organic pesticides possess various significant characteristics such as application flexibility, long-lasting effect, enhanced stability, ease of storage & transportation, reduced risk of drift, and others which in turn has surged the demand for powdered or granulated form of organic pesticides; thus, fueling the market growth. Furthermore, powder or granule organic pesticides can contribute to water conservation and efficiency in pest management. Unlike liquid formulations that require dilution with water, powder or granule pesticides can be directly applied to the target area without the need for additional water. This can be advantageous in regions facing water scarcity or in situations where water use needs to be minimized. This factor may further aid the demand for organic pesticides market for powder or granules type.
Organic Pesticides Market

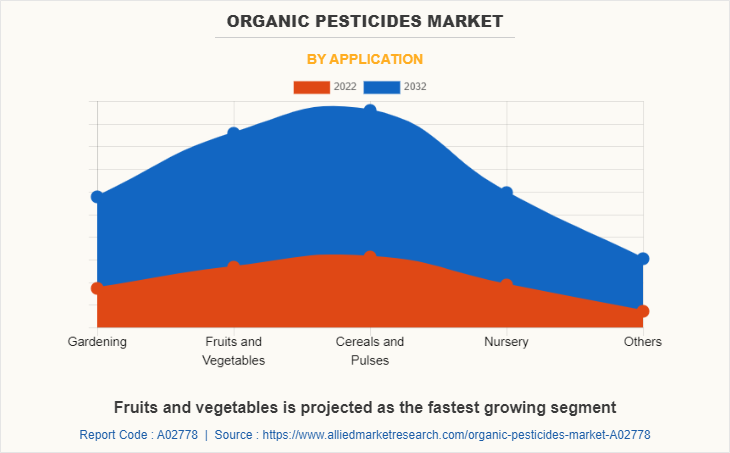
By application, the cereals and pulses segment dominated the global market in 2022, and is anticipated to grow at a CAGR of 9.9% during forecast period. he demand for organic cereals and pulses is increasing as consumers become more conscious of the chemicals used in food production. Using organic pesticides in cereal and pulse cultivation offers a pesticide-free or low-residue option for consumers who prioritize food safety and seek healthier alternatives. This may act as one of the key drivers responsible for the growth of the organic pesticides market for cereals and pulses.

Furthermore, there is a growing interest in organic and sustainable farming practices across the agricultural industry. Farmers and consumers alike recognize the importance of reducing the environmental impact of farming and preserving natural resources. The use of organic pesticides in cereal and pulse cultivation aligns with these principles, as organic farming promotes soil health, biodiversity, and the overall sustainability of agricultural ecosystems. These factors altogether may surge the demand for organic pesticides for growing cereals and pulses.
Organic Pesticides Market

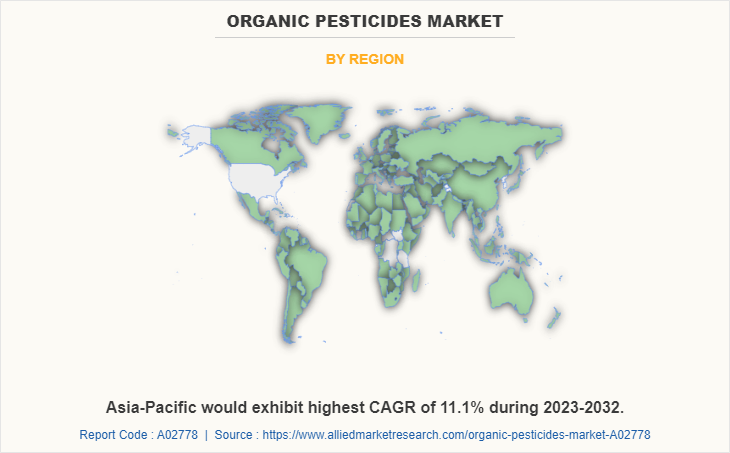
The Asia-Pacific organic pesticides market size is projected to grow at the highest CAGR of 11.1% during the forecast period and accounted for 24.5% of organic pesticides market share in 2022. The organic pesticides market in the Asia-Pacific region has been growing rapidly due to increasing consumer awareness and demand for organic products. The region has a large population, and consumers are becoming more conscious of the potential health and environmental impacts of synthetic pesticides. As a result, there is a growing preference for organic alternatives. According to a report by Research and Markets, the Asia-Pacific organic pesticides market is expected to grow at a compound annual growth rate (CAGR) of around 7% during the forecast period.

Moreover, organic agriculture is gaining momentum in the Asia-Pacific region, creating opportunities for the organic pesticides market. Governments in countries such as India, China, and Japan are promoting organic farming through policy support, subsidies, and awareness campaigns. For instance, India has implemented the National Program for Organic Production (NPOP) to facilitate the adoption of organic farming practices. The increasing adoption of organic agriculture practices provides a favorable environment for the growth of the organic pesticides market in the region.

The global organic pesticides market profiles leading players that include Andermatt Group AG, Arysta LifeScience Corporation., Bayer AG, Certis USA LLC, Dow Inc., Mark Agri Genetics Pvt. Ltd., Parry America, Inc., Redox Industries Limited., Satpura Bio Fertiliser India Pvt Ltd, and Sikkoindia. The global organic pesticides market report provides in-depth competitive analysis as well as profiles of these major players.

Key Benefits For Stakeholders

  • This report provides a quantitative analysis of the market segments, current trends, estimations, and dynamics of the organic pesticides market analysis from 2022 to 2032 to identify the prevailing organic pesticides market opportunities.
  • The market research is offered along with information related to key drivers, restraints, and opportunities.
  • Porter's five forces analysis highlights the potency of buyers and suppliers to enable stakeholders make profit-oriented business decisions and strengthen their supplier-buyer network.
  • In-depth analysis of the organic pesticides market segmentation assists to determine the prevailing market opportunities.
  • Major countries in each region are mapped according to their revenue contribution to the global market.
  • Market player positioning facilitates benchmarking and provides a clear understanding of the present position of the market players.
  • The report includes the analysis of the regional as well as global organic pesticides market trends, key players, market segments, application areas, and market growth strategies.

Organic Pesticides Market Report Highlights

Aspects Details
Market Size By 2032 USD 7.6 billion
Growth Rate CAGR of 9.7%
Forecast period 2022 - 2032
Report Pages 408
By Product Type
  • Biomedical
  • Microbial
  • Botanical
  • Mineral
By Application
  • Gardening
  • Fruits and Vegetables
  • Cereals and Pulses
  • Nursery
  • Others
By Type
  • Insecticide
  • Fungicide
  • Herbicide
  • Others
By Form
  • Liquid
  • Powder
By Region
  • North America  (U.S., Canada, Mexico)
  • Europe  (Germany, UK, France, Spain, Italy, Rest of Europe)
  • Asia-Pacific  (China, India, Japan, South Korea, Australia, Rest of Asia-Pacific)
  • LAMEA  (Brazil, Saudi Arabia, South Africa, Rest of LAMEA)
Key Market Players Satpura Bio Fertiliser India Pvt Ltd, Andermatt Group AG, Mark Agri Genetics Pvt. Ltd., Redox Industries Limited., Certis USA LLC, sikkoindia, Parry America, Inc., Bayer AG, Dow Inc., Arysta LifeScience Corporation.

Analyst Review

The global organic pesticides market is expected to exhibit high growth potential, owing to its use in the pest control in organic farming, integrated pest management (IPM), gardening and landscaping, public spaces & parks, pest control in organic food storage, and others. Moreover, there has been a significant rise in consumer demand for organic food products. Consumers are becoming more aware of the potential health and environmental risks associated with synthetic chemical pesticides used in conventional agriculture. As a result, farmers are increasingly transitioning to organic farming practices, which require the use of organic pesticides to meet certification standards.

Furthermore, governments and regulatory agencies in many countries are promoting sustainable agriculture and organic farming practices. They are implementing stricter regulations on the use of synthetic chemical pesticides and providing incentives and support for organic farming. This regulatory support has contributed to the increased demand for organic pesticides as farmers seek alternatives to conventional pesticides.

CXOs further added that sustained economic growth coupled with rapid development of organic farming sector may lead the organic pigments market to witness a significant growth.


  • CHAPTER 1: INTRODUCTION

    • 1.1. Report description

    • 1.2. Key market segments

    • 1.3. Key benefits to the stakeholders

    • 1.4. Research Methodology

      • 1.4.1. Primary research

      • 1.4.2. Secondary research

      • 1.4.3. Analyst tools and models

  • CHAPTER 2: EXECUTIVE SUMMARY

    • 2.1. CXO Perspective

  • CHAPTER 3: MARKET OVERVIEW

    • 3.1. Market definition and scope

    • 3.2. Key findings

      • 3.2.1. Top impacting factors

      • 3.2.2. Top investment pockets

    • 3.3. Porter’s five forces analysis

      • 3.3.1. High bargaining power of suppliers

      • 3.3.2. Moderate threat of new entrants

      • 3.3.3. Moderate threat of substitutes

      • 3.3.4. Moderate intensity of rivalry

      • 3.3.5. Moderate bargaining power of buyers

    • 3.4. Market dynamics

      • 3.4.1. Drivers

        • 3.4.1.1. Increasing consumer preferences
        • 3.4.1.2. Government Regulations
        • 3.4.1.3. Growing environmental concerns
        • 3.4.1.4. Technological Advancements

      • 3.4.2. Restraints

        • 3.4.2.1. Limitations in efficacy and availability
        • 3.4.2.2. Higher costs

      • 3.4.3. Opportunities

        • 3.4.3.1. Government supports and incentives
        • 3.4.3.2. Sustainable agriculture practices

    • 3.5. COVID-19 Impact Analysis on the market

    • 3.6. Pricing Analysis

    • 3.7. Value Chain Analysis

    • 3.8. Regulatory Guidelines

    • 3.9. Patent Landscape

  • CHAPTER 4: ORGANIC PESTICIDES MARKET, BY PRODUCT TYPE

    • 4.1. Overview

      • 4.1.1. Market size and forecast

    • 4.2. Biomedical

      • 4.2.1. Key market trends, growth factors and opportunities

      • 4.2.2. Market size and forecast, by region

      • 4.2.3. Market share analysis by country

    • 4.3. Microbial

      • 4.3.1. Key market trends, growth factors and opportunities

      • 4.3.2. Market size and forecast, by region

      • 4.3.3. Market share analysis by country

    • 4.4. Botanical

      • 4.4.1. Key market trends, growth factors and opportunities

      • 4.4.2. Market size and forecast, by region

      • 4.4.3. Market share analysis by country

    • 4.5. Mineral

      • 4.5.1. Key market trends, growth factors and opportunities

      • 4.5.2. Market size and forecast, by region

      • 4.5.3. Market share analysis by country

  • CHAPTER 5: ORGANIC PESTICIDES MARKET, BY TYPE

    • 5.1. Overview

      • 5.1.1. Market size and forecast

    • 5.2. Insecticide

      • 5.2.1. Key market trends, growth factors and opportunities

      • 5.2.2. Market size and forecast, by region

      • 5.2.3. Market share analysis by country

    • 5.3. Fungicide

      • 5.3.1. Key market trends, growth factors and opportunities

      • 5.3.2. Market size and forecast, by region

      • 5.3.3. Market share analysis by country

    • 5.4. Herbicide

      • 5.4.1. Key market trends, growth factors and opportunities

      • 5.4.2. Market size and forecast, by region

      • 5.4.3. Market share analysis by country

    • 5.5. Others

      • 5.5.1. Key market trends, growth factors and opportunities

      • 5.5.2. Market size and forecast, by region

      • 5.5.3. Market share analysis by country

  • CHAPTER 6: ORGANIC PESTICIDES MARKET, BY FORM

    • 6.1. Overview

      • 6.1.1. Market size and forecast

    • 6.2. Liquid

      • 6.2.1. Key market trends, growth factors and opportunities

      • 6.2.2. Market size and forecast, by region

      • 6.2.3. Market share analysis by country

    • 6.3. Powder

      • 6.3.1. Key market trends, growth factors and opportunities

      • 6.3.2. Market size and forecast, by region

      • 6.3.3. Market share analysis by country

  • CHAPTER 7: ORGANIC PESTICIDES MARKET, BY APPLICATION

    • 7.1. Overview

      • 7.1.1. Market size and forecast

    • 7.2. Gardening

      • 7.2.1. Key market trends, growth factors and opportunities

      • 7.2.2. Market size and forecast, by region

      • 7.2.3. Market share analysis by country

    • 7.3. Fruits and Vegetables

      • 7.3.1. Key market trends, growth factors and opportunities

      • 7.3.2. Market size and forecast, by region

      • 7.3.3. Market share analysis by country

    • 7.4. Cereals and Pulses

      • 7.4.1. Key market trends, growth factors and opportunities

      • 7.4.2. Market size and forecast, by region

      • 7.4.3. Market share analysis by country

    • 7.5. Nursery

      • 7.5.1. Key market trends, growth factors and opportunities

      • 7.5.2. Market size and forecast, by region

      • 7.5.3. Market share analysis by country

    • 7.6. Others

      • 7.6.1. Key market trends, growth factors and opportunities

      • 7.6.2. Market size and forecast, by region

      • 7.6.3. Market share analysis by country

  • CHAPTER 8: ORGANIC PESTICIDES MARKET, BY REGION

    • 8.1. Overview

      • 8.1.1. Market size and forecast By Region

    • 8.2. North America

      • 8.2.1. Key trends and opportunities

      • 8.2.2. Market size and forecast, by Product Type

      • 8.2.3. Market size and forecast, by Type

      • 8.2.4. Market size and forecast, by Form

      • 8.2.5. Market size and forecast, by Application

      • 8.2.6. Market size and forecast, by country

        • 8.2.6.1. U.S.
          • 8.2.6.1.1. Key market trends, growth factors and opportunities
          • 8.2.6.1.2. Market size and forecast, by Product Type
          • 8.2.6.1.3. Market size and forecast, by Type
          • 8.2.6.1.4. Market size and forecast, by Form
          • 8.2.6.1.5. Market size and forecast, by Application
        • 8.2.6.2. Canada
          • 8.2.6.2.1. Key market trends, growth factors and opportunities
          • 8.2.6.2.2. Market size and forecast, by Product Type
          • 8.2.6.2.3. Market size and forecast, by Type
          • 8.2.6.2.4. Market size and forecast, by Form
          • 8.2.6.2.5. Market size and forecast, by Application
        • 8.2.6.3. Mexico
          • 8.2.6.3.1. Key market trends, growth factors and opportunities
          • 8.2.6.3.2. Market size and forecast, by Product Type
          • 8.2.6.3.3. Market size and forecast, by Type
          • 8.2.6.3.4. Market size and forecast, by Form
          • 8.2.6.3.5. Market size and forecast, by Application
    • 8.3. Europe

      • 8.3.1. Key trends and opportunities

      • 8.3.2. Market size and forecast, by Product Type

      • 8.3.3. Market size and forecast, by Type

      • 8.3.4. Market size and forecast, by Form

      • 8.3.5. Market size and forecast, by Application

      • 8.3.6. Market size and forecast, by country

        • 8.3.6.1. Germany
          • 8.3.6.1.1. Key market trends, growth factors and opportunities
          • 8.3.6.1.2. Market size and forecast, by Product Type
          • 8.3.6.1.3. Market size and forecast, by Type
          • 8.3.6.1.4. Market size and forecast, by Form
          • 8.3.6.1.5. Market size and forecast, by Application
        • 8.3.6.2. UK
          • 8.3.6.2.1. Key market trends, growth factors and opportunities
          • 8.3.6.2.2. Market size and forecast, by Product Type
          • 8.3.6.2.3. Market size and forecast, by Type
          • 8.3.6.2.4. Market size and forecast, by Form
          • 8.3.6.2.5. Market size and forecast, by Application
        • 8.3.6.3. France
          • 8.3.6.3.1. Key market trends, growth factors and opportunities
          • 8.3.6.3.2. Market size and forecast, by Product Type
          • 8.3.6.3.3. Market size and forecast, by Type
          • 8.3.6.3.4. Market size and forecast, by Form
          • 8.3.6.3.5. Market size and forecast, by Application
        • 8.3.6.4. Spain
          • 8.3.6.4.1. Key market trends, growth factors and opportunities
          • 8.3.6.4.2. Market size and forecast, by Product Type
          • 8.3.6.4.3. Market size and forecast, by Type
          • 8.3.6.4.4. Market size and forecast, by Form
          • 8.3.6.4.5. Market size and forecast, by Application
        • 8.3.6.5. Italy
          • 8.3.6.5.1. Key market trends, growth factors and opportunities
          • 8.3.6.5.2. Market size and forecast, by Product Type
          • 8.3.6.5.3. Market size and forecast, by Type
          • 8.3.6.5.4. Market size and forecast, by Form
          • 8.3.6.5.5. Market size and forecast, by Application
        • 8.3.6.6. Rest of Europe
          • 8.3.6.6.1. Key market trends, growth factors and opportunities
          • 8.3.6.6.2. Market size and forecast, by Product Type
          • 8.3.6.6.3. Market size and forecast, by Type
          • 8.3.6.6.4. Market size and forecast, by Form
          • 8.3.6.6.5. Market size and forecast, by Application
    • 8.4. Asia-Pacific

      • 8.4.1. Key trends and opportunities

      • 8.4.2. Market size and forecast, by Product Type

      • 8.4.3. Market size and forecast, by Type

      • 8.4.4. Market size and forecast, by Form

      • 8.4.5. Market size and forecast, by Application

      • 8.4.6. Market size and forecast, by country

        • 8.4.6.1. China
          • 8.4.6.1.1. Key market trends, growth factors and opportunities
          • 8.4.6.1.2. Market size and forecast, by Product Type
          • 8.4.6.1.3. Market size and forecast, by Type
          • 8.4.6.1.4. Market size and forecast, by Form
          • 8.4.6.1.5. Market size and forecast, by Application
        • 8.4.6.2. India
          • 8.4.6.2.1. Key market trends, growth factors and opportunities
          • 8.4.6.2.2. Market size and forecast, by Product Type
          • 8.4.6.2.3. Market size and forecast, by Type
          • 8.4.6.2.4. Market size and forecast, by Form
          • 8.4.6.2.5. Market size and forecast, by Application
        • 8.4.6.3. Japan
          • 8.4.6.3.1. Key market trends, growth factors and opportunities
          • 8.4.6.3.2. Market size and forecast, by Product Type
          • 8.4.6.3.3. Market size and forecast, by Type
          • 8.4.6.3.4. Market size and forecast, by Form
          • 8.4.6.3.5. Market size and forecast, by Application
        • 8.4.6.4. South Korea
          • 8.4.6.4.1. Key market trends, growth factors and opportunities
          • 8.4.6.4.2. Market size and forecast, by Product Type
          • 8.4.6.4.3. Market size and forecast, by Type
          • 8.4.6.4.4. Market size and forecast, by Form
          • 8.4.6.4.5. Market size and forecast, by Application
        • 8.4.6.5. Australia
          • 8.4.6.5.1. Key market trends, growth factors and opportunities
          • 8.4.6.5.2. Market size and forecast, by Product Type
          • 8.4.6.5.3. Market size and forecast, by Type
          • 8.4.6.5.4. Market size and forecast, by Form
          • 8.4.6.5.5. Market size and forecast, by Application
        • 8.4.6.6. Rest of Asia-Pacific
          • 8.4.6.6.1. Key market trends, growth factors and opportunities
          • 8.4.6.6.2. Market size and forecast, by Product Type
          • 8.4.6.6.3. Market size and forecast, by Type
          • 8.4.6.6.4. Market size and forecast, by Form
          • 8.4.6.6.5. Market size and forecast, by Application
    • 8.5. LAMEA

      • 8.5.1. Key trends and opportunities

      • 8.5.2. Market size and forecast, by Product Type

      • 8.5.3. Market size and forecast, by Type

      • 8.5.4. Market size and forecast, by Form

      • 8.5.5. Market size and forecast, by Application

      • 8.5.6. Market size and forecast, by country

        • 8.5.6.1. Brazil
          • 8.5.6.1.1. Key market trends, growth factors and opportunities
          • 8.5.6.1.2. Market size and forecast, by Product Type
          • 8.5.6.1.3. Market size and forecast, by Type
          • 8.5.6.1.4. Market size and forecast, by Form
          • 8.5.6.1.5. Market size and forecast, by Application
        • 8.5.6.2. Saudi Arabia
          • 8.5.6.2.1. Key market trends, growth factors and opportunities
          • 8.5.6.2.2. Market size and forecast, by Product Type
          • 8.5.6.2.3. Market size and forecast, by Type
          • 8.5.6.2.4. Market size and forecast, by Form
          • 8.5.6.2.5. Market size and forecast, by Application
        • 8.5.6.3. South Africa
          • 8.5.6.3.1. Key market trends, growth factors and opportunities
          • 8.5.6.3.2. Market size and forecast, by Product Type
          • 8.5.6.3.3. Market size and forecast, by Type
          • 8.5.6.3.4. Market size and forecast, by Form
          • 8.5.6.3.5. Market size and forecast, by Application
        • 8.5.6.4. Rest of LAMEA
          • 8.5.6.4.1. Key market trends, growth factors and opportunities
          • 8.5.6.4.2. Market size and forecast, by Product Type
          • 8.5.6.4.3. Market size and forecast, by Type
          • 8.5.6.4.4. Market size and forecast, by Form
          • 8.5.6.4.5. Market size and forecast, by Application
  • CHAPTER 9: COMPETITIVE LANDSCAPE

    • 9.1. Introduction

    • 9.2. Top winning strategies

    • 9.3. Product Mapping of Top 10 Player

    • 9.4. Competitive Dashboard

    • 9.5. Competitive Heatmap

    • 9.6. Top player positioning, 2022

  • CHAPTER 10: COMPANY PROFILES

    • 10.1. Certis USA LLC

      • 10.1.1. Company overview

      • 10.1.2. Key Executives

      • 10.1.3. Company snapshot

      • 10.1.4. Operating business segments

      • 10.1.5. Product portfolio

    • 10.2. Andermatt Group AG

      • 10.2.1. Company overview

      • 10.2.2. Key Executives

      • 10.2.3. Company snapshot

      • 10.2.4. Operating business segments

      • 10.2.5. Product portfolio

    • 10.3. Mark Agri Genetics Pvt. Ltd.

      • 10.3.1. Company overview

      • 10.3.2. Key Executives

      • 10.3.3. Company snapshot

      • 10.3.4. Operating business segments

      • 10.3.5. Product portfolio

    • 10.4. Parry America, Inc.

      • 10.4.1. Company overview

      • 10.4.2. Key Executives

      • 10.4.3. Company snapshot

      • 10.4.4. Operating business segments

      • 10.4.5. Product portfolio

    • 10.5. Bayer AG

      • 10.5.1. Company overview

      • 10.5.2. Key Executives

      • 10.5.3. Company snapshot

      • 10.5.4. Operating business segments

      • 10.5.5. Product portfolio

      • 10.5.6. Business performance

    • 10.6. Arysta LifeScience Corporation.

      • 10.6.1. Company overview

      • 10.6.2. Key Executives

      • 10.6.3. Company snapshot

      • 10.6.4. Operating business segments

      • 10.6.5. Product portfolio

    • 10.7. sikkoindia

      • 10.7.1. Company overview

      • 10.7.2. Key Executives

      • 10.7.3. Company snapshot

      • 10.7.4. Operating business segments

      • 10.7.5. Product portfolio

      • 10.7.6. Business performance

    • 10.8. Redox Industries Limited.

      • 10.8.1. Company overview

      • 10.8.2. Key Executives

      • 10.8.3. Company snapshot

      • 10.8.4. Operating business segments

      • 10.8.5. Product portfolio

    • 10.9. Satpura Bio Fertiliser India Pvt Ltd

      • 10.9.1. Company overview

      • 10.9.2. Key Executives

      • 10.9.3. Company snapshot

      • 10.9.4. Operating business segments

      • 10.9.5. Product portfolio

    • 10.10. Dow Inc.

      • 10.10.1. Company overview

      • 10.10.2. Key Executives

      • 10.10.3. Company snapshot

      • 10.10.4. Operating business segments

      • 10.10.5. Product portfolio

      • 10.10.6. Business performance

  • LIST OF TABLES

  • TABLE 01. GLOBAL ORGANIC PESTICIDES MARKET, BY PRODUCT TYPE, 2022-2032 ($MILLION)
    TABLE 02. GLOBAL ORGANIC PESTICIDES MARKET, BY PRODUCT TYPE, 2022-2032 (KILOTON)
    TABLE 03. ORGANIC PESTICIDES MARKET FOR BIOMEDICAL, BY REGION, 2022-2032 ($MILLION)
    TABLE 04. ORGANIC PESTICIDES MARKET FOR BIOMEDICAL, BY REGION, 2022-2032 (KILOTON)
    TABLE 05. ORGANIC PESTICIDES MARKET FOR MICROBIAL, BY REGION, 2022-2032 ($MILLION)
    TABLE 06. ORGANIC PESTICIDES MARKET FOR MICROBIAL, BY REGION, 2022-2032 (KILOTON)
    TABLE 07. ORGANIC PESTICIDES MARKET FOR BOTANICAL, BY REGION, 2022-2032 ($MILLION)
    TABLE 08. ORGANIC PESTICIDES MARKET FOR BOTANICAL, BY REGION, 2022-2032 (KILOTON)
    TABLE 09. ORGANIC PESTICIDES MARKET FOR MINERAL, BY REGION, 2022-2032 ($MILLION)
    TABLE 10. ORGANIC PESTICIDES MARKET FOR MINERAL, BY REGION, 2022-2032 (KILOTON)
    TABLE 11. GLOBAL ORGANIC PESTICIDES MARKET, BY TYPE, 2022-2032 ($MILLION)
    TABLE 12. GLOBAL ORGANIC PESTICIDES MARKET, BY TYPE, 2022-2032 (KILOTON)
    TABLE 13. ORGANIC PESTICIDES MARKET FOR INSECTICIDE, BY REGION, 2022-2032 ($MILLION)
    TABLE 14. ORGANIC PESTICIDES MARKET FOR INSECTICIDE, BY REGION, 2022-2032 (KILOTON)
    TABLE 15. ORGANIC PESTICIDES MARKET FOR FUNGICIDE, BY REGION, 2022-2032 ($MILLION)
    TABLE 16. ORGANIC PESTICIDES MARKET FOR FUNGICIDE, BY REGION, 2022-2032 (KILOTON)
    TABLE 17. ORGANIC PESTICIDES MARKET FOR HERBICIDE, BY REGION, 2022-2032 ($MILLION)
    TABLE 18. ORGANIC PESTICIDES MARKET FOR HERBICIDE, BY REGION, 2022-2032 (KILOTON)
    TABLE 19. ORGANIC PESTICIDES MARKET FOR OTHERS, BY REGION, 2022-2032 ($MILLION)
    TABLE 20. ORGANIC PESTICIDES MARKET FOR OTHERS, BY REGION, 2022-2032 (KILOTON)
    TABLE 21. GLOBAL ORGANIC PESTICIDES MARKET, BY FORM, 2022-2032 ($MILLION)
    TABLE 22. GLOBAL ORGANIC PESTICIDES MARKET, BY FORM, 2022-2032 (KILOTON)
    TABLE 23. ORGANIC PESTICIDES MARKET FOR LIQUID, BY REGION, 2022-2032 ($MILLION)
    TABLE 24. ORGANIC PESTICIDES MARKET FOR LIQUID, BY REGION, 2022-2032 (KILOTON)
    TABLE 25. ORGANIC PESTICIDES MARKET FOR POWDER, BY REGION, 2022-2032 ($MILLION)
    TABLE 26. ORGANIC PESTICIDES MARKET FOR POWDER, BY REGION, 2022-2032 (KILOTON)
    TABLE 27. GLOBAL ORGANIC PESTICIDES MARKET, BY APPLICATION, 2022-2032 ($MILLION)
    TABLE 28. GLOBAL ORGANIC PESTICIDES MARKET, BY APPLICATION, 2022-2032 (KILOTON)
    TABLE 29. ORGANIC PESTICIDES MARKET FOR GARDENING, BY REGION, 2022-2032 ($MILLION)
    TABLE 30. ORGANIC PESTICIDES MARKET FOR GARDENING, BY REGION, 2022-2032 (KILOTON)
    TABLE 31. ORGANIC PESTICIDES MARKET FOR FRUITS AND VEGETABLES, BY REGION, 2022-2032 ($MILLION)
    TABLE 32. ORGANIC PESTICIDES MARKET FOR FRUITS AND VEGETABLES, BY REGION, 2022-2032 (KILOTON)
    TABLE 33. ORGANIC PESTICIDES MARKET FOR CEREALS AND PULSES, BY REGION, 2022-2032 ($MILLION)
    TABLE 34. ORGANIC PESTICIDES MARKET FOR CEREALS AND PULSES, BY REGION, 2022-2032 (KILOTON)
    TABLE 35. ORGANIC PESTICIDES MARKET FOR NURSERY, BY REGION, 2022-2032 ($MILLION)
    TABLE 36. ORGANIC PESTICIDES MARKET FOR NURSERY, BY REGION, 2022-2032 (KILOTON)
    TABLE 37. ORGANIC PESTICIDES MARKET FOR OTHERS, BY REGION, 2022-2032 ($MILLION)
    TABLE 38. ORGANIC PESTICIDES MARKET FOR OTHERS, BY REGION, 2022-2032 (KILOTON)
    TABLE 39. ORGANIC PESTICIDES MARKET, BY REGION, 2022-2032 ($MILLION)
    TABLE 40. ORGANIC PESTICIDES MARKET, BY REGION, 2022-2032 (KILOTON)
    TABLE 41. NORTH AMERICA ORGANIC PESTICIDES MARKET, BY PRODUCT TYPE, 2022-2032 ($MILLION)
    TABLE 42. NORTH AMERICA ORGANIC PESTICIDES MARKET, BY PRODUCT TYPE, 2022-2032 (KILOTON)
    TABLE 43. NORTH AMERICA ORGANIC PESTICIDES MARKET, BY TYPE, 2022-2032 ($MILLION)
    TABLE 44. NORTH AMERICA ORGANIC PESTICIDES MARKET, BY TYPE, 2022-2032 (KILOTON)
    TABLE 45. NORTH AMERICA ORGANIC PESTICIDES MARKET, BY FORM, 2022-2032 ($MILLION)
    TABLE 46. NORTH AMERICA ORGANIC PESTICIDES MARKET, BY FORM, 2022-2032 (KILOTON)
    TABLE 47. NORTH AMERICA ORGANIC PESTICIDES MARKET, BY APPLICATION, 2022-2032 ($MILLION)
    TABLE 48. NORTH AMERICA ORGANIC PESTICIDES MARKET, BY APPLICATION, 2022-2032 (KILOTON)
    TABLE 49. NORTH AMERICA ORGANIC PESTICIDES MARKET, BY COUNTRY, 2022-2032 ($MILLION)
    TABLE 50. NORTH AMERICA ORGANIC PESTICIDES MARKET, BY COUNTRY, 2022-2032 (KILOTON)
    TABLE 51. U.S. ORGANIC PESTICIDES MARKET, BY PRODUCT TYPE, 2022-2032 ($MILLION)
    TABLE 52. U.S. ORGANIC PESTICIDES MARKET, BY PRODUCT TYPE, 2022-2032 (KILOTON)
    TABLE 53. U.S. ORGANIC PESTICIDES MARKET, BY TYPE, 2022-2032 ($MILLION)
    TABLE 54. U.S. ORGANIC PESTICIDES MARKET, BY TYPE, 2022-2032 (KILOTON)
    TABLE 55. U.S. ORGANIC PESTICIDES MARKET, BY FORM, 2022-2032 ($MILLION)
    TABLE 56. U.S. ORGANIC PESTICIDES MARKET, BY FORM, 2022-2032 (KILOTON)
    TABLE 57. U.S. ORGANIC PESTICIDES MARKET, BY APPLICATION, 2022-2032 ($MILLION)
    TABLE 58. U.S. ORGANIC PESTICIDES MARKET, BY APPLICATION, 2022-2032 (KILOTON)
    TABLE 59. CANADA ORGANIC PESTICIDES MARKET, BY PRODUCT TYPE, 2022-2032 ($MILLION)
    TABLE 60. CANADA ORGANIC PESTICIDES MARKET, BY PRODUCT TYPE, 2022-2032 (KILOTON)
    TABLE 61. CANADA ORGANIC PESTICIDES MARKET, BY TYPE, 2022-2032 ($MILLION)
    TABLE 62. CANADA ORGANIC PESTICIDES MARKET, BY TYPE, 2022-2032 (KILOTON)
    TABLE 63. CANADA ORGANIC PESTICIDES MARKET, BY FORM, 2022-2032 ($MILLION)
    TABLE 64. CANADA ORGANIC PESTICIDES MARKET, BY FORM, 2022-2032 (KILOTON)
    TABLE 65. CANADA ORGANIC PESTICIDES MARKET, BY APPLICATION, 2022-2032 ($MILLION)
    TABLE 66. CANADA ORGANIC PESTICIDES MARKET, BY APPLICATION, 2022-2032 (KILOTON)
    TABLE 67. MEXICO ORGANIC PESTICIDES MARKET, BY PRODUCT TYPE, 2022-2032 ($MILLION)
    TABLE 68. MEXICO ORGANIC PESTICIDES MARKET, BY PRODUCT TYPE, 2022-2032 (KILOTON)
    TABLE 69. MEXICO ORGANIC PESTICIDES MARKET, BY TYPE, 2022-2032 ($MILLION)
    TABLE 70. MEXICO ORGANIC PESTICIDES MARKET, BY TYPE, 2022-2032 (KILOTON)
    TABLE 71. MEXICO ORGANIC PESTICIDES MARKET, BY FORM, 2022-2032 ($MILLION)
    TABLE 72. MEXICO ORGANIC PESTICIDES MARKET, BY FORM, 2022-2032 (KILOTON)
    TABLE 73. MEXICO ORGANIC PESTICIDES MARKET, BY APPLICATION, 2022-2032 ($MILLION)
    TABLE 74. MEXICO ORGANIC PESTICIDES MARKET, BY APPLICATION, 2022-2032 (KILOTON)
    TABLE 75. EUROPE ORGANIC PESTICIDES MARKET, BY PRODUCT TYPE, 2022-2032 ($MILLION)
    TABLE 76. EUROPE ORGANIC PESTICIDES MARKET, BY PRODUCT TYPE, 2022-2032 (KILOTON)
    TABLE 77. EUROPE ORGANIC PESTICIDES MARKET, BY TYPE, 2022-2032 ($MILLION)
    TABLE 78. EUROPE ORGANIC PESTICIDES MARKET, BY TYPE, 2022-2032 (KILOTON)
    TABLE 79. EUROPE ORGANIC PESTICIDES MARKET, BY FORM, 2022-2032 ($MILLION)
    TABLE 80. EUROPE ORGANIC PESTICIDES MARKET, BY FORM, 2022-2032 (KILOTON)
    TABLE 81. EUROPE ORGANIC PESTICIDES MARKET, BY APPLICATION, 2022-2032 ($MILLION)
    TABLE 82. EUROPE ORGANIC PESTICIDES MARKET, BY APPLICATION, 2022-2032 (KILOTON)
    TABLE 83. EUROPE ORGANIC PESTICIDES MARKET, BY COUNTRY, 2022-2032 ($MILLION)
    TABLE 84. EUROPE ORGANIC PESTICIDES MARKET, BY COUNTRY, 2022-2032 (KILOTON)
    TABLE 85. GERMANY ORGANIC PESTICIDES MARKET, BY PRODUCT TYPE, 2022-2032 ($MILLION)
    TABLE 86. GERMANY ORGANIC PESTICIDES MARKET, BY PRODUCT TYPE, 2022-2032 (KILOTON)
    TABLE 87. GERMANY ORGANIC PESTICIDES MARKET, BY TYPE, 2022-2032 ($MILLION)
    TABLE 88. GERMANY ORGANIC PESTICIDES MARKET, BY TYPE, 2022-2032 (KILOTON)
    TABLE 89. GERMANY ORGANIC PESTICIDES MARKET, BY FORM, 2022-2032 ($MILLION)
    TABLE 90. GERMANY ORGANIC PESTICIDES MARKET, BY FORM, 2022-2032 (KILOTON)
    TABLE 91. GERMANY ORGANIC PESTICIDES MARKET, BY APPLICATION, 2022-2032 ($MILLION)
    TABLE 92. GERMANY ORGANIC PESTICIDES MARKET, BY APPLICATION, 2022-2032 (KILOTON)
    TABLE 93. UK ORGANIC PESTICIDES MARKET, BY PRODUCT TYPE, 2022-2032 ($MILLION)
    TABLE 94. UK ORGANIC PESTICIDES MARKET, BY PRODUCT TYPE, 2022-2032 (KILOTON)
    TABLE 95. UK ORGANIC PESTICIDES MARKET, BY TYPE, 2022-2032 ($MILLION)
    TABLE 96. UK ORGANIC PESTICIDES MARKET, BY TYPE, 2022-2032 (KILOTON)
    TABLE 97. UK ORGANIC PESTICIDES MARKET, BY FORM, 2022-2032 ($MILLION)
    TABLE 98. UK ORGANIC PESTICIDES MARKET, BY FORM, 2022-2032 (KILOTON)
    TABLE 99. UK ORGANIC PESTICIDES MARKET, BY APPLICATION, 2022-2032 ($MILLION)
    TABLE 100. UK ORGANIC PESTICIDES MARKET, BY APPLICATION, 2022-2032 (KILOTON)
    TABLE 101. FRANCE ORGANIC PESTICIDES MARKET, BY PRODUCT TYPE, 2022-2032 ($MILLION)
    TABLE 102. FRANCE ORGANIC PESTICIDES MARKET, BY PRODUCT TYPE, 2022-2032 (KILOTON)
    TABLE 103. FRANCE ORGANIC PESTICIDES MARKET, BY TYPE, 2022-2032 ($MILLION)
    TABLE 104. FRANCE ORGANIC PESTICIDES MARKET, BY TYPE, 2022-2032 (KILOTON)
    TABLE 105. FRANCE ORGANIC PESTICIDES MARKET, BY FORM, 2022-2032 ($MILLION)
    TABLE 106. FRANCE ORGANIC PESTICIDES MARKET, BY FORM, 2022-2032 (KILOTON)
    TABLE 107. FRANCE ORGANIC PESTICIDES MARKET, BY APPLICATION, 2022-2032 ($MILLION)
    TABLE 108. FRANCE ORGANIC PESTICIDES MARKET, BY APPLICATION, 2022-2032 (KILOTON)
    TABLE 109. SPAIN ORGANIC PESTICIDES MARKET, BY PRODUCT TYPE, 2022-2032 ($MILLION)
    TABLE 110. SPAIN ORGANIC PESTICIDES MARKET, BY PRODUCT TYPE, 2022-2032 (KILOTON)
    TABLE 111. SPAIN ORGANIC PESTICIDES MARKET, BY TYPE, 2022-2032 ($MILLION)
    TABLE 112. SPAIN ORGANIC PESTICIDES MARKET, BY TYPE, 2022-2032 (KILOTON)
    TABLE 113. SPAIN ORGANIC PESTICIDES MARKET, BY FORM, 2022-2032 ($MILLION)
    TABLE 114. SPAIN ORGANIC PESTICIDES MARKET, BY FORM, 2022-2032 (KILOTON)
    TABLE 115. SPAIN ORGANIC PESTICIDES MARKET, BY APPLICATION, 2022-2032 ($MILLION)
    TABLE 116. SPAIN ORGANIC PESTICIDES MARKET, BY APPLICATION, 2022-2032 (KILOTON)
    TABLE 117. ITALY ORGANIC PESTICIDES MARKET, BY PRODUCT TYPE, 2022-2032 ($MILLION)
    TABLE 118. ITALY ORGANIC PESTICIDES MARKET, BY PRODUCT TYPE, 2022-2032 (KILOTON)
    TABLE 119. ITALY ORGANIC PESTICIDES MARKET, BY TYPE, 2022-2032 ($MILLION)
    TABLE 120. ITALY ORGANIC PESTICIDES MARKET, BY TYPE, 2022-2032 (KILOTON)
    TABLE 121. ITALY ORGANIC PESTICIDES MARKET, BY FORM, 2022-2032 ($MILLION)
    TABLE 122. ITALY ORGANIC PESTICIDES MARKET, BY FORM, 2022-2032 (KILOTON)
    TABLE 123. ITALY ORGANIC PESTICIDES MARKET, BY APPLICATION, 2022-2032 ($MILLION)
    TABLE 124. ITALY ORGANIC PESTICIDES MARKET, BY APPLICATION, 2022-2032 (KILOTON)
    TABLE 125. REST OF EUROPE ORGANIC PESTICIDES MARKET, BY PRODUCT TYPE, 2022-2032 ($MILLION)
    TABLE 126. REST OF EUROPE ORGANIC PESTICIDES MARKET, BY PRODUCT TYPE, 2022-2032 (KILOTON)
    TABLE 127. REST OF EUROPE ORGANIC PESTICIDES MARKET, BY TYPE, 2022-2032 ($MILLION)
    TABLE 128. REST OF EUROPE ORGANIC PESTICIDES MARKET, BY TYPE, 2022-2032 (KILOTON)
    TABLE 129. REST OF EUROPE ORGANIC PESTICIDES MARKET, BY FORM, 2022-2032 ($MILLION)
    TABLE 130. REST OF EUROPE ORGANIC PESTICIDES MARKET, BY FORM, 2022-2032 (KILOTON)
    TABLE 131. REST OF EUROPE ORGANIC PESTICIDES MARKET, BY APPLICATION, 2022-2032 ($MILLION)
    TABLE 132. REST OF EUROPE ORGANIC PESTICIDES MARKET, BY APPLICATION, 2022-2032 (KILOTON)
    TABLE 133. ASIA-PACIFIC ORGANIC PESTICIDES MARKET, BY PRODUCT TYPE, 2022-2032 ($MILLION)
    TABLE 134. ASIA-PACIFIC ORGANIC PESTICIDES MARKET, BY PRODUCT TYPE, 2022-2032 (KILOTON)
    TABLE 135. ASIA-PACIFIC ORGANIC PESTICIDES MARKET, BY TYPE, 2022-2032 ($MILLION)
    TABLE 136. ASIA-PACIFIC ORGANIC PESTICIDES MARKET, BY TYPE, 2022-2032 (KILOTON)
    TABLE 137. ASIA-PACIFIC ORGANIC PESTICIDES MARKET, BY FORM, 2022-2032 ($MILLION)
    TABLE 138. ASIA-PACIFIC ORGANIC PESTICIDES MARKET, BY FORM, 2022-2032 (KILOTON)
    TABLE 139. ASIA-PACIFIC ORGANIC PESTICIDES MARKET, BY APPLICATION, 2022-2032 ($MILLION)
    TABLE 140. ASIA-PACIFIC ORGANIC PESTICIDES MARKET, BY APPLICATION, 2022-2032 (KILOTON)
    TABLE 141. ASIA-PACIFIC ORGANIC PESTICIDES MARKET, BY COUNTRY, 2022-2032 ($MILLION)
    TABLE 142. ASIA-PACIFIC ORGANIC PESTICIDES MARKET, BY COUNTRY, 2022-2032 (KILOTON)
    TABLE 143. CHINA ORGANIC PESTICIDES MARKET, BY PRODUCT TYPE, 2022-2032 ($MILLION)
    TABLE 144. CHINA ORGANIC PESTICIDES MARKET, BY PRODUCT TYPE, 2022-2032 (KILOTON)
    TABLE 145. CHINA ORGANIC PESTICIDES MARKET, BY TYPE, 2022-2032 ($MILLION)
    TABLE 146. CHINA ORGANIC PESTICIDES MARKET, BY TYPE, 2022-2032 (KILOTON)
    TABLE 147. CHINA ORGANIC PESTICIDES MARKET, BY FORM, 2022-2032 ($MILLION)
    TABLE 148. CHINA ORGANIC PESTICIDES MARKET, BY FORM, 2022-2032 (KILOTON)
    TABLE 149. CHINA ORGANIC PESTICIDES MARKET, BY APPLICATION, 2022-2032 ($MILLION)
    TABLE 150. CHINA ORGANIC PESTICIDES MARKET, BY APPLICATION, 2022-2032 (KILOTON)
    TABLE 151. INDIA ORGANIC PESTICIDES MARKET, BY PRODUCT TYPE, 2022-2032 ($MILLION)
    TABLE 152. INDIA ORGANIC PESTICIDES MARKET, BY PRODUCT TYPE, 2022-2032 (KILOTON)
    TABLE 153. INDIA ORGANIC PESTICIDES MARKET, BY TYPE, 2022-2032 ($MILLION)
    TABLE 154. INDIA ORGANIC PESTICIDES MARKET, BY TYPE, 2022-2032 (KILOTON)
    TABLE 155. INDIA ORGANIC PESTICIDES MARKET, BY FORM, 2022-2032 ($MILLION)
    TABLE 156. INDIA ORGANIC PESTICIDES MARKET, BY FORM, 2022-2032 (KILOTON)
    TABLE 157. INDIA ORGANIC PESTICIDES MARKET, BY APPLICATION, 2022-2032 ($MILLION)
    TABLE 158. INDIA ORGANIC PESTICIDES MARKET, BY APPLICATION, 2022-2032 (KILOTON)
    TABLE 159. JAPAN ORGANIC PESTICIDES MARKET, BY PRODUCT TYPE, 2022-2032 ($MILLION)
    TABLE 160. JAPAN ORGANIC PESTICIDES MARKET, BY PRODUCT TYPE, 2022-2032 (KILOTON)
    TABLE 161. JAPAN ORGANIC PESTICIDES MARKET, BY TYPE, 2022-2032 ($MILLION)
    TABLE 162. JAPAN ORGANIC PESTICIDES MARKET, BY TYPE, 2022-2032 (KILOTON)
    TABLE 163. JAPAN ORGANIC PESTICIDES MARKET, BY FORM, 2022-2032 ($MILLION)
    TABLE 164. JAPAN ORGANIC PESTICIDES MARKET, BY FORM, 2022-2032 (KILOTON)
    TABLE 165. JAPAN ORGANIC PESTICIDES MARKET, BY APPLICATION, 2022-2032 ($MILLION)
    TABLE 166. JAPAN ORGANIC PESTICIDES MARKET, BY APPLICATION, 2022-2032 (KILOTON)
    TABLE 167. SOUTH KOREA ORGANIC PESTICIDES MARKET, BY PRODUCT TYPE, 2022-2032 ($MILLION)
    TABLE 168. SOUTH KOREA ORGANIC PESTICIDES MARKET, BY PRODUCT TYPE, 2022-2032 (KILOTON)
    TABLE 169. SOUTH KOREA ORGANIC PESTICIDES MARKET, BY TYPE, 2022-2032 ($MILLION)
    TABLE 170. SOUTH KOREA ORGANIC PESTICIDES MARKET, BY TYPE, 2022-2032 (KILOTON)
    TABLE 171. SOUTH KOREA ORGANIC PESTICIDES MARKET, BY FORM, 2022-2032 ($MILLION)
    TABLE 172. SOUTH KOREA ORGANIC PESTICIDES MARKET, BY FORM, 2022-2032 (KILOTON)
    TABLE 173. SOUTH KOREA ORGANIC PESTICIDES MARKET, BY APPLICATION, 2022-2032 ($MILLION)
    TABLE 174. SOUTH KOREA ORGANIC PESTICIDES MARKET, BY APPLICATION, 2022-2032 (KILOTON)
    TABLE 175. AUSTRALIA ORGANIC PESTICIDES MARKET, BY PRODUCT TYPE, 2022-2032 ($MILLION)
    TABLE 176. AUSTRALIA ORGANIC PESTICIDES MARKET, BY PRODUCT TYPE, 2022-2032 (KILOTON)
    TABLE 177. AUSTRALIA ORGANIC PESTICIDES MARKET, BY TYPE, 2022-2032 ($MILLION)
    TABLE 178. AUSTRALIA ORGANIC PESTICIDES MARKET, BY TYPE, 2022-2032 (KILOTON)
    TABLE 179. AUSTRALIA ORGANIC PESTICIDES MARKET, BY FORM, 2022-2032 ($MILLION)
    TABLE 180. AUSTRALIA ORGANIC PESTICIDES MARKET, BY FORM, 2022-2032 (KILOTON)
    TABLE 181. AUSTRALIA ORGANIC PESTICIDES MARKET, BY APPLICATION, 2022-2032 ($MILLION)
    TABLE 182. AUSTRALIA ORGANIC PESTICIDES MARKET, BY APPLICATION, 2022-2032 (KILOTON)
    TABLE 183. REST OF ASIA-PACIFIC ORGANIC PESTICIDES MARKET, BY PRODUCT TYPE, 2022-2032 ($MILLION)
    TABLE 184. REST OF ASIA-PACIFIC ORGANIC PESTICIDES MARKET, BY PRODUCT TYPE, 2022-2032 (KILOTON)
    TABLE 185. REST OF ASIA-PACIFIC ORGANIC PESTICIDES MARKET, BY TYPE, 2022-2032 ($MILLION)
    TABLE 186. REST OF ASIA-PACIFIC ORGANIC PESTICIDES MARKET, BY TYPE, 2022-2032 (KILOTON)
    TABLE 187. REST OF ASIA-PACIFIC ORGANIC PESTICIDES MARKET, BY FORM, 2022-2032 ($MILLION)
    TABLE 188. REST OF ASIA-PACIFIC ORGANIC PESTICIDES MARKET, BY FORM, 2022-2032 (KILOTON)
    TABLE 189. REST OF ASIA-PACIFIC ORGANIC PESTICIDES MARKET, BY APPLICATION, 2022-2032 ($MILLION)
    TABLE 190. REST OF ASIA-PACIFIC ORGANIC PESTICIDES MARKET, BY APPLICATION, 2022-2032 (KILOTON)
    TABLE 191. LAMEA ORGANIC PESTICIDES MARKET, BY PRODUCT TYPE, 2022-2032 ($MILLION)
    TABLE 192. LAMEA ORGANIC PESTICIDES MARKET, BY PRODUCT TYPE, 2022-2032 (KILOTON)
    TABLE 193. LAMEA ORGANIC PESTICIDES MARKET, BY TYPE, 2022-2032 ($MILLION)
    TABLE 194. LAMEA ORGANIC PESTICIDES MARKET, BY TYPE, 2022-2032 (KILOTON)
    TABLE 195. LAMEA ORGANIC PESTICIDES MARKET, BY FORM, 2022-2032 ($MILLION)
    TABLE 196. LAMEA ORGANIC PESTICIDES MARKET, BY FORM, 2022-2032 (KILOTON)
    TABLE 197. LAMEA ORGANIC PESTICIDES MARKET, BY APPLICATION, 2022-2032 ($MILLION)
    TABLE 198. LAMEA ORGANIC PESTICIDES MARKET, BY APPLICATION, 2022-2032 (KILOTON)
    TABLE 199. LAMEA ORGANIC PESTICIDES MARKET, BY COUNTRY, 2022-2032 ($MILLION)
    TABLE 200. LAMEA ORGANIC PESTICIDES MARKET, BY COUNTRY, 2022-2032 (KILOTON)
    TABLE 201. BRAZIL ORGANIC PESTICIDES MARKET, BY PRODUCT TYPE, 2022-2032 ($MILLION)
    TABLE 202. BRAZIL ORGANIC PESTICIDES MARKET, BY PRODUCT TYPE, 2022-2032 (KILOTON)
    TABLE 203. BRAZIL ORGANIC PESTICIDES MARKET, BY TYPE, 2022-2032 ($MILLION)
    TABLE 204. BRAZIL ORGANIC PESTICIDES MARKET, BY TYPE, 2022-2032 (KILOTON)
    TABLE 205. BRAZIL ORGANIC PESTICIDES MARKET, BY FORM, 2022-2032 ($MILLION)
    TABLE 206. BRAZIL ORGANIC PESTICIDES MARKET, BY FORM, 2022-2032 (KILOTON)
    TABLE 207. BRAZIL ORGANIC PESTICIDES MARKET, BY APPLICATION, 2022-2032 ($MILLION)
    TABLE 208. BRAZIL ORGANIC PESTICIDES MARKET, BY APPLICATION, 2022-2032 (KILOTON)
    TABLE 209. SAUDI ARABIA ORGANIC PESTICIDES MARKET, BY PRODUCT TYPE, 2022-2032 ($MILLION)
    TABLE 210. SAUDI ARABIA ORGANIC PESTICIDES MARKET, BY PRODUCT TYPE, 2022-2032 (KILOTON)
    TABLE 211. SAUDI ARABIA ORGANIC PESTICIDES MARKET, BY TYPE, 2022-2032 ($MILLION)
    TABLE 212. SAUDI ARABIA ORGANIC PESTICIDES MARKET, BY TYPE, 2022-2032 (KILOTON)
    TABLE 213. SAUDI ARABIA ORGANIC PESTICIDES MARKET, BY FORM, 2022-2032 ($MILLION)
    TABLE 214. SAUDI ARABIA ORGANIC PESTICIDES MARKET, BY FORM, 2022-2032 (KILOTON)
    TABLE 215. SAUDI ARABIA ORGANIC PESTICIDES MARKET, BY APPLICATION, 2022-2032 ($MILLION)
    TABLE 216. SAUDI ARABIA ORGANIC PESTICIDES MARKET, BY APPLICATION, 2022-2032 (KILOTON)
    TABLE 217. SOUTH AFRICA ORGANIC PESTICIDES MARKET, BY PRODUCT TYPE, 2022-2032 ($MILLION)
    TABLE 218. SOUTH AFRICA ORGANIC PESTICIDES MARKET, BY PRODUCT TYPE, 2022-2032 (KILOTON)
    TABLE 219. SOUTH AFRICA ORGANIC PESTICIDES MARKET, BY TYPE, 2022-2032 ($MILLION)
    TABLE 220. SOUTH AFRICA ORGANIC PESTICIDES MARKET, BY TYPE, 2022-2032 (KILOTON)
    TABLE 221. SOUTH AFRICA ORGANIC PESTICIDES MARKET, BY FORM, 2022-2032 ($MILLION)
    TABLE 222. SOUTH AFRICA ORGANIC PESTICIDES MARKET, BY FORM, 2022-2032 (KILOTON)
    TABLE 223. SOUTH AFRICA ORGANIC PESTICIDES MARKET, BY APPLICATION, 2022-2032 ($MILLION)
    TABLE 224. SOUTH AFRICA ORGANIC PESTICIDES MARKET, BY APPLICATION, 2022-2032 (KILOTON)
    TABLE 225. REST OF LAMEA ORGANIC PESTICIDES MARKET, BY PRODUCT TYPE, 2022-2032 ($MILLION)
    TABLE 226. REST OF LAMEA ORGANIC PESTICIDES MARKET, BY PRODUCT TYPE, 2022-2032 (KILOTON)
    TABLE 227. REST OF LAMEA ORGANIC PESTICIDES MARKET, BY TYPE, 2022-2032 ($MILLION)
    TABLE 228. REST OF LAMEA ORGANIC PESTICIDES MARKET, BY TYPE, 2022-2032 (KILOTON)
    TABLE 229. REST OF LAMEA ORGANIC PESTICIDES MARKET, BY FORM, 2022-2032 ($MILLION)
    TABLE 230. REST OF LAMEA ORGANIC PESTICIDES MARKET, BY FORM, 2022-2032 (KILOTON)
    TABLE 231. REST OF LAMEA ORGANIC PESTICIDES MARKET, BY APPLICATION, 2022-2032 ($MILLION)
    TABLE 232. REST OF LAMEA ORGANIC PESTICIDES MARKET, BY APPLICATION, 2022-2032 (KILOTON)
    TABLE 233. CERTIS USA LLC: KEY EXECUTIVES
    TABLE 234. CERTIS USA LLC: COMPANY SNAPSHOT
    TABLE 235. CERTIS USA LLC: PRODUCT SEGMENTS
    TABLE 236. CERTIS USA LLC: PRODUCT PORTFOLIO
    TABLE 237. ANDERMATT GROUP AG: KEY EXECUTIVES
    TABLE 238. ANDERMATT GROUP AG: COMPANY SNAPSHOT
    TABLE 239. ANDERMATT GROUP AG: PRODUCT SEGMENTS
    TABLE 240. ANDERMATT GROUP AG: PRODUCT PORTFOLIO
    TABLE 241. MARK AGRI GENETICS PVT. LTD.: KEY EXECUTIVES
    TABLE 242. MARK AGRI GENETICS PVT. LTD.: COMPANY SNAPSHOT
    TABLE 243. MARK AGRI GENETICS PVT. LTD.: PRODUCT SEGMENTS
    TABLE 244. MARK AGRI GENETICS PVT. LTD.: PRODUCT PORTFOLIO
    TABLE 245. PARRY AMERICA, INC.: KEY EXECUTIVES
    TABLE 246. PARRY AMERICA, INC.: COMPANY SNAPSHOT
    TABLE 247. PARRY AMERICA, INC.: PRODUCT SEGMENTS
    TABLE 248. PARRY AMERICA, INC.: PRODUCT PORTFOLIO
    TABLE 249. BAYER AG: KEY EXECUTIVES
    TABLE 250. BAYER AG: COMPANY SNAPSHOT
    TABLE 251. BAYER AG: PRODUCT SEGMENTS
    TABLE 252. BAYER AG: PRODUCT PORTFOLIO
    TABLE 253. ARYSTA LIFESCIENCE CORPORATION.: KEY EXECUTIVES
    TABLE 254. ARYSTA LIFESCIENCE CORPORATION.: COMPANY SNAPSHOT
    TABLE 255. ARYSTA LIFESCIENCE CORPORATION.: PRODUCT SEGMENTS
    TABLE 256. ARYSTA LIFESCIENCE CORPORATION.: PRODUCT PORTFOLIO
    TABLE 257. SIKKOINDIA: KEY EXECUTIVES
    TABLE 258. SIKKOINDIA: COMPANY SNAPSHOT
    TABLE 259. SIKKOINDIA: PRODUCT SEGMENTS
    TABLE 260. SIKKOINDIA: PRODUCT PORTFOLIO
    TABLE 261. REDOX INDUSTRIES LIMITED.: KEY EXECUTIVES
    TABLE 262. REDOX INDUSTRIES LIMITED.: COMPANY SNAPSHOT
    TABLE 263. REDOX INDUSTRIES LIMITED.: PRODUCT SEGMENTS
    TABLE 264. REDOX INDUSTRIES LIMITED.: PRODUCT PORTFOLIO
    TABLE 265. SATPURA BIO FERTILISER INDIA PVT LTD: KEY EXECUTIVES
    TABLE 266. SATPURA BIO FERTILISER INDIA PVT LTD: COMPANY SNAPSHOT
    TABLE 267. SATPURA BIO FERTILISER INDIA PVT LTD: PRODUCT SEGMENTS
    TABLE 268. SATPURA BIO FERTILISER INDIA PVT LTD: PRODUCT PORTFOLIO
    TABLE 269. DOW INC.: KEY EXECUTIVES
    TABLE 270. DOW INC.: COMPANY SNAPSHOT
    TABLE 271. DOW INC.: PRODUCT SEGMENTS
    TABLE 272. DOW INC.: PRODUCT PORTFOLIO
  • LIST OF FIGURES

  • FIGURE 01. ORGANIC PESTICIDES MARKET, 2022-2032
    FIGURE 02. SEGMENTATION OF ORGANIC PESTICIDES MARKET, 2022-2032
    FIGURE 03. TOP INVESTMENT POCKETS IN ORGANIC PESTICIDES MARKET (2023-2032)
    FIGURE 04. HIGH BARGAINING POWER OF SUPPLIERS
    FIGURE 05. MODERATE BARGAINING POWER OF BUYERS
    FIGURE 06. MODERATE THREAT OF SUBSTITUTES
    FIGURE 07. MODERATE THREAT OF NEW ENTRANTS
    FIGURE 08. MODERATE INTENSITY OF RIVALRY
    FIGURE 09. DRIVERS, RESTRAINTS AND OPPORTUNITIES: GLOBALORGANIC PESTICIDES MARKET
    FIGURE 10. PATENT ANALYSIS BY COMPANY
    FIGURE 11. PATENT ANALYSIS BY COUNTRY
    FIGURE 12. PRICING ANALYSIS: ORGANIC PESTICIDES MARKET 2022 AND 2032
    FIGURE 13. REGULATORY GUIDELINES: ORGANIC PESTICIDES MARKET
    FIGURE 14. VALUE CHAIN ANALYSIS: ORGANIC PESTICIDES MARKET
    FIGURE 15. ORGANIC PESTICIDES MARKET, BY PRODUCT TYPE, 2022(%)
    FIGURE 16. COMPARATIVE SHARE ANALYSIS OF ORGANIC PESTICIDES MARKET FOR BIOMEDICAL, BY COUNTRY 2022 AND 2032(%)
    FIGURE 17. COMPARATIVE SHARE ANALYSIS OF ORGANIC PESTICIDES MARKET FOR MICROBIAL, BY COUNTRY 2022 AND 2032(%)
    FIGURE 18. COMPARATIVE SHARE ANALYSIS OF ORGANIC PESTICIDES MARKET FOR BOTANICAL, BY COUNTRY 2022 AND 2032(%)
    FIGURE 19. COMPARATIVE SHARE ANALYSIS OF ORGANIC PESTICIDES MARKET FOR MINERAL, BY COUNTRY 2022 AND 2032(%)
    FIGURE 20. ORGANIC PESTICIDES MARKET, BY TYPE, 2022(%)
    FIGURE 21. COMPARATIVE SHARE ANALYSIS OF ORGANIC PESTICIDES MARKET FOR INSECTICIDE, BY COUNTRY 2022 AND 2032(%)
    FIGURE 22. COMPARATIVE SHARE ANALYSIS OF ORGANIC PESTICIDES MARKET FOR FUNGICIDE, BY COUNTRY 2022 AND 2032(%)
    FIGURE 23. COMPARATIVE SHARE ANALYSIS OF ORGANIC PESTICIDES MARKET FOR HERBICIDE, BY COUNTRY 2022 AND 2032(%)
    FIGURE 24. COMPARATIVE SHARE ANALYSIS OF ORGANIC PESTICIDES MARKET FOR OTHERS, BY COUNTRY 2022 AND 2032(%)
    FIGURE 25. ORGANIC PESTICIDES MARKET, BY FORM, 2022(%)
    FIGURE 26. COMPARATIVE SHARE ANALYSIS OF ORGANIC PESTICIDES MARKET FOR LIQUID, BY COUNTRY 2022 AND 2032(%)
    FIGURE 27. COMPARATIVE SHARE ANALYSIS OF ORGANIC PESTICIDES MARKET FOR POWDER, BY COUNTRY 2022 AND 2032(%)
    FIGURE 28. ORGANIC PESTICIDES MARKET, BY APPLICATION, 2022(%)
    FIGURE 29. COMPARATIVE SHARE ANALYSIS OF ORGANIC PESTICIDES MARKET FOR GARDENING, BY COUNTRY 2022 AND 2032(%)
    FIGURE 30. COMPARATIVE SHARE ANALYSIS OF ORGANIC PESTICIDES MARKET FOR FRUITS AND VEGETABLES, BY COUNTRY 2022 AND 2032(%)
    FIGURE 31. COMPARATIVE SHARE ANALYSIS OF ORGANIC PESTICIDES MARKET FOR CEREALS AND PULSES, BY COUNTRY 2022 AND 2032(%)
    FIGURE 32. COMPARATIVE SHARE ANALYSIS OF ORGANIC PESTICIDES MARKET FOR NURSERY, BY COUNTRY 2022 AND 2032(%)
    FIGURE 33. COMPARATIVE SHARE ANALYSIS OF ORGANIC PESTICIDES MARKET FOR OTHERS, BY COUNTRY 2022 AND 2032(%)
    FIGURE 34. ORGANIC PESTICIDES MARKET BY REGION, 2022
    FIGURE 35. U.S. ORGANIC PESTICIDES MARKET, 2022-2032 ($MILLION)
    FIGURE 36. CANADA ORGANIC PESTICIDES MARKET, 2022-2032 ($MILLION)
    FIGURE 37. MEXICO ORGANIC PESTICIDES MARKET, 2022-2032 ($MILLION)
    FIGURE 38. GERMANY ORGANIC PESTICIDES MARKET, 2022-2032 ($MILLION)
    FIGURE 39. UK ORGANIC PESTICIDES MARKET, 2022-2032 ($MILLION)
    FIGURE 40. FRANCE ORGANIC PESTICIDES MARKET, 2022-2032 ($MILLION)
    FIGURE 41. SPAIN ORGANIC PESTICIDES MARKET, 2022-2032 ($MILLION)
    FIGURE 42. ITALY ORGANIC PESTICIDES MARKET, 2022-2032 ($MILLION)
    FIGURE 43. REST OF EUROPE ORGANIC PESTICIDES MARKET, 2022-2032 ($MILLION)
    FIGURE 44. CHINA ORGANIC PESTICIDES MARKET, 2022-2032 ($MILLION)
    FIGURE 45. INDIA ORGANIC PESTICIDES MARKET, 2022-2032 ($MILLION)
    FIGURE 46. JAPAN ORGANIC PESTICIDES MARKET, 2022-2032 ($MILLION)
    FIGURE 47. SOUTH KOREA ORGANIC PESTICIDES MARKET, 2022-2032 ($MILLION)
    FIGURE 48. AUSTRALIA ORGANIC PESTICIDES MARKET, 2022-2032 ($MILLION)
    FIGURE 49. REST OF ASIA-PACIFIC ORGANIC PESTICIDES MARKET, 2022-2032 ($MILLION)
    FIGURE 50. BRAZIL ORGANIC PESTICIDES MARKET, 2022-2032 ($MILLION)
    FIGURE 51. SAUDI ARABIA ORGANIC PESTICIDES MARKET, 2022-2032 ($MILLION)
    FIGURE 52. SOUTH AFRICA ORGANIC PESTICIDES MARKET, 2022-2032 ($MILLION)
    FIGURE 53. REST OF LAMEA ORGANIC PESTICIDES MARKET, 2022-2032 ($MILLION)
    FIGURE 54. TOP WINNING STRATEGIES, BY YEAR
    FIGURE 55. TOP WINNING STRATEGIES, BY DEVELOPMENT
    FIGURE 56. TOP WINNING STRATEGIES, BY COMPANY
    FIGURE 57. PRODUCT MAPPING OF TOP 10 PLAYERS
    FIGURE 58. COMPETITIVE DASHBOARD
    FIGURE 59. COMPETITIVE HEATMAP: ORGANIC PESTICIDES MARKET
    FIGURE 60. TOP PLAYER POSITIONING, 2022
    FIGURE 61. BAYER AG: NET SALES, 2020-2022 ($MILLION)
    FIGURE 62. BAYER AG: REVENUE SHARE BY SEGMENT, 2022 (%)
    FIGURE 63. BAYER AG: REVENUE SHARE BY REGION, 2022 (%)
    FIGURE 64. SIKKOINDIA: NET REVENUE, 2019-2021 ($MILLION)
    FIGURE 65. SIKKOINDIA: REVENUE SHARE BY SEGMENT, 2021 (%)
    FIGURE 66. THE DOW CHEMICAL COMPANY: NET REVENUE, 2019-2021 ($MILLION)
    FIGURE 67. THE DOW CHEMICAL COMPANY: REVENUE SHARE BY SEGMENT, 2021 (%)
    FIGURE 68. THE DOW CHEMICAL COMPANY: REVENUE SHARE BY REGION, 2021 (%)


Organic pesticides are the types of pesticides obtained from natural sources such as animals, bacteria, minerals, and plants. Rise in demand from end users, especially from the developing countries, and continuous technological advancements boost the growth of the global organic pesticides industry. Several advantages that boost the growth of global organic pesticides market during the forecast period are reduced environmental damage, necessity for smaller amounts for effective coverage, targeted action, and quicker decomposition. Furthermore, the popularity of organic pesticides has increased substantially in recent years, as extensive research has enhanced their effectiveness. A recent trend that has gained traction in the global organic pesticides market is the growth in public concern over the potential health hazards of synthetic pesticides. This in turn is expected to drive the growth of global market. However, lack of profit from niche market products is expected to hinder the market growth.

The Asia-Pacific organic pesticides market is expected to grow at the highest rate, owing to increase in adoption, specifically in the emerging countries, such as China, India, Japan, and Korea. Moreover, the production cost of organic pesticides is moderately low in the Asia-Pacific as compared to other regions.

PURCHASE OPTIONS

Call or Email us

U.S.-Canada Toll-free: +1-800-792-5285
Int'l : +1-503-894-6022
Europe : +44-845-528-1300
Email : help@alliedmarketresearch.com
 
FREQUENTLY ASKED QUESTIONS?

A. Increasing consumer preference for organic products, government regulations, growing environmental concerns, and technological advancements are the upcoming trends of organic pesticides market.

A. Cereals and pulses is the leading application of organic pesticides market.

A. North America is the largest regional market for organic pesticides.

A. The organic pesticides market was valued for $3.0 billion in 2022 and is estimated to reach $7.6 billion by 2032, exhibiting a CAGR of 9.7% from 2023 to 2032.

A. Andermatt Group AG, Arysta LifeScience Corporation., Bayer AG, Certis USA LLC, Dow Inc., Mark Agri Genetics Pvt. Ltd., Parry America, Inc., Redox Industries Limited., Satpura Bio Fertiliser India Pvt Ltd, and Sikkoindia are the top companies that hold prominent market share in organic pesticides market.

Looking for Customization?

 Customization Request

Have a Question?

 Speak with Analyst

Any Confusion?

 Inquire Before Buying

Have a glance of the Report

  Request Sample
RELATED TAGS

Purchase Full Report of
Organic Pesticides Market

Start reading instantly.
This Report and over 67,068+ more Reports, Available with Avenue Library. T&C*.

  • Online Only
  • $3,570
  • Online cloud access only
  • Restricted print, copy, paste & download
  • Read only
  • Free industry update
    (Within 180 days)
  • Free report update in next update cycle
    (Jun 2024 - Jun 2025)
  • Data Pack
  • $3,840
  • Restricted to one authorized user
  • One print only
  • Available in
    Excel
  • Free industry update
    (Within 180 days)
  •   Free report update in next update cycle
    (Jun 2024 - Jun 2025)
  • Single User
  • $5,730
  • Restricted to one authorized user
  • One print only
  • Available in
    PDF
  • Free industry update
    (Within 180 days)
  •   Free report update in next update cycle
    (Jun 2024 - Jun 2025)
  • Five Users
  • $6,450
  • Limited to five authorized users
  • Print upto five copies
  • Available in
    PDF
  • Free industry update
    (Within 180 days)
  •   Free report update in next update cycle
    (Jun 2024 - Jun 2025)
  • Enterprise
    License/PDF

  • $9,600
  • Unlimited
    within
    company/enterprise
  • Available in Excel & PDF
  • Free industry update
    (Within 180 days)
  •   Free report update in next update cycle
    (Jun 2024 - Jun 2025)
  • Library
    Membership

  • $999 $ 1,175
    Per User/ Per month/ Billed annually
  • Published Content
    E-access
  • Company Profiles
    E-access
  • Newly Added Content Access
  • 10 PDF
    Downloads
  • 5 Excel Data
    Pack Downloads
  • 250 Company Profiles PDF Downloads
  • Buy Now

*Taxes/Fees, if applicable will be added during checkout. All prices in USD

RELATED REPORTS
 

Why Allied Market Research?


Infallible Methodology

To ensure high-level data integrity, accurate analysis, and impeccable forecasts

Analyst Support

For complete satisfaction

Customization

On-demand customization of scope of the report to exactly meet your needs

TARGETED MARKET VIEW

Targeted market view to provide pertinent information and save time of readers

Get fresh content delivered

Get insights on topics that are crucial for your business. Stay abreast of your interest areas.

Get Industry Data Alerts

Why Allied Market Research?

Infallible Methodology

To ensure high-level data integrity, accurate analysis, and impeccable forecasts

Analyst Support

For complete satisfaction

Customization

On-demand customization of scope of the report to exactly meet your needs

TARGETED MARKET VIEW

Targeted market view to provide pertinent information and save time of readers