0
2022
Organic Pigments Market

Organic Pigments Market

by Type (Azo Pigments, Phthalocyanine Pigments, High Performance Pigments (HPPs), Alizarin, Arylide, Others), by End Use Industry (Paints and Coatings, Automotive, Plastics, Printing Inks, Packaging, Textile, Others): Global Opportunity Analysis and Industry Forecast, 2021-2031

Report Code: A12122
Nov 2022 | Pages: 350
Tables: 191
Charts: 66
  • Formats*:

  • pdf

    Single User License, Five User
    License & Enterprise User License

  • xls

    Data Pack Excel License

  • ppt

    It comes with the additional cost
    of $2500.00 contact sales.


Organic Pigments Market Research, 2031

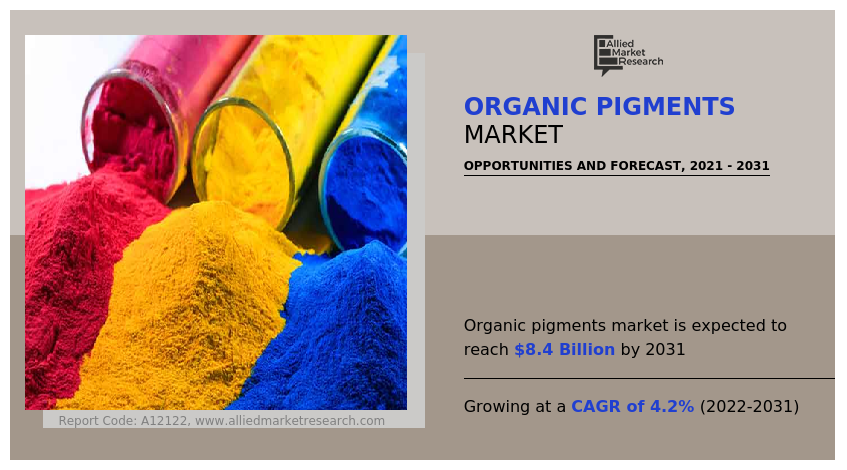
The global organic pigments market was valued at $5.6 billion in 2021, and is projected to reach $8.4 billion by 2031, growing at a CAGR of 4.2% from 2022 to 2031.

Report key highlighters

  • The global organic pigments market has been analyzed in terms of value ($Million) and volume (Tons). The analysis in the report is provided on the basis of type, application, 4 major regions, and more than 15 countries.
  • The global organic pigments market report includes a detailed study covering underlying factors influencing the industry opportunities and trends.
  • The organic pigments market is fragmented in nature with few players such as BASF SE, Clariant, DIC Corporation, Ferro Corporation, LANXESS, which hold significant share of the market.
  • The report facilitates strategy planning and industry dynamics to enhance decision making for existing market players and new entrants entering the organic pigments industry.
  • Countries such as China, U.S., India, Germany, and Brazil hold a significant share in the global organic pigments market.

Organic pigments are non-toxic, cost-effective, and have high color power, making them an excellent choice for usage in a variety of industries. The availability of organic pigments in a variety of hues makes them appealing for use in visual arts as well. Increasing usage of organic pigments in high-tech applications such as photo-reproduction, optoelectronic display, and optical data storage is driving the demand for organic pigments.

Organic Pigments Market

Organic pigment-colored substance is generated from a plant with pigment properties. It is a class of insoluble organic compounds with a high coloring strength and qualities such as resistance to sunlight & flooding, resistance to acids & alkalis, resistance to organic solvents, resistance to heat, and excellent dispersion properties. They are utilized in ink, paint, and the production of polymers & rubber. As a filler and reinforcing agent, it is utilized in numerous applications, such as coloring agents for plastics and synthetic fibers and in the rubber sector.

Organic pigments are classified as organic solids and are used to color paints, rubber products, inks, plastic products, and coated printing sizes. They are available in a variety of hues, including blue, orange red, violet, white, brown, yellow, black, pink, and green. They are tinctorial, light, heat-resistant, weather-resistant solvent, insoluble, and are unaffected physically and chemically by the substrate, where pigments are incorporated. The factors such as the increasing need for organic pigments in the pharmaceuticals industry, the growing demand for bio-based paints & coatings, and the rise in the number of color shades are the driving forces behind the organic pigments market's expansion.

Owing to laws and regulations such as the FFDCA, Code of Federal Regulations (CFR), and Generally Regarded as Safe (GRAS), organic pigments are commonly utilized in the printing inks application. Organic pigments used in jet inks and UV inks contribute optical density, rub resistance, and flow qualities to printing inks. Owing to digitalization, the printing inks market for newspaper and periodical applications has been seeing a decline in growth; nevertheless, the demand for printing inks in the packaging films is expanding at a rapid rate and is driving the demand for organic pigments market.

Increased demand for organic pigments in the plastic packaging industry

Increasing demand for aesthetically pleasing designs in plastic packaging is expected to drive market expansion during the forecast period. High levels of competition increase the demand for product distinctiveness, which in turn increases the significance of aesthetics in plastic packaging. The increasing demand for organic pigments is a result of the need to make items more appealing to attract customers. The strong coloring strength of organic pigments enables the provision of bespoke colors and a wide range of color tones, thereby enhancing the aesthetics and desirability of the product.

In addition, stringent laws surrounding the use of printing inks in food packaging are increasing the demand for organic pigments that are favorable to the environment. Food packaging safety has become a global problem, and there is a growing awareness among concerned communities over the potential transfer of package color into food products. High-quality organic pigments are color and viscosity stable. These are readily printable on a variety of media. Increasing demand for a vast range of FDA-approved pigments, such as yellow, green, and other coloring agents, is expected to drive market expansion during the forecast period.

The automotive industry is the main industry for high-performance pigments due to the use of HPPs in coatings for luxury ships & automobiles, traditional plug-in vehicles, high-end hybrid vehicles, and other vehicles. As a result of the global automotive industry's rapid expansion, there is a growing demand for high-performance pigments, driving the demand for the organic pigments market. For example, the automotive motor market was valued at around $35 billion in 2020. Automobile paints and varnishes utilize high-performance pigments to provide durability & corrosion prevention and to cover underlying metals and components from harsh weather conditions. This factor is driving the demand for organic pigments market.

To produce organic colors, toluene, benzene, xylene, ethylene, and naphthalene are the essential ingredients. As a result of their negative impact on human health, these compounds are subject to stringent controls and limits in industry. Exposure to these substances causes stumbling, drowsiness, fainting, irregular pulse, and occasionally death. REACH is the regulatory body that oversees the use of chemicals in Europe. Another issue with organic pigments is that these raw ingredients are predominantly produced in Asia-Pacific, particularly China, resulting in a growth in relying on a single region for global supply. These factors can restrain the organic pigment market.

Organic pigments are costlier than inorganic pigments, which is a significant market restraint. The market is growing rapidly; however, it is far smaller than the market for inorganic pigments. Organic pigments are produced in tiny quantities, however the manufacturing of inorganic pigments benefits from economies of scale. Consequently, production costs are increased, which causes the price of the final product to rise. Organic pigments are generally 1.5 times more expensive than inorganic pigments, which restricts their use in paints & coatings and other non-regulated applications.

The furniture industry is expected to offer significant opportunities for growth. Organic pigments can safeguard wood against moisture and spills. These organic colors can provide this furniture with lasting attractiveness and decorative appeal. This growth potential is expected to boost the market's total supply rate. Even the rate of market increase is significant.

The use of intelligent technologies by manufacturers to provide environmentally friendly coatings with improved scratch resistance and abrasion resistance is increasing the demand for high-performance pigments, which is anticipated to provide the organic pigments market with numerous lucrative opportunities during the forecast period. In addition, industry participants have undertaken considerable initiatives to manufacture high-performance pigments using only bio-based goods due to consumer satisfaction with bio-based products, which is projected to provide growth opportunities for the market for organic pigments.

The organic pigments market is segmented into type, end-use industry, and region. Depending on type, the market is divided into azo pigments, phthalocyanine pigments, high-performance pigments, alizarin, arylide, and others. On the basis of end-use industry, it is categorized into paints & coatings, automotive, plastics, printing inks, packaging, textile, and others. Region-wise, the market is studied across North America, Europe, Asia-Pacific, and LAMEA.
The major players operating in the global organic pigments market are BASF SE, Clariant, DIC Corporation, Ferro Corporation, LANXESS, Sudarshan Chemical Industries Limited, Sun Chemical, Synthesia a.s., TOYOCOLOR CO., LTD, and Trust Chem Co. Ltd. Other players operating in the market are Heubach GmbH, Dainichiseika Color & Chemicals Mfg. Co. Ltd, Changzhou Longyu Pigment Chemical Co. Ltd, Pidilite Industries Ltd and Sensient Technologies Corporation.

Organic Pigments Market

The high-performance pigments (HPPs) segment accounted for the largest share i.e., 41.1%. This is due to its advantageous qualities such as high insolubility, glossy effect, high brightness, heat stability, chemical resistance, and color strength. Increasing demand for HPPs as coatings for trains, automobiles, aircraft, and ships also contributes to the segment's expansion. Among the volatility in the automobile industry, the rise of next-generation automobiles and the development of global transportation networks provide high-performance pigments with extensive market penetration. High-performance pigments can be utilized in traditional plug-in autos, luxury automobiles, and high-end hybrid vehicles.
Organic Pigments Market

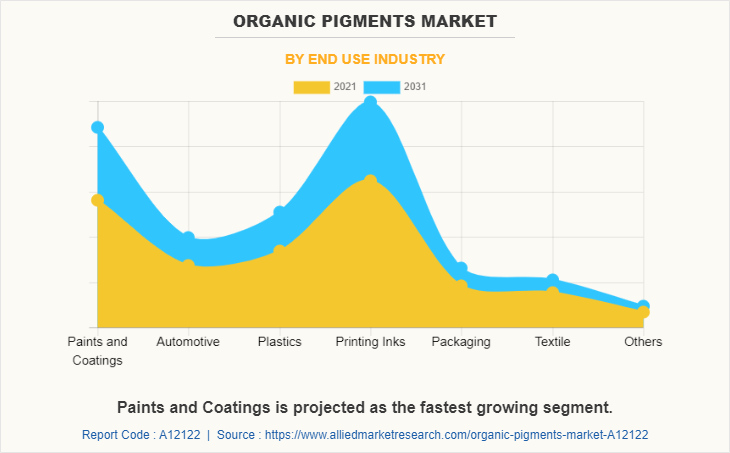
The printing inks segment accounted for the largest share i.e., 29.1% due to laws and regulations, such as the Food and Drug Administration Modernization Act (FFDCA), the Code of Federal Regulations (CFR), and Generally Recognized as Safe (GRAS), in the context of the application of food packaging. Organic pigments are utilized in printing inks due to their rub resistance, optical density, rheological qualities, and flow properties. These pigments are utilized in jet inks and UV inks. The paints and coatings is the fastest growing segment with CAGR 4.7%, this is due to the need for ornamental coatings, marine coatings, automotive coatings, textile paints, and industrial coatings, which is growing rapidly. In addition, the rising use of organic pigments in decorative coatings, particularly in the construction industry, as a result of their cost-effectiveness and eco-friendliness, is adding to the expansion of the market.
Organic Pigments Market

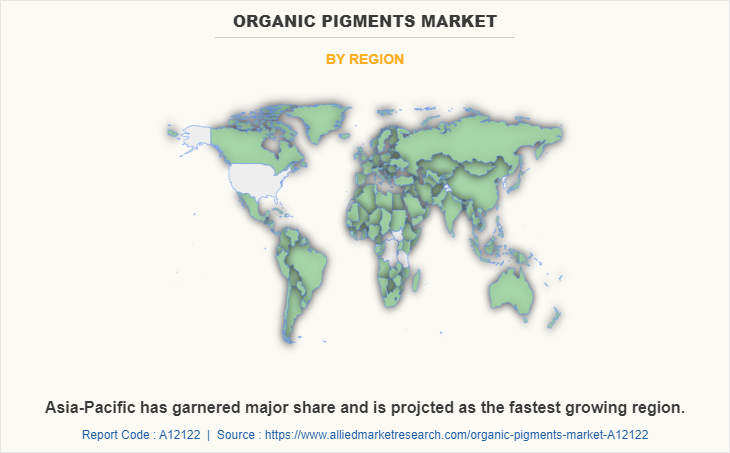
During the forecast period, Asia-Pacific is expected to grow at a robust rate and account for the largest market share of 46.5%. Increasing demand for organic pigments from various end-use sectors, such as automotive, construction, and packaging, is anticipated to fuel market growth in the Asia-Pacific during the forecast period. Construction industry applications of organic pigments are expected to increase as a result of the expansion of the construction sector in developing countries and rising infrastructure spending. Major players such as Toyocolor Co., Ltd. Hangzhou Heubach Pigment Co., Ltd., Trust Chem Co., Ltd., DIC Corporation and Sudarshan Chemical Industries are persistently investing to provide a comprehensive range of high-quality organic pigments for plastic, printing inks, textile, and paints & coatings applications. The automotive sector in Asia-Pacific is progressively incorporating organic pigments into protective automobile coatings for exterior and interior car components.

Key potential factors that drive the organic pigments market demand

The automobile industry is a significant market for organic pigments. In the recent past, the demand for automobiles has increased rapidly, and this trend is anticipated to continue during the forecast period. It is estimated that increasing population and disposable income, particularly in developing regions such as Latin America, the Middle East & Africa, and Asia-Pacific, are expected to fuel vehicle demand over the projection period.

Organic pigments are distinguished from their conventional counterparts by a number of advantageous features. These characteristics include weather fastness, higher light fastness, low solubility, extended operational life, high heat stability, improved resistance to natural elements & chemicals, and decreased migration. These characteristics make them indispensable for a variety of applications in a wide range of sectors, especially outdoor applications. Major outdoor uses include vehicle coatings and building exterior coatings. In addition, organic pigments have photochromatic, fluorescence, and luminescence qualities.

These excellent qualities can be divided into distinct categories, such as environment, efficacy, and economics. Effectiveness refers to the technical performance of these pigments in diverse applications. Economy incorporates a variety of financial advantages for the buyer. Despite the fact that these organic pigments are more expensive than conventional pigments, they need a greater initial investment and pay off in the long run for a number of reasons. These characteristics consist of less maintenance, a longer operational life, and fewer coating applications. Ecology includes reduced toxicity and reduces environmental impact.

"Pigments are governed by a variety of regulations due to stringent environmental rules and rising concerns. These restrictions are in place to protect both the environment and the interests of customers. Organic pigments are projected to be low in toxicity and have little environmental impact. These pigments are essential for a variety of applications."

Pricing disparity is projected to have a negative impact on the market

Organic pigments are more expensive than conventional colors. This price difference is attributable to the improved characteristics and higher production costs of certain pigments. This pricing disparity is projected to have a negative impact on the market for organic pigments during the forecast period, particularly in developing regions such as Asia-Pacific, the Middle East & Africa, and Central & South America. Even though these markets provide considerable growth opportunities for industry participants, they are highly price sensitive. Such emerging regions are also distinguished by a weak regulatory framework, causing end-use companies to choose conventional pigments over organic pigments to save money.

These pigments have a high price since they are the result of intensive R&D and require raw materials of the highest grade. Bio-based pigments are in high demand due to the recent movement in customer preferences toward bio-based products and the growing awareness of the toxic impacts of pigments. This pattern is predicted to continue in the coming years. Several initiatives have been undertaken by businesses to manufacture eco-friendly and superior products, resulting in a price increase. The enormous R&D expenditure is passed on to the customers.

Competitive Trends

The global market for organic pigments is considerably smaller than the market for inorganic pigments due to higher production costs. Organic pigments cost around twice as much as inorganic colors, limiting their market. Key market players are concentrating on the creation and development of new products with applications in a variety of end-use industries. In April 2017, BASF introduced Xfast® Easy Color, a new organic, environmentally friendly dry stir-in pigment for POS in the professional and DIY industries. The product was designed for a variety of uses, including exterior and interior architectural paints, artist paints, wood glazes and coatings, plaster, and concrete coatings.

Latest development strategies undertaken by key players

  • On August 12, 2021, Sun Chemical launched a leadfree Paliotan VIU pigments range that replaces the lead components present in coatings formulations. The lead-free Paliotan VIU organic pigments come along with new technical services offering. The new portfolio includes several shades, including mid-yellow, red, and lemon yellow. This new product may lead to the growth of revenue.
  • On June 30th, 2021, Clariant entered into an agreement with Heubach to sell its organic pigments business. Heubach and SK Capital with acquire the company by 2022, with Clariant owning 20% of the stock.
  • On June 30th, 2021, DIC Corporation and Sun Chemical finalized the acquisition of BASF’s global pigments business, popular as BASF Colors and Effects (BCE). This acquisition is expected to help enlarge Sun Chemical’s pigments range, including those of cosmetics, electronic displays, inks, coatings, plastics, and specialty applications, by offering an even broader range of versatile solutions.
  • On June 30, 2021, DIC Corporation acquired BASF Colors & Effects (BCE), the global pigments business of BASF SE. This acquisition helped to broaden DIC’s product portfolio of organic and inorganic pigments for electronic displays, cosmetics, coatings, plastics, inks, and specialty applications

COVID-19 Impact

The COVID-19 pandemic had a significant impact on the manufacturing and distribution of organic pigments. Several governments have instituted stringent lockdowns to prevent the spread of COVID-19. Numerous manufacturing enterprises are either inactive or producing at capacity. The market for organic pigments has been affected by a disrupted global supply chain and a decline in demand from a variety of end-user industries, including paints & coatings, plastics, textiles, and others. The paints and coatings industry is the greatest consumer of organic pigments; however, during lockdowns, factories ceased production, resulting in a decline in demand for organic pigments. Future demand growth for dependable commercial products, such as 3D printing materials, is anticipated to create an opportunity for market participants.

Key Benefits For Stakeholders

  • This report provides a quantitative analysis of the market segments, current trends, estimations, and dynamics of the organic pigments market analysis from 2021 to 2031 to identify the prevailing organic pigments market opportunities.
  • The market research is offered along with information related to key drivers, restraints, and opportunities.
  • Porter's five forces analysis highlights the potency of buyers and suppliers to enable stakeholders make profit-oriented business decisions and strengthen their supplier-buyer network.
  • In-depth analysis of the organic pigments market segmentation assists to determine the prevailing market opportunities.
  • Major countries in each region are mapped according to their revenue contribution to the global market.
  • Market player positioning facilitates benchmarking and provides a clear understanding of the present position of the market players.
  • The report includes the analysis of the regional as well as global organic pigments market trends, key players, market segments, application areas, and market growth strategies.

Organic Pigments Market Report Highlights

Aspects Details
Market Size By 2031 USD 8.4 billion
Growth Rate CAGR of 4.2%
Forecast period 2021 - 2031
Report Pages 350
By Type
  • Azo Pigments
  • Phthalocyanine Pigments
  • High Performance Pigments (HPPs)
  • Alizarin
  • Arylide
  • Others
By End Use Industry
  • Textile
  • Others
  • Paints and Coatings
  • Automotive
  • Plastics
  • Printing Inks
  • Packaging
By Region
  • North America  (U.S., Canada, Mexico)
  • Europe  (Germany, UK, France, Spain, Italy, Rest of Europe)
  • Asia-Pacific  (China, India, Japan, South Korea, Australia, Rest of Asia-Pacific)
  • LAMEA  (Brazil, Saudi Arabia, South Africa, Rest of LAMEA)
Key Market Players dic corporation, TOYOCOLOR CO., LTD, Clariant, LANXESS, BASF SE, Trust Chem Co. Ltd, Ferro Corporation, Sun Chemical, Sudarshan Chemical Industries Limited, Synthesia a.s.
Dainichiseika Color Co. Ltd, Company 2, Company 3
 
  • CHAPTER 1:INTRODUCTION

    • 1.1.Report description

    • 1.2.Key market segments

    • 1.3.Key benefits to the stakeholders

    • 1.4.Research Methodology

      • 1.4.1.Secondary research

      • 1.4.2.Primary research

      • 1.4.3.Analyst tools and models

  • CHAPTER 2:EXECUTIVE SUMMARY

    • 2.1.Key findings of the study

    • 2.2.CXO Perspective

  • CHAPTER 3:MARKET OVERVIEW

    • 3.1.Market definition and scope

    • 3.2.Key findings

      • 3.2.1.Top investment pockets

    • 3.3.Porter’s five forces analysis

    • 3.4.Market dynamics

      • 3.4.1.Drivers

        • 3.4.1.1. Increased demand for organic pigments in the plastic packaging industry
        • 3.4.1.2. Increased demand for high-performance pigments from various end-use industries

      • 3.4.2.Restraints

        • 3.4.2.1. High cost of organic pigments

      • 3.4.3.Opportunities

        • 3.4.3.1. Increasing demand for organic pigments from building and construction industry

    • 3.5.COVID-19 Impact Analysis on the market

    • 3.6.Pricing Analysis

    • 3.7.Patent Landscape

    • 3.8.Regulatory Guidelines

    • 3.9.Value Chain Analysis

  • CHAPTER 4: ORGANIC PIGMENTS MARKET, BY TYPE

    • 4.1 Overview

      • 4.1.1 Market size and forecast

    • 4.2 Azo Pigments

      • 4.2.1 Key market trends, growth factors and opportunities

      • 4.2.2 Market size and forecast, by region

      • 4.2.3 Market share analysis by country

    • 4.3 Phthalocyanine Pigments

      • 4.3.1 Key market trends, growth factors and opportunities

      • 4.3.2 Market size and forecast, by region

      • 4.3.3 Market share analysis by country

    • 4.4 High Performance Pigments (HPPs)

      • 4.4.1 Key market trends, growth factors and opportunities

      • 4.4.2 Market size and forecast, by region

      • 4.4.3 Market share analysis by country

    • 4.5 Alizarin

      • 4.5.1 Key market trends, growth factors and opportunities

      • 4.5.2 Market size and forecast, by region

      • 4.5.3 Market share analysis by country

    • 4.6 Arylide

      • 4.6.1 Key market trends, growth factors and opportunities

      • 4.6.2 Market size and forecast, by region

      • 4.6.3 Market share analysis by country

    • 4.7 Others

      • 4.7.1 Key market trends, growth factors and opportunities

      • 4.7.2 Market size and forecast, by region

      • 4.7.3 Market share analysis by country

  • CHAPTER 5: ORGANIC PIGMENTS MARKET, BY END USE INDUSTRY

    • 5.1 Overview

      • 5.1.1 Market size and forecast

    • 5.2 Paints and Coatings

      • 5.2.1 Key market trends, growth factors and opportunities

      • 5.2.2 Market size and forecast, by region

      • 5.2.3 Market share analysis by country

    • 5.3 Automotive

      • 5.3.1 Key market trends, growth factors and opportunities

      • 5.3.2 Market size and forecast, by region

      • 5.3.3 Market share analysis by country

    • 5.4 Plastics

      • 5.4.1 Key market trends, growth factors and opportunities

      • 5.4.2 Market size and forecast, by region

      • 5.4.3 Market share analysis by country

    • 5.5 Printing Inks

      • 5.5.1 Key market trends, growth factors and opportunities

      • 5.5.2 Market size and forecast, by region

      • 5.5.3 Market share analysis by country

    • 5.6 Packaging

      • 5.6.1 Key market trends, growth factors and opportunities

      • 5.6.2 Market size and forecast, by region

      • 5.6.3 Market share analysis by country

    • 5.7 Textile

      • 5.7.1 Key market trends, growth factors and opportunities

      • 5.7.2 Market size and forecast, by region

      • 5.7.3 Market share analysis by country

    • 5.8 Others

      • 5.8.1 Key market trends, growth factors and opportunities

      • 5.8.2 Market size and forecast, by region

      • 5.8.3 Market share analysis by country

  • CHAPTER 6: ORGANIC PIGMENTS MARKET, BY REGION

    • 6.1 Overview

      • 6.1.1 Market size and forecast

    • 6.2 North America

      • 6.2.1 Key trends and opportunities

      • 6.2.2 North America Market size and forecast, by Type

      • 6.2.3 North America Market size and forecast, by End Use Industry

      • 6.2.4 North America Market size and forecast, by country

        • 6.2.4.1 U.S.
          • 6.2.4.1.1 Key market trends, growth factors and opportunities
          • 6.2.4.1.2 Market size and forecast, by Type
          • 6.2.4.1.3 Market size and forecast, by End Use Industry
        • 6.2.4.2 Canada
          • 6.2.4.2.1 Key market trends, growth factors and opportunities
          • 6.2.4.2.2 Market size and forecast, by Type
          • 6.2.4.2.3 Market size and forecast, by End Use Industry
        • 6.2.4.3 Mexico
          • 6.2.4.3.1 Key market trends, growth factors and opportunities
          • 6.2.4.3.2 Market size and forecast, by Type
          • 6.2.4.3.3 Market size and forecast, by End Use Industry
    • 6.3 Europe

      • 6.3.1 Key trends and opportunities

      • 6.3.2 Europe Market size and forecast, by Type

      • 6.3.3 Europe Market size and forecast, by End Use Industry

      • 6.3.4 Europe Market size and forecast, by country

        • 6.3.4.1 Germany
          • 6.3.4.1.1 Key market trends, growth factors and opportunities
          • 6.3.4.1.2 Market size and forecast, by Type
          • 6.3.4.1.3 Market size and forecast, by End Use Industry
        • 6.3.4.2 UK
          • 6.3.4.2.1 Key market trends, growth factors and opportunities
          • 6.3.4.2.2 Market size and forecast, by Type
          • 6.3.4.2.3 Market size and forecast, by End Use Industry
        • 6.3.4.3 France
          • 6.3.4.3.1 Key market trends, growth factors and opportunities
          • 6.3.4.3.2 Market size and forecast, by Type
          • 6.3.4.3.3 Market size and forecast, by End Use Industry
        • 6.3.4.4 Spain
          • 6.3.4.4.1 Key market trends, growth factors and opportunities
          • 6.3.4.4.2 Market size and forecast, by Type
          • 6.3.4.4.3 Market size and forecast, by End Use Industry
        • 6.3.4.5 Italy
          • 6.3.4.5.1 Key market trends, growth factors and opportunities
          • 6.3.4.5.2 Market size and forecast, by Type
          • 6.3.4.5.3 Market size and forecast, by End Use Industry
        • 6.3.4.6 Rest of Europe
          • 6.3.4.6.1 Key market trends, growth factors and opportunities
          • 6.3.4.6.2 Market size and forecast, by Type
          • 6.3.4.6.3 Market size and forecast, by End Use Industry
    • 6.4 Asia-Pacific

      • 6.4.1 Key trends and opportunities

      • 6.4.2 Asia-Pacific Market size and forecast, by Type

      • 6.4.3 Asia-Pacific Market size and forecast, by End Use Industry

      • 6.4.4 Asia-Pacific Market size and forecast, by country

        • 6.4.4.1 China
          • 6.4.4.1.1 Key market trends, growth factors and opportunities
          • 6.4.4.1.2 Market size and forecast, by Type
          • 6.4.4.1.3 Market size and forecast, by End Use Industry
        • 6.4.4.2 India
          • 6.4.4.2.1 Key market trends, growth factors and opportunities
          • 6.4.4.2.2 Market size and forecast, by Type
          • 6.4.4.2.3 Market size and forecast, by End Use Industry
        • 6.4.4.3 Japan
          • 6.4.4.3.1 Key market trends, growth factors and opportunities
          • 6.4.4.3.2 Market size and forecast, by Type
          • 6.4.4.3.3 Market size and forecast, by End Use Industry
        • 6.4.4.4 South Korea
          • 6.4.4.4.1 Key market trends, growth factors and opportunities
          • 6.4.4.4.2 Market size and forecast, by Type
          • 6.4.4.4.3 Market size and forecast, by End Use Industry
        • 6.4.4.5 Australia
          • 6.4.4.5.1 Key market trends, growth factors and opportunities
          • 6.4.4.5.2 Market size and forecast, by Type
          • 6.4.4.5.3 Market size and forecast, by End Use Industry
        • 6.4.4.6 Rest of Asia-Pacific
          • 6.4.4.6.1 Key market trends, growth factors and opportunities
          • 6.4.4.6.2 Market size and forecast, by Type
          • 6.4.4.6.3 Market size and forecast, by End Use Industry
    • 6.5 LAMEA

      • 6.5.1 Key trends and opportunities

      • 6.5.2 LAMEA Market size and forecast, by Type

      • 6.5.3 LAMEA Market size and forecast, by End Use Industry

      • 6.5.4 LAMEA Market size and forecast, by country

        • 6.5.4.1 Brazil
          • 6.5.4.1.1 Key market trends, growth factors and opportunities
          • 6.5.4.1.2 Market size and forecast, by Type
          • 6.5.4.1.3 Market size and forecast, by End Use Industry
        • 6.5.4.2 Saudi Arabia
          • 6.5.4.2.1 Key market trends, growth factors and opportunities
          • 6.5.4.2.2 Market size and forecast, by Type
          • 6.5.4.2.3 Market size and forecast, by End Use Industry
        • 6.5.4.3 South Africa
          • 6.5.4.3.1 Key market trends, growth factors and opportunities
          • 6.5.4.3.2 Market size and forecast, by Type
          • 6.5.4.3.3 Market size and forecast, by End Use Industry
        • 6.5.4.4 Rest of LAMEA
          • 6.5.4.4.1 Key market trends, growth factors and opportunities
          • 6.5.4.4.2 Market size and forecast, by Type
          • 6.5.4.4.3 Market size and forecast, by End Use Industry
  • CHAPTER 7: COMPANY LANDSCAPE

    • 7.1. Introduction

    • 7.2. Top winning strategies

    • 7.3. Product Mapping of Top 10 Player

    • 7.4. Competitive Dashboard

    • 7.5. Competitive Heatmap

    • 7.6. Top player positioning, 2021

  • CHAPTER 8: COMPANY PROFILES

    • 8.1 Synthesia a.s.

      • 8.1.1 Company overview

      • 8.1.2 Key Executives

      • 8.1.3 Company snapshot

      • 8.1.4 Operating business segments

      • 8.1.5 Product portfolio

      • 8.1.6 Business performance

      • 8.1.7 Key strategic moves and developments

    • 8.2 LANXESS

      • 8.2.1 Company overview

      • 8.2.2 Key Executives

      • 8.2.3 Company snapshot

      • 8.2.4 Operating business segments

      • 8.2.5 Product portfolio

      • 8.2.6 Business performance

      • 8.2.7 Key strategic moves and developments

    • 8.3 Sudarshan Chemical Industries Limited

      • 8.3.1 Company overview

      • 8.3.2 Key Executives

      • 8.3.3 Company snapshot

      • 8.3.4 Operating business segments

      • 8.3.5 Product portfolio

      • 8.3.6 Business performance

      • 8.3.7 Key strategic moves and developments

    • 8.4 Clariant

      • 8.4.1 Company overview

      • 8.4.2 Key Executives

      • 8.4.3 Company snapshot

      • 8.4.4 Operating business segments

      • 8.4.5 Product portfolio

      • 8.4.6 Business performance

      • 8.4.7 Key strategic moves and developments

    • 8.5 Sun Chemical

      • 8.5.1 Company overview

      • 8.5.2 Key Executives

      • 8.5.3 Company snapshot

      • 8.5.4 Operating business segments

      • 8.5.5 Product portfolio

      • 8.5.6 Business performance

      • 8.5.7 Key strategic moves and developments

    • 8.6 Trust Chem Co. Ltd

      • 8.6.1 Company overview

      • 8.6.2 Key Executives

      • 8.6.3 Company snapshot

      • 8.6.4 Operating business segments

      • 8.6.5 Product portfolio

      • 8.6.6 Business performance

      • 8.6.7 Key strategic moves and developments

    • 8.7 TOYOCOLOR CO., LTD

      • 8.7.1 Company overview

      • 8.7.2 Key Executives

      • 8.7.3 Company snapshot

      • 8.7.4 Operating business segments

      • 8.7.5 Product portfolio

      • 8.7.6 Business performance

      • 8.7.7 Key strategic moves and developments

    • 8.8 Ferro Corporation

      • 8.8.1 Company overview

      • 8.8.2 Key Executives

      • 8.8.3 Company snapshot

      • 8.8.4 Operating business segments

      • 8.8.5 Product portfolio

      • 8.8.6 Business performance

      • 8.8.7 Key strategic moves and developments

    • 8.9 dic corporation

      • 8.9.1 Company overview

      • 8.9.2 Key Executives

      • 8.9.3 Company snapshot

      • 8.9.4 Operating business segments

      • 8.9.5 Product portfolio

      • 8.9.6 Business performance

      • 8.9.7 Key strategic moves and developments

    • 8.10 BASF SE

      • 8.10.1 Company overview

      • 8.10.2 Key Executives

      • 8.10.3 Company snapshot

      • 8.10.4 Operating business segments

      • 8.10.5 Product portfolio

      • 8.10.6 Business performance

      • 8.10.7 Key strategic moves and developments

  • LIST OF TABLES

  • TABLE 1. GLOBAL ORGANIC PIGMENTS MARKET, BY TYPE, 2021-2031 (REVENUE, $MILLION)
    TABLE 2. GLOBAL ORGANIC PIGMENTS MARKET, BY TYPE, 2021-2031 (VOLUME, TONS)
    TABLE 3. ORGANIC PIGMENTS MARKET FOR AZO PIGMENTS, BY REGION, 2021-2031 (REVENUE, $MILLION)
    TABLE 4. ORGANIC PIGMENTS MARKET FOR AZO PIGMENTS, BY REGION, 2021-2031 (VOLUME, TONS)
    TABLE 5. ORGANIC PIGMENTS MARKET FOR PHTHALOCYANINE PIGMENTS, BY REGION, 2021-2031 (REVENUE, $MILLION)
    TABLE 6. ORGANIC PIGMENTS MARKET FOR PHTHALOCYANINE PIGMENTS, BY REGION, 2021-2031 (VOLUME, TONS)
    TABLE 7. ORGANIC PIGMENTS MARKET FOR HIGH PERFORMANCE PIGMENTS (HPPS), BY REGION, 2021-2031 (REVENUE, $MILLION)
    TABLE 8. ORGANIC PIGMENTS MARKET FOR HIGH PERFORMANCE PIGMENTS (HPPS), BY REGION, 2021-2031 (VOLUME, TONS)
    TABLE 9. ORGANIC PIGMENTS MARKET FOR ALIZARIN, BY REGION, 2021-2031 (REVENUE, $MILLION)
    TABLE 10. ORGANIC PIGMENTS MARKET FOR ALIZARIN, BY REGION, 2021-2031 (VOLUME, TONS)
    TABLE 11. ORGANIC PIGMENTS MARKET FOR ARYLIDE, BY REGION, 2021-2031 (REVENUE, $MILLION)
    TABLE 12. ORGANIC PIGMENTS MARKET FOR ARYLIDE, BY REGION, 2021-2031 (VOLUME, TONS)
    TABLE 13. ORGANIC PIGMENTS MARKET FOR OTHERS, BY REGION, 2021-2031 (REVENUE, $MILLION)
    TABLE 14. ORGANIC PIGMENTS MARKET FOR OTHERS, BY REGION, 2021-2031 (VOLUME, TONS)
    TABLE 15. GLOBAL ORGANIC PIGMENTS MARKET, BY END USE INDUSTRY, 2021-2031 (REVENUE, $MILLION)
    TABLE 16. GLOBAL ORGANIC PIGMENTS MARKET, BY END USE INDUSTRY, 2021-2031 (VOLUME, TONS)
    TABLE 17. ORGANIC PIGMENTS MARKET FOR PAINTS AND COATINGS, BY REGION, 2021-2031 (REVENUE, $MILLION)
    TABLE 18. ORGANIC PIGMENTS MARKET FOR PAINTS AND COATINGS, BY REGION, 2021-2031 (VOLUME, TONS)
    TABLE 19. ORGANIC PIGMENTS MARKET FOR AUTOMOTIVE, BY REGION, 2021-2031 (REVENUE, $MILLION)
    TABLE 20. ORGANIC PIGMENTS MARKET FOR AUTOMOTIVE, BY REGION, 2021-2031 (VOLUME, TONS)
    TABLE 21. ORGANIC PIGMENTS MARKET FOR PLASTICS, BY REGION, 2021-2031 (REVENUE, $MILLION)
    TABLE 22. ORGANIC PIGMENTS MARKET FOR PLASTICS, BY REGION, 2021-2031 (VOLUME, TONS)
    TABLE 23. ORGANIC PIGMENTS MARKET FOR PRINTING INKS, BY REGION, 2021-2031 (REVENUE, $MILLION)
    TABLE 24. ORGANIC PIGMENTS MARKET FOR PRINTING INKS, BY REGION, 2021-2031 (VOLUME, TONS)
    TABLE 25. ORGANIC PIGMENTS MARKET FOR PACKAGING, BY REGION, 2021-2031 (REVENUE, $MILLION)
    TABLE 26. ORGANIC PIGMENTS MARKET FOR PACKAGING, BY REGION, 2021-2031 (VOLUME, TONS)
    TABLE 27. ORGANIC PIGMENTS MARKET FOR TEXTILE, BY REGION, 2021-2031 (REVENUE, $MILLION)
    TABLE 28. ORGANIC PIGMENTS MARKET FOR TEXTILE, BY REGION, 2021-2031 (VOLUME, TONS)
    TABLE 29. ORGANIC PIGMENTS MARKET FOR OTHERS, BY REGION, 2021-2031 (REVENUE, $MILLION)
    TABLE 30. ORGANIC PIGMENTS MARKET FOR OTHERS, BY REGION, 2021-2031 (VOLUME, TONS)
    TABLE 31. ORGANIC PIGMENTS MARKET, BY REGION, 2021-2031 (REVENUE, $MILLION)
    TABLE 32. ORGANIC PIGMENTS MARKET, BY REGION, 2021-2031 (VOLUME, TONS)
    TABLE 33. NORTH AMERICA ORGANIC PIGMENTS MARKET, BY TYPE, 2021-2031 (REVENUE, $MILLION)
    TABLE 34. NORTH AMERICA ORGANIC PIGMENTS MARKET, BY TYPE, 2021-2031 (VOLUME, TONS)
    TABLE 35. NORTH AMERICA ORGANIC PIGMENTS MARKET, BY END USE INDUSTRY, 2021-2031 (REVENUE, $MILLION)
    TABLE 36. NORTH AMERICA ORGANIC PIGMENTS MARKET, BY END USE INDUSTRY, 2021-2031 (VOLUME, TONS)
    TABLE 37. NORTH AMERICA ORGANIC PIGMENTS MARKET, BY COUNTRY, 2021-2031 (REVENUE, $MILLION)
    TABLE 38. NORTH AMERICA ORGANIC PIGMENTS MARKET, BY COUNTRY, 2021-2031 (VOLUME, TONS)
    TABLE 39. U.S. ORGANIC PIGMENTS MARKET, BY TYPE, 2021-2031 (REVENUE, $MILLION)
    TABLE 40. U.S. ORGANIC PIGMENTS MARKET, BY TYPE, 2021-2031 (VOLUME, TONS)
    TABLE 41. U.S. ORGANIC PIGMENTS MARKET, BY END USE INDUSTRY, 2021-2031 (REVENUE, $MILLION)
    TABLE 42. U.S. ORGANIC PIGMENTS MARKET, BY END USE INDUSTRY, 2021-2031 (VOLUME, TONS)
    TABLE 43. CANADA ORGANIC PIGMENTS MARKET, BY TYPE, 2021-2031 (REVENUE, $MILLION)
    TABLE 44. CANADA ORGANIC PIGMENTS MARKET, BY TYPE, 2021-2031 (VOLUME, TONS)
    TABLE 45. CANADA ORGANIC PIGMENTS MARKET, BY END USE INDUSTRY, 2021-2031 (REVENUE, $MILLION)
    TABLE 46. CANADA ORGANIC PIGMENTS MARKET, BY END USE INDUSTRY, 2021-2031 (VOLUME, TONS)
    TABLE 47. MEXICO ORGANIC PIGMENTS MARKET, BY TYPE, 2021-2031 (REVENUE, $MILLION)
    TABLE 48. MEXICO ORGANIC PIGMENTS MARKET, BY TYPE, 2021-2031 (VOLUME, TONS)
    TABLE 49. MEXICO ORGANIC PIGMENTS MARKET, BY END USE INDUSTRY, 2021-2031 (REVENUE, $MILLION)
    TABLE 50. MEXICO ORGANIC PIGMENTS MARKET, BY END USE INDUSTRY, 2021-2031 (VOLUME, TONS)
    TABLE 51. EUROPE ORGANIC PIGMENTS MARKET, BY TYPE, 2021-2031 (REVENUE, $MILLION)
    TABLE 52. EUROPE ORGANIC PIGMENTS MARKET, BY TYPE, 2021-2031 (VOLUME, TONS)
    TABLE 53. EUROPE ORGANIC PIGMENTS MARKET, BY END USE INDUSTRY, 2021-2031 (REVENUE, $MILLION)
    TABLE 54. EUROPE ORGANIC PIGMENTS MARKET, BY END USE INDUSTRY, 2021-2031 (VOLUME, TONS)
    TABLE 55. EUROPE ORGANIC PIGMENTS MARKET, BY COUNTRY, 2021-2031 (REVENUE, $MILLION)
    TABLE 56. EUROPE ORGANIC PIGMENTS MARKET, BY COUNTRY, 2021-2031 (VOLUME, TONS)
    TABLE 57. GERMANY ORGANIC PIGMENTS MARKET, BY TYPE, 2021-2031 (REVENUE, $MILLION)
    TABLE 58. GERMANY ORGANIC PIGMENTS MARKET, BY TYPE, 2021-2031 (VOLUME, TONS)
    TABLE 59. GERMANY ORGANIC PIGMENTS MARKET, BY END USE INDUSTRY, 2021-2031 (REVENUE, $MILLION)
    TABLE 60. GERMANY ORGANIC PIGMENTS MARKET, BY END USE INDUSTRY, 2021-2031 (VOLUME, TONS)
    TABLE 61. UK ORGANIC PIGMENTS MARKET, BY TYPE, 2021-2031 (REVENUE, $MILLION)
    TABLE 62. UK ORGANIC PIGMENTS MARKET, BY TYPE, 2021-2031 (VOLUME, TONS)
    TABLE 63. UK ORGANIC PIGMENTS MARKET, BY END USE INDUSTRY, 2021-2031 (REVENUE, $MILLION)
    TABLE 64. UK ORGANIC PIGMENTS MARKET, BY END USE INDUSTRY, 2021-2031 (VOLUME, TONS)
    TABLE 65. FRANCE ORGANIC PIGMENTS MARKET, BY TYPE, 2021-2031 (REVENUE, $MILLION)
    TABLE 66. FRANCE ORGANIC PIGMENTS MARKET, BY TYPE, 2021-2031 (VOLUME, TONS)
    TABLE 67. FRANCE ORGANIC PIGMENTS MARKET, BY END USE INDUSTRY, 2021-2031 (REVENUE, $MILLION)
    TABLE 68. FRANCE ORGANIC PIGMENTS MARKET, BY END USE INDUSTRY, 2021-2031 (VOLUME, TONS)
    TABLE 69. SPAIN ORGANIC PIGMENTS MARKET, BY TYPE, 2021-2031 (REVENUE, $MILLION)
    TABLE 70. SPAIN ORGANIC PIGMENTS MARKET, BY TYPE, 2021-2031 (VOLUME, TONS)
    TABLE 71. SPAIN ORGANIC PIGMENTS MARKET, BY END USE INDUSTRY, 2021-2031 (REVENUE, $MILLION)
    TABLE 72. SPAIN ORGANIC PIGMENTS MARKET, BY END USE INDUSTRY, 2021-2031 (VOLUME, TONS)
    TABLE 73. ITALY ORGANIC PIGMENTS MARKET, BY TYPE, 2021-2031 (REVENUE, $MILLION)
    TABLE 74. ITALY ORGANIC PIGMENTS MARKET, BY TYPE, 2021-2031 (VOLUME, TONS)
    TABLE 75. ITALY ORGANIC PIGMENTS MARKET, BY END USE INDUSTRY, 2021-2031 (REVENUE, $MILLION)
    TABLE 76. ITALY ORGANIC PIGMENTS MARKET, BY END USE INDUSTRY, 2021-2031 (VOLUME, TONS)
    TABLE 77. REST OF EUROPE ORGANIC PIGMENTS MARKET, BY TYPE, 2021-2031 (REVENUE, $MILLION)
    TABLE 78. REST OF EUROPE ORGANIC PIGMENTS MARKET, BY TYPE, 2021-2031 (VOLUME, TONS)
    TABLE 79. REST OF EUROPE ORGANIC PIGMENTS MARKET, BY END USE INDUSTRY, 2021-2031 (REVENUE, $MILLION)
    TABLE 80. REST OF EUROPE ORGANIC PIGMENTS MARKET, BY END USE INDUSTRY, 2021-2031 (VOLUME, TONS)
    TABLE 81. ASIA-PACIFIC ORGANIC PIGMENTS MARKET, BY TYPE, 2021-2031 (REVENUE, $MILLION)
    TABLE 82. ASIA-PACIFIC ORGANIC PIGMENTS MARKET, BY TYPE, 2021-2031 (VOLUME, TONS)
    TABLE 83. ASIA-PACIFIC ORGANIC PIGMENTS MARKET, BY END USE INDUSTRY, 2021-2031 (REVENUE, $MILLION)
    TABLE 84. ASIA-PACIFIC ORGANIC PIGMENTS MARKET, BY END USE INDUSTRY, 2021-2031 (VOLUME, TONS)
    TABLE 85. ASIA-PACIFIC ORGANIC PIGMENTS MARKET, BY COUNTRY, 2021-2031 (REVENUE, $MILLION)
    TABLE 86. ASIA-PACIFIC ORGANIC PIGMENTS MARKET, BY COUNTRY, 2021-2031 (VOLUME, TONS)
    TABLE 87. CHINA ORGANIC PIGMENTS MARKET, BY TYPE, 2021-2031 (REVENUE, $MILLION)
    TABLE 88. CHINA ORGANIC PIGMENTS MARKET, BY TYPE, 2021-2031 (VOLUME, TONS)
    TABLE 89. CHINA ORGANIC PIGMENTS MARKET, BY END USE INDUSTRY, 2021-2031 (REVENUE, $MILLION)
    TABLE 90. CHINA ORGANIC PIGMENTS MARKET, BY END USE INDUSTRY, 2021-2031 (VOLUME, TONS)
    TABLE 91. INDIA ORGANIC PIGMENTS MARKET, BY TYPE, 2021-2031 (REVENUE, $MILLION)
    TABLE 92. INDIA ORGANIC PIGMENTS MARKET, BY TYPE, 2021-2031 (VOLUME, TONS)
    TABLE 93. INDIA ORGANIC PIGMENTS MARKET, BY END USE INDUSTRY, 2021-2031 (REVENUE, $MILLION)
    TABLE 94. INDIA ORGANIC PIGMENTS MARKET, BY END USE INDUSTRY, 2021-2031 (VOLUME, TONS)
    TABLE 95. JAPAN ORGANIC PIGMENTS MARKET, BY TYPE, 2021-2031 (REVENUE, $MILLION)
    TABLE 96. JAPAN ORGANIC PIGMENTS MARKET, BY TYPE, 2021-2031 (VOLUME, TONS)
    TABLE 97. JAPAN ORGANIC PIGMENTS MARKET, BY END USE INDUSTRY, 2021-2031 (REVENUE, $MILLION)
    TABLE 98. JAPAN ORGANIC PIGMENTS MARKET, BY END USE INDUSTRY, 2021-2031 (VOLUME, TONS)
    TABLE 99. SOUTH KOREA ORGANIC PIGMENTS MARKET, BY TYPE, 2021-2031 (REVENUE, $MILLION)
    TABLE 100. SOUTH KOREA ORGANIC PIGMENTS MARKET, BY TYPE, 2021-2031 (VOLUME, TONS)
    TABLE 101. SOUTH KOREA ORGANIC PIGMENTS MARKET, BY END USE INDUSTRY, 2021-2031 (REVENUE, $MILLION)
    TABLE 102. SOUTH KOREA ORGANIC PIGMENTS MARKET, BY END USE INDUSTRY, 2021-2031 (VOLUME, TONS)
    TABLE 103. AUSTRALIA ORGANIC PIGMENTS MARKET, BY TYPE, 2021-2031 (REVENUE, $MILLION)
    TABLE 104. AUSTRALIA ORGANIC PIGMENTS MARKET, BY TYPE, 2021-2031 (VOLUME, TONS)
    TABLE 105. AUSTRALIA ORGANIC PIGMENTS MARKET, BY END USE INDUSTRY, 2021-2031 (REVENUE, $MILLION)
    TABLE 106. AUSTRALIA ORGANIC PIGMENTS MARKET, BY END USE INDUSTRY, 2021-2031 (VOLUME, TONS)
    TABLE 107. REST OF ASIA-PACIFIC ORGANIC PIGMENTS MARKET, BY TYPE, 2021-2031 (REVENUE, $MILLION)
    TABLE 108. REST OF ASIA-PACIFIC ORGANIC PIGMENTS MARKET, BY TYPE, 2021-2031 (VOLUME, TONS)
    TABLE 109. REST OF ASIA-PACIFIC ORGANIC PIGMENTS MARKET, BY END USE INDUSTRY, 2021-2031 (REVENUE, $MILLION)
    TABLE 110. REST OF ASIA-PACIFIC ORGANIC PIGMENTS MARKET, BY END USE INDUSTRY, 2021-2031 (VOLUME, TONS)
    TABLE 111. LAMEA ORGANIC PIGMENTS MARKET, BY TYPE, 2021-2031 (REVENUE, $MILLION)
    TABLE 112. LAMEA ORGANIC PIGMENTS MARKET, BY TYPE, 2021-2031 (VOLUME, TONS)
    TABLE 113. LAMEA ORGANIC PIGMENTS MARKET, BY END USE INDUSTRY, 2021-2031 (REVENUE, $MILLION)
    TABLE 114. LAMEA ORGANIC PIGMENTS MARKET, BY END USE INDUSTRY, 2021-2031 (VOLUME, TONS)
    TABLE 115. LAMEA ORGANIC PIGMENTS MARKET, BY COUNTRY, 2021-2031 (REVENUE, $MILLION)
    TABLE 116. LAMEA ORGANIC PIGMENTS MARKET, BY COUNTRY, 2021-2031 (VOLUME, TONS)
    TABLE 117. BRAZIL ORGANIC PIGMENTS MARKET, BY TYPE, 2021-2031 (REVENUE, $MILLION)
    TABLE 118. BRAZIL ORGANIC PIGMENTS MARKET, BY TYPE, 2021-2031 (VOLUME, TONS)
    TABLE 119. BRAZIL ORGANIC PIGMENTS MARKET, BY END USE INDUSTRY, 2021-2031 (REVENUE, $MILLION)
    TABLE 120. BRAZIL ORGANIC PIGMENTS MARKET, BY END USE INDUSTRY, 2021-2031 (VOLUME, TONS)
    TABLE 121. SAUDI ARABIA ORGANIC PIGMENTS MARKET, BY TYPE, 2021-2031 (REVENUE, $MILLION)
    TABLE 122. SAUDI ARABIA ORGANIC PIGMENTS MARKET, BY TYPE, 2021-2031 (VOLUME, TONS)
    TABLE 123. SAUDI ARABIA ORGANIC PIGMENTS MARKET, BY END USE INDUSTRY, 2021-2031 (REVENUE, $MILLION)
    TABLE 124. SAUDI ARABIA ORGANIC PIGMENTS MARKET, BY END USE INDUSTRY, 2021-2031 (VOLUME, TONS)
    TABLE 125. SOUTH AFRICA ORGANIC PIGMENTS MARKET, BY TYPE, 2021-2031 (REVENUE, $MILLION)
    TABLE 126. SOUTH AFRICA ORGANIC PIGMENTS MARKET, BY TYPE, 2021-2031 (VOLUME, TONS)
    TABLE 127. SOUTH AFRICA ORGANIC PIGMENTS MARKET, BY END USE INDUSTRY, 2021-2031 (REVENUE, $MILLION)
    TABLE 128. SOUTH AFRICA ORGANIC PIGMENTS MARKET, BY END USE INDUSTRY, 2021-2031 (VOLUME, TONS)
    TABLE 129. REST OF LAMEA ORGANIC PIGMENTS MARKET, BY TYPE, 2021-2031 (REVENUE, $MILLION)
    TABLE 130. REST OF LAMEA ORGANIC PIGMENTS MARKET, BY TYPE, 2021-2031 (VOLUME, TONS)
    TABLE 131. REST OF LAMEA ORGANIC PIGMENTS MARKET, BY END USE INDUSTRY, 2021-2031 (REVENUE, $MILLION)
    TABLE 132. REST OF LAMEA ORGANIC PIGMENTS MARKET, BY END USE INDUSTRY, 2021-2031 (VOLUME, TONS)
    TABLE 133.SYNTHESIA A.S.: COMPANY SNAPSHOT
    TABLE 133.SYNTHESIA A.S.: KEY EXECUTIVES
    TABLE 134.SYNTHESIA A.S.: OPERATING SEGMENTS
    TABLE 135.SYNTHESIA A.S.: PRODUCT PORTFOLIO
    TABLE 136.SYNTHESIA A.S.: NET SALES
    TABLE 137.SYNTHESIA A.S.: KEY STRATERGIES
    TABLE 139.LANXESS: KEY EXECUTIVES
    TABLE 139.LANXESS: COMPANY SNAPSHOT
    TABLE 140.LANXESS: OPERATING SEGMENTS
    TABLE 141.LANXESS: PRODUCT PORTFOLIO
    TABLE 142.LANXESS: NET SALES
    TABLE 143.LANXESS: KEY STRATERGIES
    TABLE 145.SUDARSHAN CHEMICAL INDUSTRIES LIMITED: KEY EXECUTIVES
    TABLE 145.SUDARSHAN CHEMICAL INDUSTRIES LIMITED: COMPANY SNAPSHOT
    TABLE 146.SUDARSHAN CHEMICAL INDUSTRIES LIMITED: OPERATING SEGMENTS
    TABLE 147.SUDARSHAN CHEMICAL INDUSTRIES LIMITED: PRODUCT PORTFOLIO
    TABLE 148.SUDARSHAN CHEMICAL INDUSTRIES LIMITED: NET SALES
    TABLE 149.SUDARSHAN CHEMICAL INDUSTRIES LIMITED: KEY STRATERGIES
    TABLE 151.CLARIANT: KEY EXECUTIVES
    TABLE 151.CLARIANT: COMPANY SNAPSHOT
    TABLE 152.CLARIANT: OPERATING SEGMENTS
    TABLE 153.CLARIANT: PRODUCT PORTFOLIO
    TABLE 154.CLARIANT: NET SALES
    TABLE 155.CLARIANT: KEY STRATERGIES
    TABLE 157.SUN CHEMICAL: KEY EXECUTIVES
    TABLE 157.SUN CHEMICAL: COMPANY SNAPSHOT
    TABLE 158.SUN CHEMICAL: OPERATING SEGMENTS
    TABLE 159.SUN CHEMICAL: PRODUCT PORTFOLIO
    TABLE 160.SUN CHEMICAL: NET SALES
    TABLE 161.SUN CHEMICAL: KEY STRATERGIES
    TABLE 163.TRUST CHEM CO. LTD: KEY EXECUTIVES
    TABLE 163.TRUST CHEM CO. LTD: COMPANY SNAPSHOT
    TABLE 164.TRUST CHEM CO. LTD: OPERATING SEGMENTS
    TABLE 165.TRUST CHEM CO. LTD: PRODUCT PORTFOLIO
    TABLE 166.TRUST CHEM CO. LTD: NET SALES
    TABLE 167.TRUST CHEM CO. LTD: KEY STRATERGIES
    TABLE 169.TOYOCOLOR CO., LTD: KEY EXECUTIVES
    TABLE 169.TOYOCOLOR CO., LTD: COMPANY SNAPSHOT
    TABLE 170.TOYOCOLOR CO., LTD: OPERATING SEGMENTS
    TABLE 171.TOYOCOLOR CO., LTD: PRODUCT PORTFOLIO
    TABLE 172.TOYOCOLOR CO., LTD: NET SALES
    TABLE 173.TOYOCOLOR CO., LTD: KEY STRATERGIES
    TABLE 175.FERRO CORPORATION: KEY EXECUTIVES
    TABLE 175.FERRO CORPORATION: COMPANY SNAPSHOT
    TABLE 176.FERRO CORPORATION: OPERATING SEGMENTS
    TABLE 177.FERRO CORPORATION: PRODUCT PORTFOLIO
    TABLE 178.FERRO CORPORATION: NET SALES
    TABLE 179.FERRO CORPORATION: KEY STRATERGIES
    TABLE 181.DIC CORPORATION: KEY EXECUTIVES
    TABLE 181.DIC CORPORATION: COMPANY SNAPSHOT
    TABLE 182.DIC CORPORATION: OPERATING SEGMENTS
    TABLE 183.DIC CORPORATION: PRODUCT PORTFOLIO
    TABLE 184.DIC CORPORATION: NET SALES
    TABLE 185.DIC CORPORATION: KEY STRATERGIES
    TABLE 187.BASF SE: COMPANY SNAPSHOT
    TABLE 187.BASF SE: KEY EXECUTIVES
    TABLE 188.BASF SE: OPERATING SEGMENTS
    TABLE 189.BASF SE: PRODUCT PORTFOLIO
    TABLE 190.BASF SE: NET SALES
    TABLE 191.BASF SE: KEY STRATERGIES
  • LIST OF FIGURES

  • FIGURE 1. SEGMENTATION OF ORGANIC PIGMENTS MARKET,2021-2031
    FIGURE 2.ORGANIC PIGMENTS MARKET,2021-2031
    FIGURE 3. TOP INVESTMENT POCKETS, BY REGION
    FIGURE 4.PORTER FIVE-1
    FIGURE 5.PORTER FIVE-2
    FIGURE 6.PORTER FIVE-3
    FIGURE 7.PORTER FIVE-4
    FIGURE 8.PORTER FIVE-5
    FIGURE 9.ORGANIC PIGMENTS MARKET:DRIVERS, RESTRAINTS AND OPPORTUNITIES
    FIGURE 10.PRICING ANALYSIS
    FIGURE 11.PATENT ANALYSIS BY COMPANY
    FIGURE 12.PATENT ANALYSIS BY COUNTRY
    FIGURE 13.REGULATORY GUIDELINES
    FIGURE 14.VALUE CHAIN ANALYSIS
    FIGURE 15.ORGANIC PIGMENTS MARKET,BY TYPE,2021(%)
    FIGURE 16.COMPARATIVE SHARE ANALYSIS OF AZO PIGMENTS ORGANIC PIGMENTS MARKET, 2021 AND 2031(%)
    FIGURE 17.COMPARATIVE SHARE ANALYSIS OF PHTHALOCYANINE PIGMENTS ORGANIC PIGMENTS MARKET, 2021 AND 2031(%)
    FIGURE 18.COMPARATIVE SHARE ANALYSIS OF HIGH PERFORMANCE PIGMENTS (HPPS) ORGANIC PIGMENTS MARKET, 2021 AND 2031(%)
    FIGURE 19.COMPARATIVE SHARE ANALYSIS OF ALIZARIN ORGANIC PIGMENTS MARKET, 2021 AND 2031(%)
    FIGURE 20.COMPARATIVE SHARE ANALYSIS OF ARYLIDE ORGANIC PIGMENTS MARKET, 2021 AND 2031(%)
    FIGURE 21.COMPARATIVE SHARE ANALYSIS OF OTHERS ORGANIC PIGMENTS MARKET, 2021 AND 2031(%)
    FIGURE 22.ORGANIC PIGMENTS MARKET,BY END USE INDUSTRY,2021(%)
    FIGURE 23.COMPARATIVE SHARE ANALYSIS OF PAINTS AND COATINGS ORGANIC PIGMENTS MARKET, 2021 AND 2031(%)
    FIGURE 24.COMPARATIVE SHARE ANALYSIS OF AUTOMOTIVE ORGANIC PIGMENTS MARKET, 2021 AND 2031(%)
    FIGURE 25.COMPARATIVE SHARE ANALYSIS OF PLASTICS ORGANIC PIGMENTS MARKET, 2021 AND 2031(%)
    FIGURE 26.COMPARATIVE SHARE ANALYSIS OF PRINTING INKS ORGANIC PIGMENTS MARKET, 2021 AND 2031(%)
    FIGURE 27.COMPARATIVE SHARE ANALYSIS OF PACKAGING ORGANIC PIGMENTS MARKET, 2021 AND 2031(%)
    FIGURE 28.COMPARATIVE SHARE ANALYSIS OF TEXTILE ORGANIC PIGMENTS MARKET, 2021 AND 2031(%)
    FIGURE 29.COMPARATIVE SHARE ANALYSIS OF OTHERS ORGANIC PIGMENTS MARKET, 2021 AND 2031(%)
    FIGURE 30.ORGANIC PIGMENTS MARKET BY REGION,2021
    FIGURE 31.U.S. ORGANIC PIGMENTS MARKET,2021-2031($MILLION)
    FIGURE 32.CANADA ORGANIC PIGMENTS MARKET,2021-2031($MILLION)
    FIGURE 33.MEXICO ORGANIC PIGMENTS MARKET,2021-2031($MILLION)
    FIGURE 34.GERMANY ORGANIC PIGMENTS MARKET,2021-2031($MILLION)
    FIGURE 35.UK ORGANIC PIGMENTS MARKET,2021-2031($MILLION)
    FIGURE 36.FRANCE ORGANIC PIGMENTS MARKET,2021-2031($MILLION)
    FIGURE 37.SPAIN ORGANIC PIGMENTS MARKET,2021-2031($MILLION)
    FIGURE 38.ITALY ORGANIC PIGMENTS MARKET,2021-2031($MILLION)
    FIGURE 39.REST OF EUROPE ORGANIC PIGMENTS MARKET,2021-2031($MILLION)
    FIGURE 40.CHINA ORGANIC PIGMENTS MARKET,2021-2031($MILLION)
    FIGURE 41.INDIA ORGANIC PIGMENTS MARKET,2021-2031($MILLION)
    FIGURE 42.JAPAN ORGANIC PIGMENTS MARKET,2021-2031($MILLION)
    FIGURE 43.SOUTH KOREA ORGANIC PIGMENTS MARKET,2021-2031($MILLION)
    FIGURE 44.AUSTRALIA ORGANIC PIGMENTS MARKET,2021-2031($MILLION)
    FIGURE 45.REST OF ASIA-PACIFIC ORGANIC PIGMENTS MARKET,2021-2031($MILLION)
    FIGURE 46.BRAZIL ORGANIC PIGMENTS MARKET,2021-2031($MILLION)
    FIGURE 47.SAUDI ARABIA ORGANIC PIGMENTS MARKET,2021-2031($MILLION)
    FIGURE 48.SOUTH AFRICA ORGANIC PIGMENTS MARKET,2021-2031($MILLION)
    FIGURE 49.REST OF LAMEA ORGANIC PIGMENTS MARKET,2021-2031($MILLION)
    FIGURE 50. TOP WINNING STRATEGIES, BY YEAR
    FIGURE 51. TOP WINNING STRATEGIES, BY DEVELOPMENT
    FIGURE 52. TOP WINNING STRATEGIES, BY COMPANY
    FIGURE 53.PRODUCT MAPPING OF TOP 10 PLAYERS
    FIGURE 54.COMPETITIVE DASHBOARD
    FIGURE 55.COMPETITIVE HEATMAP OF TOP 10 KEY PLAYERS
    FIGURE 56.TOP PLAYER POSITIONING, 2021
    FIGURE 57.SYNTHESIA A.S..: NET SALES ($MILLION)
    FIGURE 58.LANXESS.: NET SALES ($MILLION)
    FIGURE 59.SUDARSHAN CHEMICAL INDUSTRIES LIMITED.: NET SALES ($MILLION)
    FIGURE 60.CLARIANT.: NET SALES ($MILLION)
    FIGURE 61.SUN CHEMICAL.: NET SALES ($MILLION)
    FIGURE 62.TRUST CHEM CO. LTD.: NET SALES ($MILLION)
    FIGURE 63.TOYOCOLOR CO., LTD.: NET SALES ($MILLION)
    FIGURE 64.FERRO CORPORATION.: NET SALES ($MILLION)
    FIGURE 65.DIC CORPORATION.: NET SALES ($MILLION)
    FIGURE 66.BASF SE.: NET SALES ($MILLION)


According to the insights of the CXOs of leading companies, the global organic pigment market is expanding at a rapid rate due to factors such as the increased demand for organic pigments in the packaging industry to improve the appearance of products. In addition, government measures promoting the use of printing ink in food-contact items are expected to boost demand for organic pigment in the coming periods. However, the high cost of organic materials compared to inorganic materials may hamper the growth of the organic pigment market. Similarly, the increase in demand from the cosmetic industry has led to the continuous development of high-value organic pigments, which may present market players with lucrative opportunities in the coming years.

PURCHASE OPTIONS

Call or Email us

U.S.-Canada Toll-free: +1-800-792-5285
Int'l : +1-503-894-6022
Europe : +44-845-528-1300
Email : help@alliedmarketresearch.com
 
FREQUENTLY ASKED QUESTIONS?

A. The organic pigments market attained $5.6 billion in 2021 and is projected to reach $8.4 billion by 2031, growing at a CAGR of 4.2% from 2022 to 2031 s the estimated industry size of Organic Pigments.

A. Increased demand for organic pigments in the plastic packaging industry is the main driver of organic pigments market.

A. Asia-Pacific is the largest regional market for Organic Pigments.

A. High-performance pigments (HPPs) is expected to drive the adoption of of organic pogments.

A. Printing Inks is the leading end-use industry of Organic Pigments Market.

A. BASF SE, Clariant, DIC Corporation, Ferro Corporation, LANXESS, Sudarshan Chemical Industries Limited, Sun Chemical, Synthesia a.s., TOYOCOLOR CO., LTD, and Trust Chem Co. Ltd. are the top companies to hold the market share in Organic Pigments.

A. The automobile industry is a significant market for organic pigments. In the recent past, the demand for automobiles has increased rapidly is the the upcoming trends of Organic Pigments Market in the world.

Looking for Customization?

 Customization Request

Have a Question?

 Speak with Analyst

Any Confusion?

 Inquire Before Buying

Have a glance of the Report

  Request Sample
RELATED TAGS

Purchase Full Report of
Organic Pigments Market

Start reading instantly.
This Report and over 66,905+ more Reports, Available with Avenue Library. T&C*.

  • Online Only
  • $3,570
  • Online cloud access only
  • Restricted print, copy, paste & download
  • Read only
  • Free industry update
    (Within 180 days)
  • Free report update in next update cycle
    (Nov 2023 - Nov 2024)
  • Data Pack
  • $3,840
  • Restricted to one authorized user
  • One print only
  • Available in
    Excel
  • Free industry update
    (Within 180 days)
  •   Free report update in next update cycle
    (Nov 2023 - Nov 2024)
  • Single User
  • $5,730
  • Restricted to one authorized user
  • One print only
  • Available in
    PDF
  • Free industry update
    (Within 180 days)
  •   Free report update in next update cycle
    (Nov 2023 - Nov 2024)
  • Five Users
  • $6,450
  • Limited to five authorized users
  • Print upto five copies
  • Available in
    PDF
  • Free industry update
    (Within 180 days)
  •   Free report update in next update cycle
    (Nov 2023 - Nov 2024)
  • Enterprise
    License/PDF

  • $9,600
  • Unlimited
    within
    company/enterprise
  • Available in Excel & PDF
  • Free industry update
    (Within 180 days)
  •   Free report update in next update cycle
    (Nov 2023 - Nov 2024)
  • Library
    Membership

  • $999 $ 1,175
    Per User/ Per month/ Billed annually
  • Published Content
    E-access
  • Company Profiles
    E-access
  • Newly Added Content Access
  • 10 PDF
    Downloads
  • 5 Excel Data
    Pack Downloads
  • 250 Company Profiles PDF Downloads
  • Buy Now

*Taxes/Fees, if applicable will be added during checkout. All prices in USD

RELATED REPORTS
 

Why Allied Market Research?


Infallible Methodology

To ensure high-level data integrity, accurate analysis, and impeccable forecasts

Analyst Support

For complete satisfaction

Customization

On-demand customization of scope of the report to exactly meet your needs

TARGETED MARKET VIEW

Targeted market view to provide pertinent information and save time of readers

Get fresh content delivered

Get insights on topics that are crucial for your business. Stay abreast of your interest areas.

Get Industry Data Alerts

Why Allied Market Research?

Infallible Methodology

To ensure high-level data integrity, accurate analysis, and impeccable forecasts

Analyst Support

For complete satisfaction

Customization

On-demand customization of scope of the report to exactly meet your needs

TARGETED MARKET VIEW

Targeted market view to provide pertinent information and save time of readers